Rehan Khalil, Sanna Koskimäki, Hanna Lähde, Shyam Bhetuwal, Lauri Koivunen, Veera Houttu, Kirsi Laitinen, Tuomas Mäkilä (2026). Assessing Hospital Patient Nutrient Intake with an AI-Powered Food Recognition System – A Feasibility Study of the FlavoriaFlex solution. In: Healthcare and Medical Devices. AHFE Open Access, vol. 211, pp. 20–30. https://doi.org/10.54941/ahfe1007465
Adequate dietary intake is essential for positive clinical outcomes of hospitalized patients, yet monitoring food intake is labor-intensive and often subjective. AI-based food recognition could automate monitoring and assessment, but evidence in real-world hospital settings is limited. This study evaluated an AI-powered food recognition system, FlavoriaFlex, to assess its detection performance, deployment feasibility, and acceptability among dietitians. Previously validated in restaurant (F1 0.75, weight MAE 23.6 g, energy MAE 235 kcal), the system was deployed in a hospital ward for six days. A total of 133 meals were recorded; 102 had paired leftover images (235 total images). Manual annotation of 483 food segments provided ground truth for evaluating food recognition and menu mapping. Semi-structured interviews with dietitians assessed usability, perceived benefits, and clinical value. FlavoriaFlex enabled automatic estimation of item- and meal-level consumption, including weights and energy- and macronutrient contents. Overall food recognition accuracy was 94% (F1 0.76), remaining high for served meals (96.5%, F1 0.85) and robust for visually complex leftovers (89.5%, F1 0.71). Unknown/non-food segments were minimal (2.4% of leftovers; 0.27% of weight). A web dashboard delivered real-time visualizations, including energy and nutrient intake. Dietitians reported reduced cognitive burden, more objective assessment, and improved observability into patient dietary intake, while emphasizing the need for further validation and integration for clinical use. These findings demonstrate that FlavoriaFlex could be integrated into hospital workflows to provide accurate, clinically meaningful intake estimates, with AI-assisted food recognition offering an efficient, reliable approach to improving nutritional monitoring at scale.
Malnutrition is a significant problem in hospital care, with a prevalence ranging from 20% to 50% depending on the definition used (Norman et al., 2008; Bonetti et al., 2017; Cereda et al., 2016). Malnutrition
Assessing Hospital Patient Nutrient Intake With an AI-Powered Food Recognition 21 impacts negatively clinical outcomes, affecting both the patient and the healthcare system. Malnutrition delays wound healing, increases infection risk, raises the likelihood of postoperative complications and delays recovery and convalescence (Norman et al., 2008; Sharif et al., 2025; Zorrilla et al., 2006). All these result in longer hospital stays and likelihood for readmission thereby increasing workload for the healthcare personnel and healthcare costs (Compher et al., 2024; Lim et al., 2012). For patients, the regrettable outcome is a weakened quality-of-life of malnourished patients compared to well-nourished patients. (Compher et al., 2024, Lim et al., 2012). In addition, hospitalized elderly people are especially prone to malnutrition (Soini et al., 2011) and malnutrition also increases the mortality of patients (Compher et al., 2024; Lim et al. ,2012). It is estimated that approximately 10 – 20% of cancer patients die due to consequences of malnutrition rather than due to the tumor itself (Muscaritoli et al., 2021). Therefore, it is crucial to detect patients who are malnourished or are at risk of malnutrition and provide efficient treatment. Here, an evaluation of dietary intake is a crucial element.
Nutritional care is not only a question of serving the patients healthy, balanced, nutrient-dense meals, but also about critical assessment and follow-up of its implementation. Unfortunately, nutritional care gaps exist in healthcare (Sj et al., 2018). Follow-up of dietary intake and documentation practices at hospitals have been found to be poor, and therefore accurate transfer of data of the patients’ dietary intake in medical records is hampered. Obstacles for high quality documentation may arise from the lack of prioritization, lack of time and resources, cultural aspects, healthcare personnel’s knowledge, and their perceptions and attitudes towards documentation and nutrition. As the current practice in observation and documentation of the patients’ food intake does not support optimal monitoring of malnourished patients’ dietary intake as a part of nutritional status assessment, more reliable and efficient methods are needed.
Research Gap and Motivation Current novel approaches for automated food and nutrient intake monitoring utilize artificial intelligence (AI) to estimate energy and nutrient intake. Most of these approaches are based on computer-vision food segmentation and classification, and nutrient mapping using AI pipelines and/or predefined nutrient databases (Albaladejo et al., 2025; Lu et al., 2019). In addition to robustly estimating nutritional content of meals and leftovers, feasibility and integration of the monitoring system into the hospital environment is crucial. Thus, a more agile system is needed that efficiently serves healthcare professionals and utilizes local recipes and nutrient information.
Although recent AI-based dietary assessment tools show high accuracy in controlled settings (Phalle & Gokhale, 2025), evidence from real-world hospital ward deployments with patient meals and leftovers remains limited (Tagi et al., 2024; Martin et al., 2021). These gaps hinder clinical adoption and the ability to deliver actionable malnutrition monitoring at scale.
In this study, we evaluated the deployment of FlavoriaFlex, an AI- and IoT-based food recognition and weighing system designed to automatically identify food items, quantify portion sizes, and estimate nutrient content (energy and macronutrients) directly from plate images and total weight (Bhetuwal et al., 2025). The system was originally validated in a real- world research restaurant setting, achieving an F1-score of 0.75 for food recognition, a weight MAE of 23.6 g (MAPE 5.2%), and a meal-level energy MAE of 235 kcal. Building on these proof-of-concept results, we deployed the identical FlavoriaFlex system in a hospital ward. This feasibility study investigated whether the system could be integrated into a real-world hospital environment and support routine hospital nutrition monitoring at scale This study was guided by the following three research questions:
RQ1: To what extent can the FlavoriaFlex system automatically detect and map visible food items in hospital lunch meals (served and leftovers) to the daily hospital menu? RQ2: How feasible is it to deploy and integrate the FlavoriaFlex system in a
hospital environment for automated estimation of food and nutrient intake? RQ3: How do dietitians perceive the benefits and limitations of the FlavoriaFlex system compared with current methods for monitoring patient meal intake?
METHODS
This study employed a mixed-methods approach, combining quantitative evaluation of food recognition and menu mapping, practical assessment of ward deployment, and qualitative feedback from dietitians regarding clinical usefulness and workflow integration.
FlavoriaFlex System Overview The FlavoriaFlex system is a compact AI- and IoT-based kiosk (Telpo C-50) integrating a top-down 2 MP camera, electronic scale, QR code scanner, and 15.6-inch touchscreen. In routine use, meal plates are placed on the scale, imaged, and weighed, with QR codes linking each measurement to the meal. A client application transmits data in real time to a backend server for automated processing, without storing patient-identifiable information.
The backend computer-vision pipeline detects and segments visible food items, assigns labels, and estimates preliminary portion sizes. Item weights are then corrected by proportionally distributing the measured total plate weight to ensure mass balance. Recognized items are mapped to the menu and recipe databases (Aromi, Fineli) to compute nutrient content (energy and macronutrients) per item and per meal. For each meal (served/leftover), FlavoriaFlex outputs the list of identified food items, corrected item-level weights, and corresponding nutrient values. When both pre-meal and post meal plates are recorded for the same QR code, the system automatically estimates consumed food and nutrients by subtracting leftovers from served amounts.
Assessing Hospital Patient Nutrient Intake With an AI-Powered Food Recognition 23 Study Design and Data Collection
We conducted a feasibility study of FlavoriaFlex deployed in a single designated inpatient ward (ward for families and newborns). The system was implemented under the ward’s normal operational practices and evaluated over six consecutive working days during lunch service. Approximately 20-30 meals were recorded daily, with special diets comprising 10% of the sample. Meal recipes, standard serving weights, and nutritional information were retrieved from the Aromi recipe database provided by the hospital food service provider (Kaarea Food Services).
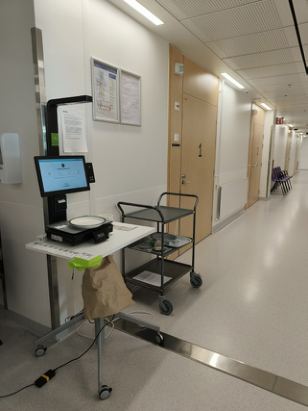
During the study, 133 served lunch meals were captured via QR-linked images prior to serving. Of these, 102 meals had corresponding leftover recordings, yielding 102 complete before–after image pairs for intake estimation. For the remaining 31 meals, leftover images were unavailable because trays were not returned to the device. Each meal image was processed to identify food items, segment the meal, estimate served and leftover weights, and derive consumption metrics (weight, energy, macronutrients) at item and meal levels using the hospital menu database. An example of the device in routine operation within the hospital ward is shown in Figure 1.
Figure 1: FlavoriaFlex device in routine use within the hospital ward.
Image Capture Protocol The meals were captured twice using the FlavoriaFlex device: once before and once after the meal to record the leftovers. As part of routine lunch distribution, patients (and occasionally staff) interacted with the device by placing the plate, scanning a QR code to link to the study database, and returning the tray for leftover images. The QR label was placed on the tray (next to the plate) for consistent identification. Each capture recorded a top- down image and total weight. After the meal, the tray was returned, the QR was rescanned to link records, and a second image and weight measurement
were captured. No identifiable information from the patient was recorded. The research team supervised the deployment to ensure compliance with the protocol and to assist staff when needed.
Ground Truth Annotations and Quantitative Metrics To evaluate food recognition and menu mapping (RQ1), all 235 meal images (served and leftovers) were annotated at the segment level using an internal dashboard displaying auto-segmented food regions with the hospital menu.
Annotators assigned menu labels (e.g., “Potato”, “Warm vegetables”, “Root vegetable patties”) to each segment, yielding 483 annotated segments. System predictions were compared to this ground truth using exact-match classification, reporting the following segment-level metrics:
Accuracy (micro-averaged): Proportion of correctly classified annotated segments.
Precision, recall, F1-score (macro-averaged): Computed across food menu classes, equally weighting each class to avoid bias toward common items.
To reflect differences in visual complexity, these metrics were calculated separately for:
Served (before-meal) images, and
Leftover (after-meal) images, which are typically more challenging due to mixing, smearing, and partial consumption.
In addition, we quantified unknown/non-food segments in paired meals (meals with both served and leftover images): a leftover segment was treated as unknown/non-food if its predicted label did not appear among the predicted labels in the corresponding served image, indicating a leftover-only detection that generally corresponded to plate/tray surface or other artefacts rather than an actual food item. We report the proportion of such segments and their contribution to total leftover weight.
Interviews Semi-structured group interviews were conducted with 6 dietitians working at Turku University Hospital in the wellbeing services county of Southwest Finland (Varha), and 2 nutrition specialists from hospital food services (Kaarea Oy). The interviews explored usability, perceived benefits over current methods, and integration needs. The discussions were recorded, transcribed, and summarized into key themes related to usability, perceived benefits, limitations and integration needs.
RESULTS
Food Recognition and Menu Mapping Performance Across 235 captured meal images, the annotation process yielded 483 ground truth segments corresponding to menu food items. Compared with
Assessing Hospital Patient Nutrient Intake With an AI-Powered Food Recognition 25 this ground truth, FlavoriaFlex achieved an overall segment-level accuracy of 94.0%, indicating a strong agreement with manual labels. Across menu-item classes, performance remained robust, with precision of 75.3%, recall of 78.1%, and an F1-score of 0.76. As expected, performance differed between served and leftover plates:
Served (before-meal) images: Accuracy was 96.5%, with an F1-score of 0.85. Items were visually distinct, and standard portioning supported reliable recognition.
Leftover (after-meal) images: Despite mixing, smearing, and irregular shapes, accuracy remained 89.5%, with an F1-score of 0.71.
A small number of predicted labels had zero support in the manual annotations (zero-support classes). Several of these arose from the meal return workflow rather than true additional foods. For example, emptied soup bowls were placed on top of the base plate before imaging, causing parts of the exposed plate surface to be segmented and assigned a plausible food label. These artefacts were included by the system because all detected segments contribute to nutrient estimation. Such unknown/non-food segments accounted for 2.4% of leftover segments and only 0.27% of total leftover weight, indicating negligible practical impact on intake estimates. Misclassifications were not dominated by any single menu item. However, visually similar foods occasionally overlapped, such as Pasta casserole with cheese vs. Pasta casserole with meat, or soups with similar appearance (e.g., Beef soup vs. Lentil soup, Pea soup vs. Vegetarian pea soup).
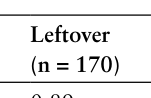
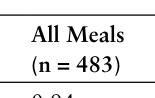
Table 1: Segment-level recognition performance across served and leftover meals.
Table available in the original PDF paper.
Equation reproduced from the original PDF.Equation reproduced from the original PDF.Equation reproduced from the original PDF.
Deployment Feasibility The FlavoriaFlex system was successfully deployed in the hospital ward over six working days, integrating smoothly into routine lunch distribution with minimal disruption. Measurement time per meal was under 10 seconds, posing little burden to nursing staff, and images were reliably linked via randomized QR codes without patient-identifiable data.
Hardware (camera, scale, touchscreen, QR scanner) functioned reliably without malfunctions or recalibration. Minor software issues (e.g., frontend errors, multiple QR scans) were addressed on-site, highlighting basic fault tolerance. Leftover images posed visual challenges (e.g., mixing, smearing, empty plates), yet the system yielded usable detections and weight estimates, demonstrating robustness to real consumption patterns.
Challenges were mainly workflow-related: occasional network instability caused minor delays in image transmission; patients/staff needed brief guidance for plate placement and scanning; and some trays were not returned to the device for leftover capture within the supervised study period. Special diets and mixed leftovers were handled without adjustments.
Automated Consumption Analytics and Dashboard Outputs Paired served and leftover images enabled automated estimation of patient and meal-level consumption, including food weight (grams), energy (kJ/ kcal), and macronutrients (protein, fat, carbohydrate). AI-predicted portion sizes were corrected using the integrated scale and mapped to standardized nutrient profiles from the hospital menu database.
To support interpretation and clinical use, we developed a web-based dashboard presenting real-time visualizations of key consumption indicators:
Daily total served versus leftover weights, identifying meals or items with consistently low consumption.
Most and least consumed items, aggregated per day and meal type, revealing patient preferences or intake challenges.
Item-level consumption distributions and meal-level nutrient summaries, including energy and macronutrient calculations.
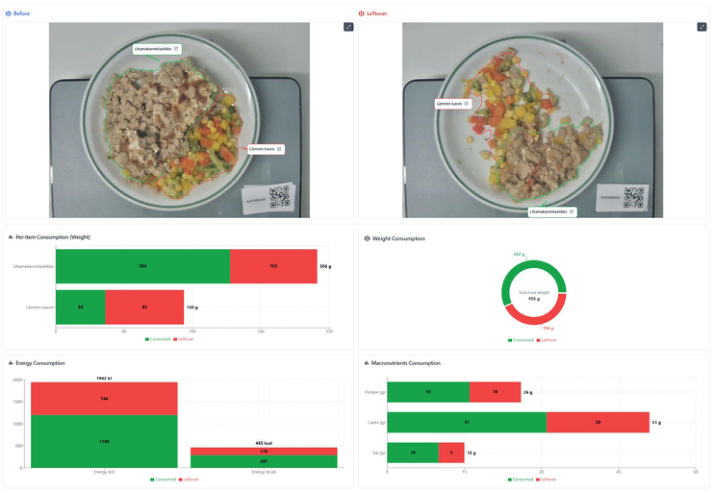
Figure 2 shows a representative dashboard snapshot, displaying before- and after meal images with segmented items, consumed versus served weights, and corresponding nutrient intake. These outputs demonstrate the practical feasibility of converting routine meal images into clinically interpretable intake summaries in real time.
Figure 2: Snapshot of the dashboard output of consumption analytics.
Assessing Hospital Patient Nutrient Intake With an AI-Powered Food Recognition 27 Interview Summary
Table 2 summarizes the main themes from interviews with dietitians and nutrition specialists. Participants reported benefits in terms of data availability, visualization, and workflow support, while noting areas for refinement to better align the system with clinical nutritional care.
Table 2: Summary of interviews with Varha dietitians and nutrition specialists of Kaarea Oy.
Table available in the original PDF paper.
Perceived Benefits of the FF System Improvements
Nutritional contents of the whole meal (tray), including bread and beverage, and summaries of nutrient intake on day/week level for an individual patient.
Output Current output provides plenty of relevant information for hospital dietitians that is unavailable at the moment. Current error margin is acceptable if it is not recurrent for the same patient. Information on leftovers is relevant for both dietary planning and ward practice.
Possibility to manually edit or add food items to a meal.
Display of fiber intake.
UI Visual overview of meal consumption, including comparison of served meal vs. leftovers. Clear view of energy and macronutrient intake.
Flex in ward practice
Threshold-based visual alerts regarding energy consumption and macronutrient intake of an individual patient.
Fast and objective assessment. Especially potential in wards where patients suffer from malnutrition or eating difficulties (e.g., cancer, neurological or gastrosurgical wards). Available nutrition information might increase attention to nutrition across wards
DISCUSSION
Interpretation of Key Findings The study demonstrated the feasibility of FlavoriaFlex in a hospital ward, addressing RQ1 by demonstrating that AI-based recognition can reliably map visible food items to the hospital menu. While performance declined somewhat from served meals to visually complex leftovers, the system maintained high accuracy, supporting its robustness for use in real-life conditions.
Leftover capture introduced occasional unknown/non-food (leftover-only) detections which were typically caused by workflow artefacts such as empty bowls placed on top of plates, which exposed plate/tray surfaces that were segmented and assigned plausible food labels. However, these detections were rare and contributed negligibly to intake estimates (2.4% of leftover segments; 0.27% of leftover weight). Most remaining errors reflected either capture protocol factors or inherent visual ambiguity between structurally
similar dishes (e.g., certain casseroles or soups), rather than systematic algorithmic failure. This suggests that future improvements will likely come from refined user protocols and targeted manual corrections rather than major changes to the system itself.
Clinically, the system provided meaningful insights into whole-meal and item-level consumption, which nutritionists found valuable for monitoring high-risk patient populations. By reducing cognitive burden and expediting assessment, FlavoriaFlex demonstrates operational feasibility and clinical utility, addressing RQ2 and RQ3 for integration into hospital workflows.
Contributions This study contributes evidence that (i) AI-based recognition can identify and map hospital meal items in served and leftover conditions, (ii) the system can be integrated into routine hospital workflows with low staff burden, and (iii) paired served–leftover analytics can provide consumption, nutrient intake, and plate-waste information that is difficult to obtain through conventional monitoring, supporting consistent data-driven nutritional care.
Limitations and Future Work Despite these contributions, several limitations should be considered when interpreting these findings:
Single-ward, short-duration deployment: The study was conducted in one hospital ward (for families and newborns) over six days. While providing initial feasibility insights, this limited scope does not capture longer-term workflow adaptation or generalizability to other wards (e.g., cancer, neurological, or gastrosurgical).
Lack of hospital-specific nutrient ground truth: No direct validation of nutrient estimates (e.g., weighed records or lab analysis) was performed in this setting. Accuracy therefore relies on prior proof-of-concept results (weight MAE 23.6 g; energy MAE 235 kcal). Hospital-specific validation is still required.
Annotation subjectivity and zero-support segments: Manual labeling may introduce subjectivity, particularly for visually ambiguous or mixed items, and occasional non-food segments in leftover images may have slightly affected macro-averaged metrics Suggested improvements include manual food correction for non- food or misclassified segments, automated handling of unknown items, and patient-level longitudinal analytics to increase accuracy, robustness, and clinical value of the system. Future work should focus on longer multi-ward deployments across additional hospital settings, integration with electronic health records, and evaluation in higher-risk patient populations to assess generalizability, workflow adaptation over time, and overall clinical impact.
CONCLUSION
This feasibility study demonstrates that the FlavoriaFlex system could be effectively integrated into hospital workflows, as it provides reliable, automated monitoring of patients’ food and nutrient intake. Nutritionists reported meaningful benefits, including reduced cognitive burden, improved objectivity, and actionable insights into consumption patterns. These findings highlight the potential of human-centered AI food-recognition systems to enhance hospital nutrition monitoring and support data-driven clinical care.
ACKNOWLEDGMENT
This research was supported by Business Finland (2022/31/2023). We gratefully acknowledge the Flavoria® multidisciplinary research platform and our colleagues at the Nutrition and Food Research Center of the University of Turku for their continued support.
REFERENCES
Albaladejo, L., Giai, J., Deronne, C., Baude, R., Bosson, J.-L. & B´etry, C. (2025), ‘Assessing real-life food consumption in hospital with an automatic image recognition device: A pilot study’, Clinical Nutrition ESPEN 68, 319–325. Bhetuwal, S., Koivunen, L., Koskimäki, S., Khalil, R., Lähde, H., Houttu, V., Laitinen,
K. & Mäkilä, T. (2025), Automated image recognition system for determining energy composition of meals by ai-powered detection and identification of food items – a study utilizing flavoria flex, in ‘2025 IEEE Global Conference on Artificial Intelligence and Internet of Things (GCAIoT)’, pp. 1–8. Bonetti, L., Terzoni, S., Lusignani, M., Negri, M., Froldi, M. & Destrebecq, A. (2017), ‘Prevalence of malnutrition among older people in medical and surgical wards in hospital and quality of nutritional care: A multicenter, cross-sectional study’, Journal of Clinical Nursing 26(23-24), 5082–5092. Cereda, E., Pedrolli, C., Klersy, C., Bonardi, C., Quarleri, L., Cappello, S., Turri, A.,
Rondanelli, M. & Caccialanza, R. (2016), ‘Nutritional status in older persons according to healthcare setting: A systematic review and meta-analysis of prevalence data using MNA ®’, Clinical Nutrition 35(6), 1282–1290. Compher, C., Jensen, G. L., Malone, A., Morgan, S., Becker, S., Cresta, L., Paul, A. M. & Steiber, A. (2024), ‘Clinical Outcomes Associated With Malnutrition Diagnosed by the Academy of Nutrition and Dietetics and American Society for Parenteral and Enteral Nutrition Indicators of Malnutrition: A Systematic Review of Content Validity and Meta-Analysis of Predictive Validity’, Journal of the Academy of Nutrition and Dietetics 124(8), 1058–1074.e4. Lim, S. L., Ong, K. C. B., Chan, Y. H., Loke, W. C., Ferguson, M. & Daniels, L.
(2012), ‘Malnutrition and its impact on cost of hospitalization, length of stay, readmission and 3-year mortality’, Clinical Nutrition 31(3), 345–350. Lu, Y., Stathopoulou, T., Vasiloglou, M. F., Christodoulidis, S., Blum, B., Walser,T., Meier, V., Stanga, Z. & Mougiakakou, S. G. (2019), An Artificial Intelligence- Based System for Nutrient Intake Assessment of Hospitalised Patients, in ‘201941st Annual International Conference of the IEEE Engineering in Medicine and Biology Society (EMBC)’, IEEE, Berlin, Germany. Martin, C., Redlinger, J., Raynor, H., Anton, S., Redman, L. & Ledikwe, J. (2021),
‘Evaluation of a novel artificial intelligence system to monitor and assess energy and macronutrient intake in hospitalised older patients’, Nutrients 13(12), 4539.
Muscaritoli, M., Arends, J., Bachmann, P., Baracos, V., Barthelemy, N., Bertz, H., Bozzetti, F., Hütterer, E., Isenring, E., Kaasa, S., Krznaric, Z., Laird, B., Larsson, M., Laviano, A., Mühlebach, S., Oldervoll, L., Ravasco, P., Solheim, T. S.,Strasser, F., De Van Der Schueren, M., Preiser, J.-C. & Bischoff, S. C. (2021), ‘ESPEN practical guideline: Clinical Nutrition in cancer’, Clinical Nutrition 40(5), 2898– 2913. Norman, K., Pichard, C., Lochs, H. & Pirlich, M. (2008), ‘Prognostic impact of
disease-related malnutrition’, Clinical Nutrition 27(1), 5–15. Phalle, A. & Gokhale, D. (2025), ‘Navigating next-gen nutrition care using artificial intelligence-assisted dietary assessment tools—a scoping review of potential applications’, Frontiers in Nutrition 12, 1518466. Sharif, A., Reilly, A., Bhagra, O., Papisetty, K., Magableh, H., Dominari, A., Nathani,
K. R., Delawan, M. & Bydon, M. (2025), ‘Impact of perioperative nutritional supplementation on outcomes of spine surgery: A systematic review and meta- analysis’, Clinical Neurology and Neurosurgery 254, 108916. Sj, H., M, B., A, B., Hh, K. & Pu, P. (2018), ‘The Routines, Knowledge and Attitudes towards Nutrition and Documentation of Nursing Staff in Primary Healthcare: A Cross-Sectional Study’, Journal of Community & Public Health Nursing 04(03). Soini, H., Suominen, M. H., Muurinen, S., Strandberg, T. E. & Pitk¨al¨a, K. H.
(2011), ‘Malnutrition according to the mini nutritional assessment in older adults in different settings’, Journal of the American Geriatrics Society 59(4), 765–766. Tagi, M., Hamada, Y., Shan, X., Ozaki, K., Kubota, M., Amano, S., Sakaue, H., Suzuki, Y., Konishi, T. & Hirose, J. (2024), ‘A food intake estimation system using an artificial intelligence–based model for estimating leftover hospital liquid food in clinical environments: Development and validation study’, JMIR Formative Research 8, e55218. Zorrilla, P., Go´mez, L. A., Salido, J. A., Silva, A. & Lo´pez-Alonso, A. (2006), ‘Low
serum zinc level as a predictive factor of delayed wound healing in total hip replacement’, Wound Repair and Regeneration 14(2), 119–122.
LISTED IN THE AHFE DIGITAL BOOKSTORE CATALOGUE
Explore the complete digital volume
Healthcare and Medical Devices
Read this individual research paper free through the original publisher, or explore the full digital proceedings book.
ISBN 978-1-964867-87-8
Explore this ISBN in the AHFE Bookstore ↗Listed in the July 2026 bookstore catalogue; search by ISBN to confirm current availability · Digital book purchase optional