Sookyung Cho, Gabrielle Kyra Sumilang, Cassidy Tu (2026). Understanding Cognitive Factors for the Choice of Physical Controls for in-Vehicle Content Accessibility. In: Accessibility, Assistive Technology and Digital Environments. AHFE Open Access, vol. 202, pp. 179–188. https://doi.org/10.54941/ahfe1007309
Automobiles become more capable of supporting our everyday lives. They are used not just for driving but also for communication and online content; playing music from the radio, from the internet, and from the phone connected, for example. However, designing accessible controls in-vehicle has been challenging due to the limitations of the in-vehicle interface. The space for physical control is limited, while the information architecture and menu structure of the user interface become complicated, as more controls and contents are provided. Finding the balanced HMI model for physical vs. screen-based virtual control is necessary to achieve satisfactory vehicle content accessibility. In this study, we used a similarity matrix to understand the underlying structure of content accessibility. Forty-eight participants were recruited and voluntarily reviewed their own vehicle in terms of content accessibility with VCAG (including NHTSA distraction guidelines), followed by sorting the physical buttons. The findings illustrate the choice model of vehicle content/control accessibility. Discussion will follow on psychophysical and preferential judgements in in-vehicle content accessibility. The updated VCAG testing methods and procedures will be provided.
Although automobiles serve as an opportunity for novel design innovation, designing accessible in-vehicle UX controls has been challenged by several socio-economic factors. As space for physical controls becomes more limited due to the industry’s affinity toward Software-Defined Vehicles (SDVs), vehicle hardware controls have increasingly migrated to touchscreen interfaces. The decoupling of hardware and software controls in SDVs opens a new direction for how users interact with vehicles. SDVs provide a platform for endless possibilities of features and vehicle controls with the primary interaction model now revolving around touchscreen interfaces. This has led to complicated information architecture of in-vehicle interfaces and an experience that can overload driver cognitive processes. By adding more in-vehicle content centralized in a touchscreen interface, accessibility issues of findability and understandability arise on top of traditional physical challenges like reachability or operability.
To provide a better in-vehicle user experience around interface content and control, the Vehicle Content Accessibility Guideline (VCAG) was introduced with three key principles of vehicle interface perceivability, operability, and understandability (Cho, 2025). The VCAG covers basic requirements and recommendations consolidated from internationally reputable organizations such as ISO IEC, W3C WAI, NHTSA FMVSS, and SAE. This consolidated guideline is a step toward regulating an evaluation protocol and establishing success criteria for in-vehicle interface controls. However, there are still many aspects to consider when further developing the VCAG. One aspect is to account for the cognitive factors in the dynamic situation of driving, especially considering shifting requirements for in-vehicle content accessibility as a driver’s specific needs and context shifts moment-to-moment alongside the driving environment. Due to the extensively growing amount of content and controls provided in SDVs, multi-level menu structures are used to categorize features, which may negatively influence driver cognitive load and in-vehicle content accessibility. Another aspect to consider is in-vehicle control access frequency and urgency, as well as the most optimal mode of control. With these complications, poor in-vehicle interface design may impede users from knowing or being able to operate the right vehicle control at the right moment.
Therefore, regarding in-vehicle HMI and driver safety, it becomes more important than ever to align in-vehicle control layouts with user mental models to bridge the gap between SDV functionality and driver expectations. SDV touchscreen interfaces may replicate the ability to calibrate precise settings and house endless content and applications like mobile device experiences, but they cannot guarantee the accessibility that drivers can find what they want to use when they need it. Hick’s Law (e.g., Proctor & Schneider, 2018) covers the phenomenon that with more choice options provided, users tend to spend more time processing these options rather than deciding.
To address this dilemma of content findability and searchability, in-vehicle interfaces have been designed to present more content at the first level of interaction. This design approach has been reflected in industry trends toward larger infotainment displays capable of accommodating extensive content and controls. Touchscreen displays have also been predominantly used for in-vehicle interfaces to increase interaction intuitiveness through direct manipulation (Shneiderman, 1983), as users are able to operate features with soft keys that present as both a visual indicator and functional button. However, this approach to in-vehicle interface design seems to result in more safety and usability concerns. Visual content may cause more driver distraction and ultimately impair driving performance. Safety concerns of migrating basic physical controls (e.g., climate controls, media) into touchscreen interfaces have been raised, particularly when the touchscreen malfunctions without physical controls to recover basic functionality (DeGuzman et al., 2024). Customer complaints and manufacturers’ recall history exemplify these concerns (DeGuzman et al., 2024). Therefore, accessible in-vehicle interface design cannot be separated from the discussion of physical buttons.
Understanding Cognitive Factors for the Choice of Physical Controls 181 Significance of Physical Buttons in Automobile
According to Plotnick (2018), buttons, or push buttons to distinguish from the clothing-related definition, have been used to help people make an order with ease – pushing the button to ring a doorbell, call a servant, summon an elevator, or detonate explosives from a safe distance. Push buttons within control systems emerged in the 1880s during the industrialization and electrification boom of the Victorian era. They offered an efficient, safe, and comfortable interface between human and machine, concealing a machine’s inner workings while delivering all the power and capability at the button pusher’s request on the other end. Throughout history, pushing a button has built the association of authoritative power with its one-way direct command to initiate a complicated sequence of actions and impact remote events.
Emergency. Electric buttons were popularized around the 1910s for communicating alerts, warnings, and danger. One-touch push buttons were particularly used to initiate calls to action and emergency alarm systems, such as fire alarms. Pushing (a button) during an emergency or panic situation meets the automobile driver’s context of facing an unexpected road condition. When a pedestrian, vehicle, or other obstacle unexpectedly gets in the driver’s way, panic may ensue; the driver needs to quickly communicate “get out of my way!” to proceed safely. The design for this type of communication – the car horn – was continuously improved for accessibility over time, becoming easier to reach and operate from the driver’s seat when needed. The car horn as a button became larger, more visible, and more easily felt for, eventually making its way right onto steering wheels as we are familiar with them today. The car horn’s history illustrates how accessibility improvements cannot rely solely on shape, but also location and overall layout to reduce driver distraction and support efficient operation in critical situations. This call for evaluating the accessibility of in-vehicle buttons is deeply related with the psychological perception of safety. Today, more types of emergency or panic buttons exist in vehicles to support drivers’ “forceful demand for presence – a push for immediate attention” (Plotnick, 2018, p.188): such as the hazards, e-brake, and SOS calling buttons.
Safety. From the early days of automotive, manufacturers promoted the value of physical buttons. Particularly, the proximity and the affordance of physical buttons contributed to reducing operational challenges and potential for driver distraction. By placing buttons within the driver’s reach, tasks can be easily executed with minimal reachability issues while driving. Operating physical buttons through tactile senses allows for drivers to focus their gaze on the road, providing an overall safer driving experience.
Efficiency. Having a singular button to execute an elaborate operational process showcases the technological development of HMI, particularly in the realm of simplicity, efficiency, and controllability. An automotive ignition button, for example, demonstrates the advancements of vehicle HMI. In the early days of automobile development, drivers were required to manually turn a hand crank to spin the engine to start the vehicle, which could potentially result in an engine slip or backfire. This process has now evolved into a one- touch operation that allows drivers to skip the physical labour of starting the engine of their vehicle.
Controllability. A button also provides a sense of control, allowing for drivers and passengers to access all parts and functions of the vehicle. In the 1880s, another interesting adaptation of the physical buttons in old cars was a communication button from the passengers to the driver: when pressed, the button would call the driver’s attention to the passenger, who could then make a request on the driver’s style (i.e., speed up or slow down). This scenario can translate into present-day assistive driving technologies, where the car increasingly takes on more manoeuvring capabilities, and the human driver can behave in some ways like a passenger. Take for example Smart Cruise Control – with a dedicated button located on the steering wheel, you can command the vehicle’s driving style by setting a constant speed or easily adjusting to go slower or faster.
These century-old mental models and metaphors established around physical buttons in automobiles now seem to be challenged by the novel interface and modality of touchscreen-based buttons. In the transition from physical to digital, these touchscreen buttons lose their affordances and thus their accessibility. Especially in cases of urgency and driver safety, the negative impact of efficiency and controllability are further exacerbated by visual overload and intangible menu structure in a touchscreen-based GUI. Where physical buttons were once used to simplify machine operation by wrapping complex structures and mechanisms, now the touchscreen GUI introduces complex menu structures in a tangle of information. This reintroduces major concerns around driver distraction, with touchscreen buttons demanding visual attention in a “must see to control” in-vehicle interface.
First, providing endless physical buttons may not resolve the issue of accessibility for in-vehicle interfaces. Second, it is unavoidable to have more controls than the number of physical buttons an in-vehicle interface can accommodate, especially as more content and vehicle controls become available through downloadable and extendable applications. Therefore, finding a balanced vehicle HMI model for physical and touchscreen-based virtual control is necessary to achieve satisfactory vehicle content accessibility. In one way, it becomes a matter of how to best select important controls among countless others within a screen, and placing those select controls in the right place as physical controls. The theory of grouping introduces how humans optimize vast amounts of information into simplified structures, such as the law of proximity, where objects that are close to each other will be perceived as a group, or Prägnanz, the law of simplicity, wherein human cognition instinctively organizes complex information into the simplest, most stable, and thus, most understandable form (Metzger, 2006; Kofka, 1935). Among these Gestalt principles, this study focuses on similarity. Through a method of Similarity Matrix and Elimination by Aspects to understand the underlying structure of in-vehicle content and controls, this study aims to shed light on how to organize physical buttons in vehicle interface.
Choice Model for Physical Buttons To understand the underlying structure of content accessibility, the cognitive choice model for physical buttons, frequency or urgency, first needs to be investigated. For example, if drivers would prefer to have their most
Understanding Cognitive Factors for the Choice of Physical Controls 183 frequently used buttons within closer reach, button sets could be determined by analyzing the drivers’ usage patterns. Descriptive statistics can be used to decide what most used buttons should be provided. Lower time-on- task performance metrics could serve as a success criterion of the design. However, if drivers value the accuracy of operation in critical moments, the safety-related functions such as the hazard button or SOS/emergency call button should be prioritized for driver proximity. In this case, the emergency call button may not be frequently, or ever, used, but drivers may be satisfied with the sense of security of easily locating it. Understanding what button prioritization strategy users have, frequency versus urgency, will serve as the basis for designing an optimal physical button layout with limited space and resources in the vehicle.
Hereby, the research questions are:
1) How do people group physical controls within an in-vehicle interface? 2) How do people prioritize physical controls within an in-vehicle interface?
The main challenge is that most probabilistic analyses of choice, simple count of the frequency, may not be an applicable approach to answering the research questions at hand. As Tversky (1972) noted, “the assumption of simple scalability which is an ordinal formulation of the principle of independence from irrelevant alternatives” is inappropriate. In other words, people use different principles for prioritization depending on the context. People may prefer to have safety-related buttons for emergency, but others may prefer to have frequently used buttons for convenience. To understand users’ contextual and hierarchical model of choice, the elimination process of a preference tree was adopted for this study. This heuristic tactic is often used to investigate how people select a specific aspect and rationalize their decision to keep or remove it.
On the other hand, to understand the underlying structure of item categorization, the Similarity Matrix was a technique used in this study. Items are counted and sorted based on how many people thought they were related to each other. Derived from a distance metric, often used to present the underlying structure of interrelationships, the shorter the distance is between two items, the more psychologically close the items are understood to be. The commonality behind this internal mental categorization can reveal an individual’s understanding of distinctions in the world (i.e., Personal Construct Theory in Kelly, 2023; Fincher & Tenenberg, 2005). When properly guided (e.g., closed card sorting with in-vehicle zones), the Similarity Matrix can reveal patterns where users perceived functional similarities and physical proximity preferences.
Finally, to properly interpret impact on performance time and error ratio, factors such as a driver’s familiarity to certain controls and preferences towards specific physical control buttons needs to be considered. This study’s procedure thus includes and documents a baseline measurement of the participant’s everyday interaction sequence in their own vehicle.
METHODS
Forty-eight participants were recruited and voluntarily reviewed their own vehicles in terms of content accessibility with VCAG, followed by grouping and sorting the physical buttons.
Participants: 48 participants (Mage = 46.68years, Female 46%) with different brand/model vehicles were recruited for a 2 hour in-vehicle HMI study. We followed a NHTSA distraction guide testing recruitment requirement to check if the participants are self-reported healthy and active drivers with valid driver’s license and drove a minimum of 7,000 miles per year. For the participant’s anthropometric distribution, the height of the participants was purposely regulated to include at least one participant in a lower z-score (e.g., less than the 5 percentile, shorter than average) and at least one participant in a higher z-score (e.g., greater than the 95 percentile, taller than average). The shortest female participant was 4’11” (3rd percentile) and the tallest male participant was 6’6” (> 99th percentile). The participants were compensated at industry standard rate for automobile user research.
Procedure: Upon the participant’s arrival, the participant reviewed the study consent form and informed about their rights during the study. Then, with their permission, two cameras were installed in their vehicle to collect data on their interactions from the shoulder view and non-verbal facial expressions. The third view from smart eyeglasses captured where the participant was looking. With this setup, the participant was asked to talk aloud about their daily routine of in-vehicle interactions with the features, from pre-driving, driving, parking, to post-driving status.
Next, the participants were seated in a seating buck with an animated driving scene. Then, they were asked to keep their eyes on the road and to use the touch screen to complete the basic tasks with an interactive in-vehicle interface prototype in Figma. To capture the needs for physical buttons later, no physical buttons were provided around the dashboard. The participants were asked to perform the basic secondary tasks slightly extended from the VCAG. The tasks cover basic driving readiness and safety features as well as convenience features like media control and air conditioning.
Media Controls (5 tasks) 1) Change media; 2) Radio on/off; 3) Change radio station; 4) Volume adjustment; 5) Mute audio Climate (6 tasks) 1) A/C auto on/off; 2) Temperature adjustment; 3) Fan speed adjustment; 4) Recirculation on/off; 5) (Front) Defrost on/off; 6) Heated/ Ventilated seats
After the main tasks, the participants were asked to conduct a grouping activity and prioritization of the selected shortcuts.
Understanding Cognitive Factors for the Choice of Physical Controls 185 A. Closed Card Sorting for Similarity Matrix: After completing the basic
tasks, the participants were asked to group the features and place them in the in-vehicle physical zones (e.g., dashboard, overhead console). The example features are presented as small cards from a given set of 55 physical buttons collected from the participants’ vehicles.
B. Choose Your Own Shortcuts: The participants were asked to choose as many physical buttons as they wanted to place on the dashboard. The example features are presented as small cards from a given set of 55 physical buttons collected from the participants’ vehicles. If they could not find their desired feature, they used a blank card and suggested one to add.
C. Elimination by Aspects: Once they placed their buttons on the board, they were asked to remove the least important button from the chosen set. At the same time, they were asked to explain why they wanted to remove it from the set of physical buttons. They repeated this process by eliminating the buttons one by one until only one remained.
Measurement: The basic performance data guided by VCAG was measured: the performance time to complete each task and the number of interactions (clicks) to complete the task successfully. To understand the mental model behind physical button requirements, detailed choice data was collected as follows.
A. Grouping. The participants’ grouping data from closed card sorting was recorded and tabulated. B. Priority. Each participant’s choice of shortcut buttons on the dashboard
was captured and recorded: 1) the total number of buttons; 2) the type of button (push vs. knob) and the size (e.g., a rectangular button from 0.5” to 2” wide; a circular knob from 1” to 3” in diameter); 3) the priority of the button in the set (from the least important button that was eliminated first to the most important one kept by the end). The reasons for elimination were coded by aspects from the participants’ verbal statements.
ANALYSIS & RESULTS Finding 01: Participants grouped the physical buttons by functional semantics.
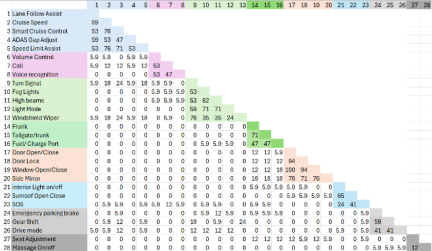
The similarity matrix from the closed card sorting was calculated as the percentage of participants who sorted any two cards together. Overall, the groups exhibited a high degree of similarity (e.g., over 50%). Clearly, the participants grouped the items by physical and semantic proximity to make the controls easier to operate and to remember—such as door and window controls in the door trim and driving assist on the steering wheel. The similarity matrix from the closed card sorting effectively uncovered the
participants’ mental model of categorization of physical buttons and mapped it onto the in-vehicle zones. See Figure 1.
Figure 1: Similarity matrix of in-vehicle physical buttons.
Finding 02: 5 shortcuts are enough for the majority of participants.
77% of participants collected fewer than 5 shortcuts (Mode = 3, min = 0, max = 11 buttons. The top 5 buttons they chose were 1) hazard light button (75%), 2) temperature control (39.6%), 3) volume control (39.6%), 4) HVAC auto (33.3%), and 5) ventilation (29.2%).
Finding 03: Safety aspect takes priority over convenience.
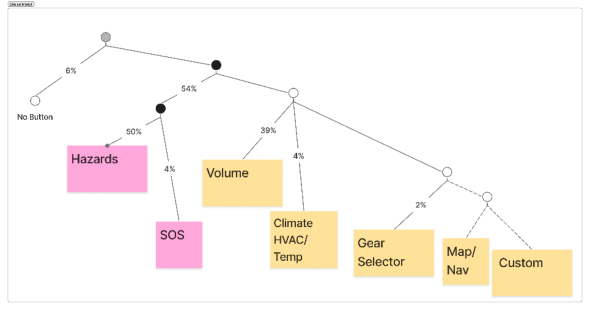
Based on the participant data of their own shortcut collection (Figure 3: Example of Shortcut Choices), the choice model of the physical but tons in-vehicle (Figure 2: Preference Tree of Physical Buttons) shows that the probability of physical button choice is inconsistent with the frequency data. When we asked participants to remove physical con trols until only one remained, Hazards and SOS turned out to be the highest priority items, while they were not listed as frequently used controls.
Figure 2: Preference tree of physical button choice.Figure 3: Example of shortcut choices.
DISCUSSION
It was reviewed the importance of physical buttons for the in-vehicle accessibility in history. The physical buttons in-vehicle needs to be carefully accessed in consideration of the user’s mental model. The card-sorting and elimination by aspect data can help researchers and designers understand how people would organize the features in-vehicle for their needs in context.
The findings are consistent that the individual’s needs of physical buttons are varied in context as well as that there is the commonality of aspects they use for their choice of physical buttons. 1) the physical buttons tend to be categorized and mapped in in-vehicle location by mental proximity - semantic and physical distance. It circles back to the Tversky’s similarity theory (Tversky, 1977) that the psychological distance influences how people perceive one as close or distanced from the other in context. The preference, therefore, is asymmetrical meaning that the task in context will highlight the needs for a certain physical button; however, in a different context, the needs for the physical button may direct to a different feature. For example, when people consider the safety as an aspect, the convenience features were weighed less and lowered on priority. On the other hand, for some people who consider driving a car is less risky or unsafe, they can equalize or put more value on the convenient features for the physical access for efficiency of resource management.
The findings imply the effectiveness of this methodological approach to content accessibility with physical buttons. This study demonstrates how HMI researchers can measure the cognitive factors of content accessibility as a decision-making process such as the elimination by aspects. The data collected in this study clearly showed the individual’s thought process on how they shifted the priority of features to be assigned in the physical button. The various contexts that influence cognitive process for the physical button choice such as what kind of physical button shortcuts s/he currently has, ‘I have a temperature button so it is okay to remove the fan speed button because it may be redundant’. Including the method of similarity matrix and elimination by aspects for VCAG testing procedure will help researchers to further analyse the needs of accessible feature via physical buttons in the framework of individual’s decision making.
The study is limited in methods for grouping and prioritising of physical buttons. However, the content accessibility needs to be extended to non- visual interface, such as sound, voice, or haptic that may enhance or distract the perception, operation and understanding of the content. Therefore, the next step of VCAG will need to investigate on the impact of multimodal interface on user distraction while driving.
CONCLUSION
As space for physical controls becomes more limited due to the industry’s affinity toward Software-Defined Vehicles (SDVs), vehicle hardware controls have increasingly migrated to touchscreen interfaces. This has led to complicated information architecture of in-vehicle interfaces and experiences that can overload driver cognitive processes. This study investigated how the Similarity Matrix and Elimination by Aspects methods effectively capture the mental models of categorization and prioritization. The findings reveal that participants grouped physical buttons by functional semantics, with safety prioritized over convenience. This study demonstrates the effectiveness of this methodological approach to content accessibility with physical buttons. With the updated VCAG testing procedure, HMI researchers can measure cognitive factors of content accessibility as a decision-making process.
ACKNOWLEDGMENT
The authors would like to acknowledge Wyatt and Ella for their contribution in data collection and moderation of the research sessions.
REFERENCES
Cho, S. (2025). Toward Vehicle Content Accessibility. Accessibility, Assistive Technology and Digital Environments, 162, p.137. DeGuzman, C.A., Donmez, B., Harbluk, J., Lau, C. and Burns, P.C. (2024). “A
technology scan of touchscreen trends in passenger vehicles”, in 16th International Conference on Automotive User Interfaces and Interactive Vehicular Applications (AutomotiveUI ’24), Stanford, CA, USA, September 22–25, 2024, pp. 149–159. Fincher, S. and Tenenberg, J. (2005). Making sense of card sorting data. Expert Systems, 22(3), pp. 89–93. Kelly, G. A. (2003). A brief introduction to personal construct theory. International
handbook of personal construct psychology, pp. 3–20. Kofka, K. (1935; 2013): Principles of Gestalt Psychology. Routledge. Metzger, W. (2006): Laws of Seeing, MIT Press Plotnick, R. (2018). Power button: A history of pleasure, panic, and the politics of pushing. MIT Press. Proctor, R. W. and Schneider, D.W. (2018). Hick’s law for choice reaction time:
A review. Quarterly Journal of Experimental Psychology, 71(6), pp. 1281–1299. Shneiderman, B. (1983). Direct manipulation: A step beyond programming languages. Computer, 16(8), pp. 57–69. Tversky, A. (1972). Elimination by aspects: A theory of choice. Psychological
review, 79(4), p. 281. Tversky, A. (1977). Features of similarity. Psychological review, 84(4), p. 327.
LISTED IN THE AHFE DIGITAL BOOKSTORE CATALOGUE
Explore the complete digital volume
Accessibility, Assistive Technology and Digital Environments
Read this individual research paper free through the original publisher, or explore the full digital proceedings book.
ISBN 978-1-964867-78-6
Explore this ISBN in the AHFE Bookstore ↗Listed in the July 2026 bookstore catalogue; search by ISBN to confirm current availability · Digital book purchase optional