Didier Valdés, Carol Perello, Alberto Figueroa, Ivette Cruzado, Angel Sanabria (2025). Drivers’ Behavior while Interacting With E-Scooters in Urban Areas: An Assessment using Driving Simulation. In: Advances in Human Factors of Transportation. AHFE Open Access, vol. 186, pp. 238–247. https://doi.org/10.54941/ahfe1006513
E-scooters have become a popular mode of transportation in urban areas worldwide, offering mobility benefits and last-mile solutions while also presenting safety challenges related to increasing interactions between e-scooters and motor vehicles. This study used driving simulation to investigate driver behavior when interacting with e-scooters in diverse operating conditions replicating a two-lane urban street. Three conflict scenarios were examined: an e-scooter rider crossing at a crosswalk, an e-scooter rider crossing unexpectedly at mid-block from behind a parked vehicle, and e-scooters riding alongside traffic with and without bike lanes. Lateral position and speed profiles from twenty-four participants were analyzed in eight scenarios. Results indicate that 42% of drivers initially increased their speed to overtake the e-scooter but were often forced to slow down due to oncoming traffic. Speed behavior significantly varies depending on the presence of a bike lane on the street, with higher speeds observed in scenarios with the bike lane. Findings suggest that drivers may not always be aware of e-scooters and do not consistently drive safely, particularly in unexpected encounters. These insights underscore the need for safer design to protect both e-scooter riders and other road users. The results indicate that adding a bike lane enhances the safety of e-scooter riders.
Electric scooters, also known as e-scooters, have been established as a micromobility solution for short trips, particularly in first and last-mile urban trips (European Commission, 2021; Kaufman & Buttenwieser, 2018). They offer potential benefits such as reduced parking demand in congested zones, improved mobility during peak hours, and convenient transportation within high-traffic environments, such as around university campuses and shopping centers. However, challenges related to equity, accessibility, and road safety remain, especially for vulnerable road users (VRUs) and e-scooter drivers. These issues pose significant considerations for urban planning and transportation policy development (Price et al., 2021).
The concept of Mobility as a Service (MaaS) promotes a multimodal integration model that unifies various modes of transport on a single platform
Drivers’ Behavior While Interacting With E-Scooters in Urban Areas 239
accessible on demand, typically through mobile applications. In this context, shared e-scooter services emerged in the U.S. in 2017 as a solution for short-distance commuting (Kaufman & Buttenwieser, 2018). By the end of 2023, 65 million trips had been taken with shared e-scooters compared to 56.5 million in 2022, showing a sustained growth trend in their adoption and use (NACTO, 2023).
The rise in e-scooter usage has been accompanied by an increase in crashes, including collisions with pedestrians, motor vehicles, and fixed objects (Sikka et al., 2019; Tian et al., 2022; Sallis & UC, 2018). Multiple factors contribute to collisions associated with e-scooters, including poor infrastructure, the lack of use of helmets, speeding, and inadequate road conditions (Tian et al., 2022; Hong et al., 2022). Due to the lack of specific records in traditional traffic crash databases, alternative data sources have been utilized for monitoring these incidents. One micromobility provider reports an injury rate of 37.2 per million miles traveled, equivalent to one injury every 26,881 miles (Bird, 2019). Between 2017 and 2019, 169 e-scooter-related crashes were documented in the U.S., with the most common occurring in traffic lanes (30.2%) and at intersections (23.1%) due to collisions with motor vehicles (Yang et al., 2020).
The safety risks associated with e-scooters have raised concerns, prompting the proposal of measures such as bans on sidewalks, dedicated parking areas, and enhancements in street design and regulations (European Commission, 2021). It has been noted that many crashes occur on first use due to the surprise of the e-scooter speed. Data from 20 U.S. cities revealed variations in e-scooter user behavior, including low helmet usage, instances of impaired riding, and a preference for sidewalks or bike lanes over roadways due to safety concerns. Geofencing emerged as the most employed strategy for managing rider behavior and enhancing safety, although shortcomings remain in crash monitoring and enforcement (Nasem, 2022).
Between 2017 and 2019, an analysis of crash patterns uncovered persistent issues such as inadequate helmet use and substance-impaired driving (Yang et al., 2020). Moreover, it was found that 54% of crashes happen at intersections because of collisions with motor vehicles, emphasizing the need for better intersection crossing designs (Shah et al., 2020). Additional research indicates that the majority of incidents stem from user error and poor pavement conditions, underlining the necessity for enhanced road safety infrastructure and education (Tian et al., 2022). Lastly, aggressive driving has been noted as a common issue among e-scooter users on university campuses (Hong et al., 2022).
Research on e-scooters and urban transport highlights both their advantages and safety, space, and regulation challenges (Gössling, 2020). Their function in addressing the “last mile” issue has been examined in various contexts, though the absence of clear regulations remains a concern in the U.S. (Kaufman & Buttenwieser, 2018). E-scooter regulations differ by city, lacking a standardized model for implementation (Riggs, 2021; Kawashima & Batstone, 2018). The high speed of e-scooters compared to pedestrians poses a significant risk, so restricting their use on sidewalks and promoting dedicated lanes is recommended (Sallis, 2018; Sikka et al., 2019; Bird, 2019).
A driving simulator was used to analyze the behavior of drivers when encountering e-scooters. Driving simulators have proven to be valuable tools for enhancing road safety. Various studies have emphasized their potential for analyzing human behavior in risky situations (Alonso et al., 2023). Additionally, their effectiveness in evaluating safety measures on urban roads has been validated, underscoring their benefits in planning (Branzi, Domenichi & La Torre, 2017). It has been noted that simulations facilitate the analysis of driver decisions and enhance road safety strategies through realistic scenarios (Fisher et al., 2011; Sykes, 2007).
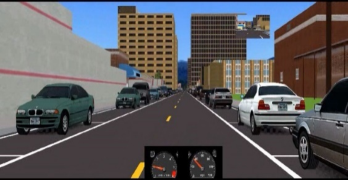
RESEARCH METHODOLOGY This study reviewed prior research on e-scooter safety, interactions with cars and pedestrians, documented incidents, U.S. regulations, and driving simulation studies. Analysis of historical crash data revealed three common conflict scenarios: an expected crossing at a designated space, an unexpected e-scooter appearance from behind a parked vehicle, and riding without dedicated lanes. The experimental design was developed based on these three situations, and a questionnaire was designed to assess drivers’ perceptions of e-scooter usage, their safety concerns, and relevant sociodemographic information. The research protocol received approval from UPRM’s Institutional Review Committee (IRB), which ensured anonymity, voluntary participation, and risk reduction. The base scenario was designed using the geometric features of an urban street in Mayagüez, Puerto Rico, which includes designated on-street parking spaces on both sides. From this base scenario, two variations of the urban street were developed: one incorporating a bike lane, as illustrated in Figure 1b, and another without a bike lane, as shown in Figure 1a.
Driving Simulation Equipment The study utilized the UPRM Driving Simulator, which consists of a computer system, a driver’s cabin, and a display screen. The driving cabin includes a pedal, steering wheel, gear lever kit, and car seat mounted on a reinforced aluminum frame. The display setup consists of three folding screens that provide drivers with a 120-degree field of view and 1080p image quality through three overhead digital projectors.
Figure 1: Simulated two-lane urban street. a) Without bike lanes. b) With bike lanes.
Drivers’ Behavior While Interacting With E-Scooters in Urban Areas 241
Development of Simulation Scenarios A virtual urban environment was created for experimental simulations using advanced design and 3D modeling tools. The base scenario features a two- lane urban road, each lane measuring 3.10 m in width, alongside a 2.44 m parking area. An alternative scenario incorporates a 1.4 m-wide bike lane. Additionally, eight specific scenarios were generated to ensure controlled and coherent conditions for evaluating participants’ interactions.
Experimental Design Twenty-four volunteers, evenly divided into two groups, participated in this study. The research aimed to establish a foundation for enhancing road safety and regulating e-scooter use in urban environments. Two street configurations were analyzed: a two-lane urban street without bicycle lanes and another featuring a dedicated bicycle lane. Additionally, three conflict scenarios were created to assess driver interactions with e-scooters: an e-scooter crossing at an intersection, an unexpected e-scooter crossing from behind a parked vehicle, and an e-scooter traveling alongside the traffic. Each participant completed four scenarios, three experimental and one scenario without an e-scooter, simulating hazardous situations derived from historical crash data in the U.S. The scenarios were presented in random order to minimize bias and improve result accuracy. This method enabled the collection of valuable insights into driver responses across various conditions, contributing to the development of more effective safety measures and infrastructure planning. The study specifically evaluated how street design influences driver behavior toward e-scooters and overall traffic interactions. A detailed breakdown of the experimental design and scenario distribution is provided in Tables 1 and 2.
Table 1: Experimental design.
Table available in the original PDF paper.
Levels
Variable Factor or Block
Numerical or Categorical
Fixed or Random
Factor Categorical Fixed Yes, No
Age Block Categorical Fixed 18-25, 26-45, 46-70 Gender Block Categorical Fixed Female, Male E-scooter crossing at an intersection Factor Categorical Fixed Yes, No Unexpected e-scooter mid-block crossing
Factor Categorical Fixed Yes, No
E-scooter riding alongside traffic
Table 2: Scenarios distribution.
Table available in the original PDF paper.
Scenario With Bike Lane
Without Bike Lane
Along Traffic
Intersection Crossing
Mid-Block Crossing
1 X 2 X X
Continued
Table 2: Continued Scenario With Bike Lane Without Bike Lane
Table available in the original PDF paper.
Along traffic
Intersection Crossing
Mid-block Crossing
3 X X 4 X X 5 X 6 X X 7 X X 8 X X
RESULTS
Lateral Position Analysis Lateral data analysis revealed consistent behavior among drivers in most scenarios, except for Scenario 6, in which they had to share the road with an e-scooter traveling in the same direction.
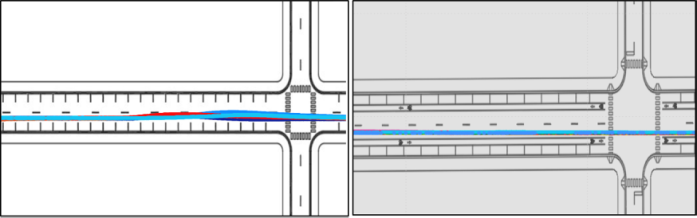
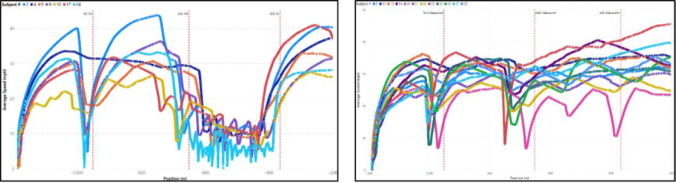
Figure 2 illustrates the lateral position data, showing that the scooter moves in the same direction as the vehicle, a Figure 2b shows the lateral position of subjects with the bike lane (scenario 2), in which the position was not disturbed by the presence of the e-scooter. Figure 2a shows the scenario without a bike lane (scenario 6), in which vehicles, due to oncoming traffic, had to pause for a safe opportunity to pass the scooter. While 42% of participants swiftly overtook the e-scooter when a gap appeared in the oncoming traffic, 58% opted to wait until the scooter finished its ride before passing it. Figure 3b shows the speed profile of subjects in scenario 2. Figure 3a shows participants’ speed profiles as they navigated scenario 6. Variations in behavior are evident, with some eagerness to overtake the e- scooter, indicated by initial speed increases. However, oncoming traffic often forces them to slow down, impacting overtaking timing. A notable trend was increasing speed after successful overtakes, with 5 out of 12 successfully overtaking it.
Figure 2: Lateral position of the subjects sharing the road with the scooter in the same direction. a) Without bike lane. b) With bike lane.
Drivers’ Behavior While Interacting With E-Scooters in Urban Areas 243
Figure 3: Speed profiles of subjects. a) Without bike lane. b) With bike lane.
Speed Analysis The research examined how e-scooters affect drivers’ behavior across eight different scenarios. The simulation included traffic flow in the opposing direction that restricted the opportunity for overtaking and passing maneuvers and increased the complexity of the potential interactions of the participant with the simulated e-scooter rider.
In scenarios 1 and 5, drivers maintained average speeds of 25.22 mph and 23.74 mph without the presence of e-scooters, respectively. The coefficient of variation (CV = 0.4) suggests similar speed dispersion in both scenarios. However, this suggests the need to implement measures to reduce speed in environments where infrastructure improvements are made.
Scenarios 2 and 3 involved interactions with e-scooters in dedicated lanes or at intersection crossings. In Scenario 2, where drivers were traveling alongside the e-scooter in the bicycle lane, drivers reduced their speed from 27 to 21 mph upon identifying the e-scooter but quickly resumed their initial speed. In Scenario 3, encountering an e-scooter at an intersection crosswalk caused a more significant slowdown to 18 mph, impacting overall traffic flow.
Scenarios 4 and 8 reflected critical conditions, with e-scooters unexpectedly on the road. In scenarios 4 and 8, the unexpected irruption of an e-scooter led to drastic reductions to 9 mph (sc. 4) and 4 mph (sc. 8).
In Scenario 7, drivers encountered an e-scooter at an intersection crossing, which led to sudden braking. They reduced their speed from 29 mph to 12 mph.
The most significant situation occurred at scenario 8, during which the speed decreased from 28 to 4 mph, exhibiting a dispersion of 15 mph. This variation indicates heterogeneous responses and an elevated risk of collision.
Speed Comparison An analysis of variance (ANOVA) test was conducted, considering speed as the response variable and the eight experimental scenarios as the treatments. The ANOVA results indicate that the scenarios have a significant impact on drivers’ speed (P-value less than 0.01), confirming statistically significant differences between them. Tukey Pairwise comparisons were employed afterward to assess speed differences in scenarios with similar characteristics, such as 2-6, 3-7, and 4-8, evaluating how differences in infrastructure affect
Drivers mobility. Only segments where drivers and e-scooters interacted were used for the pairwise comparisons. Results are shown in Table 3.
Table 3: Tukey pairwise comparison.
Table available in the original PDF paper.
Scenario Mean Speed (mph) Grouping 1 66347 25.23 A 2 69819 29.51 B 3 69994 24.17 C 4 73641 23.28 D 5 70498 23.74 F 6 93293 17.22 G 7 73270 23.24 H 8 74999 22.30 I
The comparison between scenarios 2 and 6, where the e-scooter travels alongside the driver, reveals a substantial reduction in average speed, from 29.51 mph in scenario 2 to 15.94 mph in scenario 6. This 54% decrease highlights the adverse effects of inadequate infrastructure on user mobility and safety.
In scenarios 3 and 7, where the e-scooter crosses at an intersection, the average speed drops slightly from 24.17 mph to 23.24 mph. Although the difference appears modest, it was statistically significant according to Tukey’s test. The findings suggest that implementing a dedicated bike lane could enhance driver confidence, potentially leading to an increase in drivers’ speed.
Conversely, in scenarios 4 and 8, where the e-scooter appears unexpectedly, average speeds decline to 23.28 mph and 22.30 mph, respectively. In both cases, drivers only reduce their speed upon encountering the scooter and maintain a steady speed across the scenario.
Survey Results After completing the simulation study, participants were asked to fill out a questionnaire to share their opinions on the e-scooter service. The survey addressed various aspects, including prior use of the service, frequency of use, crash history, safety perception, and suggestions to enhance user protection. Among the suggestions, the most favored (79%) was implementing exclusive lanes for e-scooters. Other recommendations included mandatory helmet use (42%), improve road conditions (33%), widening sidewalks, and adding signage and specific road markings for e-scooters (29% each). Furthermore, suggestions included using reflective vests, enhancing the visibility of e-scooters, and adding horns to alert other users.
DISCUSSION
The findings from this study highlight critical issues in the interaction between drivers and e-scooters in urban environments. Notably, the
Drivers’ Behavior While Interacting With E-Scooters in Urban Areas 245
presence or absence of dedicated infrastructure, such as bike lanes, significantly influences driver behavior. When bike lanes are provided, drivers demonstrate more consistent behavior. In contrast, in scenarios without dedicated lanes, drivers often respond with abrupt speed reductions, particularly when e-scooters appear unexpectedly. These inconsistencies can increase the risk of collisions and create unpredictable traffic dynamics.
Survey results support the behavioral data, revealing a strong preference among participants for dedicated infrastructure to accommodate e-scooters. A majority of respondents also recommended safety improvements, including helmet requirements and enhanced visibility for riders. These insights highlight a broader concern: drivers may not fully recognize e-scooters as road users, particularly in situations where infrastructure does not accommodate their micromobility.
The simulation also revealed that intersections and mid-block crossings are high-risk areas, especially when e-scooters emerge unexpectedly. These findings suggest a need to reconsider the design of urban intersections and crossing zones to better accommodate mixed transportation modes.
The behavioral patterns observed in the simulation align with real-world trends in e-scooter crashes, which often involve sudden appearances or poor visibility. The results reinforce previous literature advocating clearer regulations, driver awareness initiatives, and improvements in physical infrastructure.
CONCLUSION
This study demonstrates that the integration of e-scooters into urban traffic systems poses safety challenges largely due to inadequate infrastructure and a lack of driver awareness. Simulation data revealed that drivers tend to reduce speed significantly in the absence of dedicated lanes, especially when e-scooters appear unexpectedly, increasing the likelihood of hazardous maneuvers.
The presence of bike lanes contributes to smoother traffic flow and better coexistence between drivers and e-scooter riders, suggesting that dedicated infrastructure can effectively mitigate conflict. Given that 79% of surveyed participants supported the implementation of exclusive lanes for e-scooters, this measure appears both necessary and well-received.
Additionally, the study validates the usefulness of driving simulators in replicating real-world conditions and assessing driver responses to risk. These tools offer valuable insights that can inform policy decisions and infrastructure planning aimed at enhancing road safety for all users.
To promote safer shared mobility environments, urban planners should prioritize the inclusion of dedicated micromobility lanes, reinforce education for both drivers and e-scooter users, and implement clearer traffic regulations. These strategies, combined with continuous monitoring and simulation- based assessments, will help reduce conflicts and improve overall traffic safety.
ACKNOWLEDGMENT
This material is based upon work supported by the Safety Research Using Simulation (SAFER-SIM) University Transportation Center and partially funded by the U.S. Department of Transportation (US-DOT) Office of the Assistant Secretary for Research and Technology under Grant No. 69A3551747131. Any opinions, findings, or conclusions expressed in this paper are those of the authors and do not necessarily reflect the views of the USDOT or the PRHTA.
The authors would like to express their gratitude to the following entities and individuals: the UPRM SAFER-SIM research team; Edgardo Concepcion-Carrasco, who contributed to developing the scenario; the Civil Engineering and Surveying Department at UPRM; the Puerto Rico LTAP Center; and the volunteers who participated in the simulation experiments conducted for this project.
REFERENCES
Alonso, Francisco, Mireia Faus, José V. Riera, Marcos Fernández-Marín, and Sergio A. Useche. 2023. “Effectiveness of Driving Simulators for Drivers’ Training: A Systematic Review.” Applied Sciences. doi: https://www.mdpi.com/2076-3417/ 13/9/5266. Bird. 2019. “A look of e-scooter safety: Examining risks, reviewing responsibilities,
and prioritizing prevention.” Branzi, Valentina, Lorenzo Domenichi, and Francesca La Torre. 2017. “Drivers’ speed behavior in real and simulated urban roads- a validation study.” Elsevier 1–17. doi: https://doi.org/10.1016/j.trf.2017.06.001. European Commission. 2021. Road safety thematic report – Personal Mobility
Devices. Brussels: European Road Safety Observatory. https://road-safety. transport.ec.europa.eu/system/files/2021-07/road_safety_thematic_report_ personal_mobility_devices_tc_final.pdf Fisher, Donald, Matthew Rizo, Jeffrey Caird, and John D Lee. 2011. Handbook of Driving Simulation for Engineering, Medicine, and Psychology. Taylor & Francis Group. Gössling, Stefan. 2020. “Integrating e-scooters in urban transportation: Problems,
policies, and the prospect of system change.” Transportation Research Part D: Transport and Environment, 79. https://www.sciencedirect.com/science/article/ abs/pii/S1361920919312829?via%3Dihub Hong, Yubin, Charlie Klauer, Jean-Paul Talledo Vilela, and Melissa Miles. 2022. “An evaluation of Road User Interaction with E-Scooters.” https:// vtechworks.lib.vt.edu/handle/10919/111254 Kaufman, Sarah M., and Luke Buttenwieser. 2018. The State of Scooter Sharing in United States Cities. Rudin Center for Transportation, 1. https://wagner.nyu.edu/ impact/research/publications/state-scooter-sharing-united-states-cities NASEM. 2022. “E-Scooter Safety: Issues and Solutions.” (The National Academy
Press). doi: https://doi.org/10.17226/26756. National Association of City Transportation Officials (NACTO). 2023. Shared micromobility in the U. S. and Canada: 2023. https://nacto.org/publication/ shared-micromobility-report-2023/#: ∼: text=The%20Numbers&text=People% 20took%20133%20million%20trips, on%20shared%20micromobility%20in% 20Canada
Drivers’ Behavior While Interacting With E-Scooters in Urban Areas 247
Price, Jeff, Blackshear Danielle, Wesley, Jr. Blount, and Laura Sandt. 2021.
“Micromobility: A Travel Mode Innovation.” FHWA-HRT-21-003. https:// highways.dot.gov/public-roads/spring-2021/02. Riggs, William, Matt Kawashima, and David Batstone. 2021. “Exploring best practice for municipal e-scooter policy in the United States.” ScienceDirect. July 15. https://www.sciencedirect.com/science/article/abs/pii/ S0965856421001725?via%3Dihub. Sallis, James F. 2018. “Electric scooters on a collision course with pedestrians and lawmakers.” The Conversation. https://theconversation.com/electric-scooters-on- collision-course-with-pedestrians-and-lawmakers-99654. Shah, Nitesh R., Sameer Aryal, Yi Wen, and Christopher Cherry. 2020. “Comparison
of motor vehicle-involved e-scooter and bicycle crashes using standardized crash typology.” Journal of Safety Research, 77 217-228. doi: https://doi.org/10.1016/ j.jsr.2021.03.005. Sikka, N., C. Villa, M. Stratton, M. Ghasseimi, and A. Pourmand. 2019. “Sharing the sidewalk: A case of E-scooter related pedestrian injury.” Elsevier. doi: https:// doi.org/10.1016/j.ajem.2019.06.017. Sykes, Pete. 2007. “Transport Planning with Microsimulation.” Journal of Maps,
Vol. 3 (No. 1) 122–134. doi org/10.1080/jom.2007.9710833. Tian, Disi, Andrew D. Ryan, Curtis M. Craig, Kelsey Sievert, and Nichole L. Moris.
2022. “Characteristics and Risk Factors for Electric Scooter-Related Crashes and Injury Crashes among Scooter Riders: A Two-Phase Survey Study.” International Journal of Environmental Research and Public Health. Yang, Hong, Zhenyu Wang, Qingyu Ma, Qing Cal, Kun Xie, and Di Yang. 2020.
“Safety of Micro-Mobility: Analysis of E-Scooter Crashes by Mining News Reports.” Accident Analysis & Prevention, Vol. 143, 105608. doi: https://doi.org/ 10.1016/j.aap.2020.105608.
LISTED IN THE AHFE DIGITAL BOOKSTORE CATALOGUE
Explore the complete digital volume
Advances in Human Factors of Transportation
Read this individual research paper free through the original publisher, or explore the full digital proceedings book.
ISBN 978-1-964867-62-5
Explore this ISBN in the AHFE Bookstore ↗Listed in the July 2026 bookstore catalogue; search by ISBN to confirm current availability · Digital book purchase optional