Toshihisa Sato, Naohisa Hashimoto, Takafumi Ando, Takahiro Miura, Tran Viet (2025). Strategic objectives and data collection for regions implementing new mobility services. In: Advances in Human Factors of Transportation. AHFE Open Access, vol. 186, pp. 231–237. https://doi.org/10.54941/ahfe1006512
The aim of this study is to identify the outputs and outcomes of on-demand transport services that could lead to the implementation of these services in regions. We conducted an interview survey in the seven regions where demonstrations were carried out as part of the Smart Mobility Challenge in 2022. (The Ministry of Economy, Trade and Industry (METI) and the Ministry of Land, Infrastructure and Tourism (MLIT) had launched the Smart Mobility Challenge project since 2019.) The content of the interviews was based on the evaluation grid method. First, we asked about the benefits of the services expected to be provided by the demonstration. Then we asked, as a higher level concept, what good it would do for the region (ripple effect) and, as a lower level concept, how this could be measured (evaluation indicator). The results of the interviews were categorised into areas that have now moved from demonstration to implementation, areas that are still in the process of demonstration and areas that have now stopped demonstrating. As a result, we were able to identify the relationship between outcomes and evaluation indicators that could not move from demonstration to implementation and could not continue the demonstration.
Demonstrations of new mobility services are currently taking place in various parts of Japan (MLIT, 2025). These new mobility services include on- demand passenger services (a form of shared public transport that responds to user demand by offering flexibility in some or all of the routes, pick- up and drop-off points and times). In Japan, it is attracting attention as an alternative to existing public transport in rural areas where public transport is becoming difficult to maintain due to population decline and other factors. The difficulties in maintaining public transport can be directly attributed to a decline in ridership and a shortage of drivers due to an ageing population. In such areas, the population is ageing and if public transport were to disappear, residents would be left without a means of transport, which could make it impossible for them to shop for daily necessities or go to the hospital. It is therefore expected that new mobility services will replace public transport (Huhtala-Jenks, 2019).
On the other hand, the introduction of new mobility services is not easy in some regions, as initial investments and other costs are also essential for the introduction of new mobility services. It is important to fully consider the desired regional vision and the means to achieve it when introducing new mobility services. The desired state is the output or outcome expected from the introduction of mobility services. Mobility services need to be planned in a way that achieves the expected outputs and outcomes. However, it is not clear which outputs and outcomes are feasible. It is also not clear how such outputs and outcomes can be measured.
The aim of this study is to identify the outputs and outcomes of on- demand transport services that could lead to the implementation of these services in regions. In particular, we focused on the relationship between the desired town outcomes and the ways in which they could be measured. We conducted an interview survey in the seven regions where demonstrations were carried out as part of the Smart Mobility Challenge in 2022 (Sato and Hashimoto, 2023) (the Ministry of Economy, Trade and Industry (METI) and the Ministry of Land, Infrastructure and Tourism (MLIT) had launched the Smart Mobility Challenge project since 2019). The results were compared between areas that have now moved from demonstration to implementation, areas that are still in the process of demonstration, and areas that have now stopped demonstration.
METHODS OF INTERVIEW SURVEY
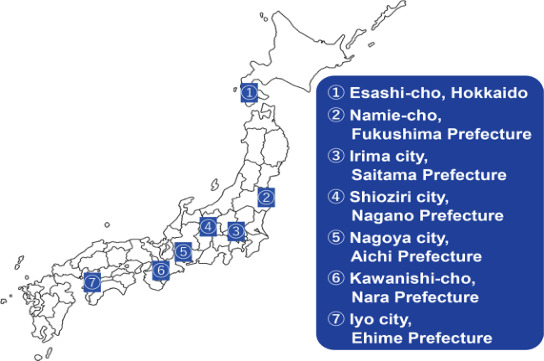
Figure 1 shows the locations of the seven neighbourhoods where the interviews were conducted. The Smart Mobility Challenge project aims to address mobility challenges and revitalise target regions through the public implementation of new mobility services. In 2022, 11 regions, including the seven neighbourhoods, were selected as government-supported demonstration areas.
Figure 1: 7 regions where the interviews were conducted.
Strategic Objectives and Data Collection for Regions Implementing New Mobility Services 233
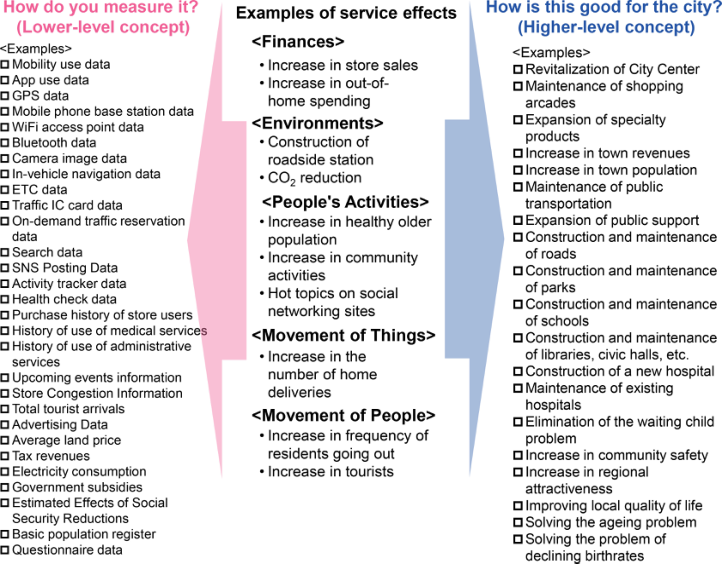
The interviews lasted approximately 1 hour per region with representatives of the municipality and/or the operator. The content of the interviews was based on the evaluation grid method (Kelly, 1955; Sauni, 1996). First, we asked about the benefits of the services expected to be provided by the demonstration (service effects). Then we asked, as a higher level concept, what good it would do for the region (ripple effect) and, as a lower level concept, how this could be measured (evaluation indicator).
Sample responses were provided for each question, as shown in Figure 2. For service effectiveness, multiple choices were made between “Finances”, “Environments”, “People’s Activities”, “Movement of Things”, and “Movement of People”. For the higher-level and lower-level concepts, the municipalities and/or operators interviewed made multiple selections based on these examples.
Figure 2: Interview contents based on evaluation grid method.
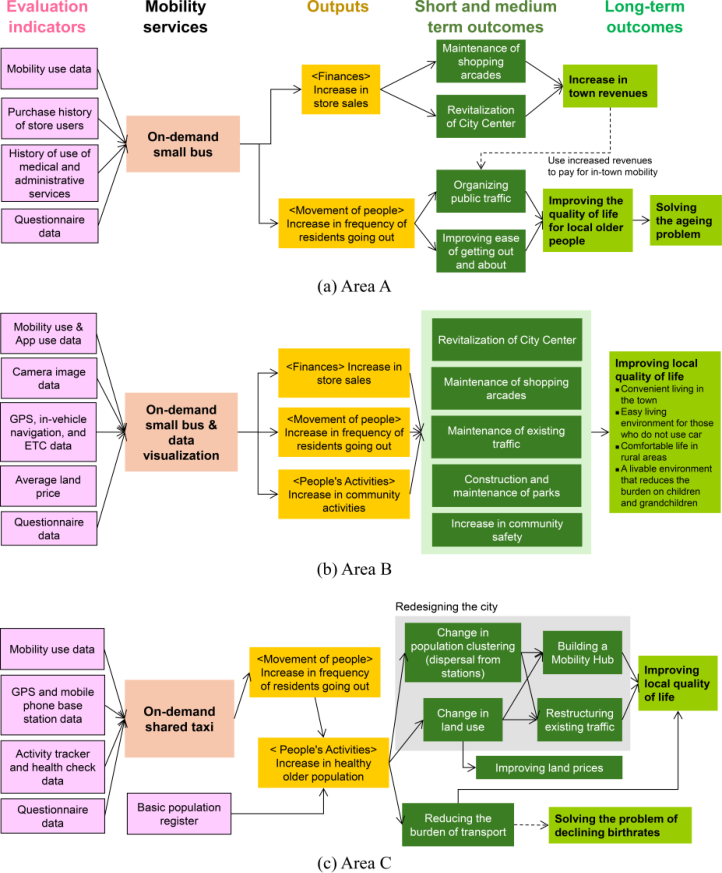
Logic models of each region were developed based on the results of the interviews (Public Health Ontario, 2025). The higher level concept corresponds to the outputs and outcomes of the logic model, and the lower level concept corresponds to the inputs.
RESULTS
Three regions have now moved from demonstration to implementation, and three regions still have demonstration experiments in progress. One region
has abandoned the idea of introducing new mobility services. Figures 3, 4 and 5 show the logic models derived from the interviews in each area.
Figure 3: Logic models in areas that have moved from demonstration to implementation.
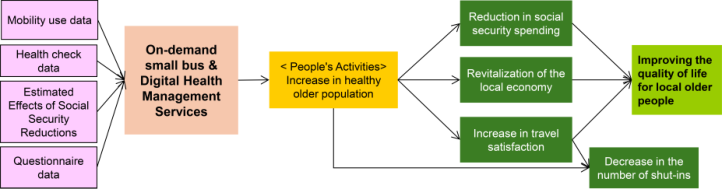
The outputs in the areas that led to implementation from the demonstration experiment were two or more of the following: finance, movement of people, and people’s activity. “Movement of people” was listed as an output in all three regions. The short and medium term outcomes in these areas included items to maintain and improve existing public transport.
Strategic Objectives and Data Collection for Regions Implementing New Mobility Services 235
The long-term outcome common to these areas was “Improving local quality of life”.
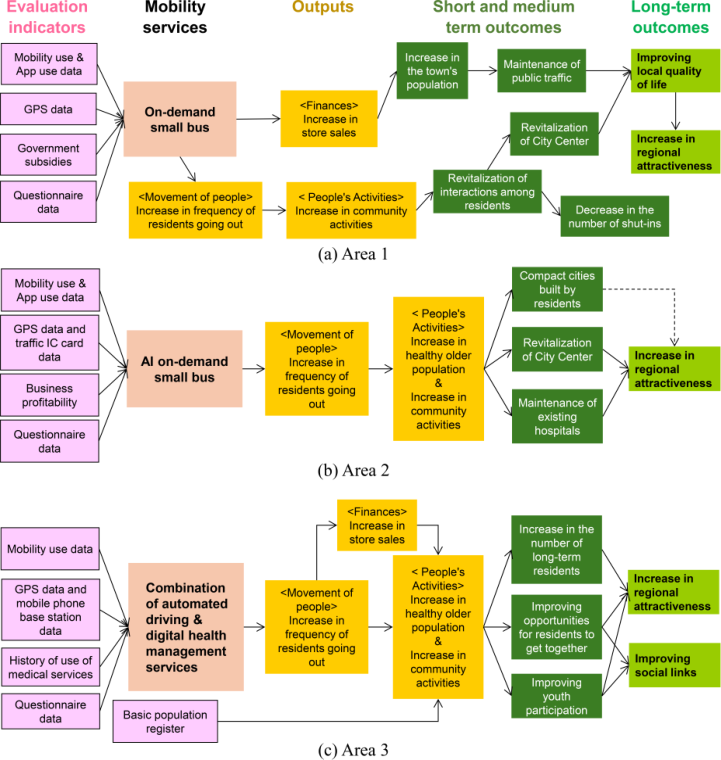
Figure 4: Logic models in areas still under demonstration.Figure 5: Logic model of the area which has now ceased to be demonstrated.
In areas where demonstrations are still taking place, the outputs were two or more of the following: people’s mobility, people’s activity and finances,
which are the same as in areas under implementation. On the other hand, short and medium term outcomes varied from region to region, including revitalised interaction among residents, revitalised shopping areas, and increased opportunities for residents to get together. The common long-term outcome was “Increase in regional attractiveness”.
The logic model in Figure 5 shows only one output: people’s activities. Short- and medium-term outputs ranged from local government finances to the local economy to the migration of residents.
“Mobility use data” and “Questionnaire data” were commonly used as evaluation indicators in all regions. In areas where new transport services have been implemented, non-mobility data items such as history of use of medical and administrative services, average land prices, activity meters and health check data were listed by area and are considered one of the indicators to measure the liveability of the area.
Travel data such as mobility use and GPS have been listed in areas where the demonstration continues. However, in order to use them as indicators of regional attractiveness (Kondo, 2024), which was identified as a long-term outcome in such areas, it might be necessary to separate data on residents from data on tourists.
DISCUSSION
In the logic models of the regions where the demonstration experiment led to implementation and the regions where the demonstration experiment is still ongoing, the common output was the movement of people (Increase in frequency of residents going out). On the other hand, in the logic model of the region where the demonstration experiment had already been discontinued, the main difference from the other regions was that there were no outputs related to mobility, despite the introduction of a mobility service. Although the reduction of social security costs and the revitalisation of the local economy were the short and medium term outcomes, it is considered essential to intervene in human mobility rather than human activity in order to achieve these outcomes.
The difference between the regions that continued the demonstration experiment and the regions that implemented the mobility service was that the long-term outcome of the regions that continued the demonstration experiment was an increase in the attractiveness of the region. The attractiveness of a region is likely to depend more on the evaluation of people outside the region than on the evaluation of the region’s residents. It is therefore difficult to infer the level of attractiveness of a region from the evaluation indices, which are mainly aimed at local residents, and it might be difficult to implement such services. In order to move from demonstration to implementation, it is important to define outputs and outcomes that can be evaluated by local residents (evaluation indicators for resident mobility and activities), and “improving local attractiveness” is not considered an appropriate outcome. When using the attractiveness of an area as an outcome, it is necessary to use indicators related to the movement of
Strategic Objectives and Data Collection for Regions Implementing New Mobility Services 237
people from outside the area (Kondo, 2024), rather than those who have lived in the area, such as an increase in the number of tourists and immigrants.
CONCLUSION
In this study, interviews were conducted using the evaluation grid method to extract the outputs and outcomes expected from the introduction of new mobility services and the indicators used to measure them. Although the number of areas interviewed was limited, the results of the interview survey implied that the reason for the failure to move from demonstration to implementation was that improving the mobility of local residents was not an output, and that outcomes were set that could not be measured by changes in the mobility and activities of local residents (e.g. attractiveness of the area).
The next step is to increase the number of regions covered by the interview survey and to validate the results.
ACKNOWLEDGMENT
The Japanese Ministry of Economy, Trade and Industry (METI) and the Ministry of Land, Infrastructure, Transport, and Tourism (MLIT) supported this work. The authors would like to thank all these officials.
REFERENCES
Huhtala-Jenks, K. (June 2019). MaaS of the Month: Whin-Insights from the world’s first Mobility as a Service (MaaS) operator, https://maas-alliance.eu/wp-content/ uploads/sites/7/2019/06/MaaS-of-the-Month-Whim-Final.pdf (accessed May 5, 2025). Kelly, G. A. (1955). The psychology of personal constructs. Vol. 1. A theory of
personality. Vol. 2. Clinical diagnosis and psychotherapy. W. W. Norton. Kondo, K. (2024). A Proposal for a Regional Attractiveness Index Based on Human Flow Data, RIETI Policy Discussion Paper Series 24-P-005, https://www.rieti.go.jp/ en/publications/summary/24040013.html (accessed May 5, 2025). MLIT (the Ministry of Land, Infrastructure and Tourism). Formation of a MaaS model, https://www-mlit-go-jp.translate.goog/sogoseisaku/japanmaas/ promotion/model/ index.html?_x_tr_sl=ja&_x_tr_tl=en&_x_tr_hl=ja. (translate Japanese pages into English) (accessed May 5, 2025). Public Health Ontario (Ontario Agency for Health Protection and Promotion (2025).
Logic models: A planning and evaluation tool. 1st revision. Toronto, ON: King’s Printer for Ontario. https://www.publichealthontario.ca/-/media/documents/F/ 2016/focus-on-logic-model.pdf (accessed May 5, 2025). Sato, T. and Hashimoto, N. (2023). User’s Activities when Using Mobility as a Service—Results of the Smart Mobility Challenge Project 2020 and 2021, IEICE Trans. Fundamentals, Vol. E106–A, No. 5, 745–751, https://doi.org/10.1587/ transfun.2022WBI0001. Sauni, J. (1996). Visualization of users’ requirements: Introduction of the Evaluation Grid Method, Proceedings of the 3rd Design & Decision Support Systems in Architecture & Urban Planning Conference, 365–374, https:// papers.cumincad.org/data/works/att/ddssar9625.content.pdf (accessed May 5, 2025).
LISTED IN THE AHFE DIGITAL BOOKSTORE CATALOGUE
Explore the complete digital volume
Advances in Human Factors of Transportation
Read this individual research paper free through the original publisher, or explore the full digital proceedings book.
ISBN 978-1-964867-62-5
Explore this ISBN in the AHFE Bookstore ↗Listed in the July 2026 bookstore catalogue; search by ISBN to confirm current availability · Digital book purchase optional