Zining Yang, Ruiqian Li (2025). Exploring Political Factors in Clean Energy Transition Using Machine Learning Technique. In: Human Factors in Software and Systems Engineering. AHFE Open Access, vol. 181, pp. 72–78. https://doi.org/10.54941/ahfe1006396
A nationwide transition to clean energy still faces persistent political challenges in the past decade. It is because the public support for clean energy policies remains deeply polarized among partisan and ideological lines. While there is an established scientific consensus of climate change, the urgence to change the status quo fails to trigger existential insecurity of individual Americans. While extensive studies have examined the role of partisanship, regional economy, and media framing in shaping these divisions, scholars know very little about the emotional foundation that drive individual voter’s clean energy preferences and behaviors. A major challenge for the scholarship is due to the lack of longitudinal data that contains measurement of both individual emotions as well as clean energy ideologies over time. This study introduces a simulation-based methodology that combining machine learning with traditional survey analysis to examine how anxiety and fear, two emotions related to existential security, shape clean energy policy ideologies and behaviors in the net of social and political factors. Our analytical strategy proceeds in three stages. First, utilizing multiple waves of cross-sectional data collected by Chapman University since 2014, we train a semi-parametric model to estimate the relationship between commonly used apolitical demographic features and anxiety and fear. We will also run the robustness check to make the model is time invariant. Second, we apply the model to two of most recent probabilistic samples collected by Pew Research Center where it contains clean energy ideology and behavior items but lacks emotional measures. And finally, we analyze how these simulated emotional predispositions interact with a range of political and social factors to predict support for clean energy initiatives. Preliminary findings suggest that political and partisan preference may suppress the effective size of existential insecurity to the support of clean energy. And we find this impact is also varied across different clean energy behaviors. The study makes several key contributions. First and methodologically, the study demonstrates how machine learning can bridge gaps between datasets with different focuses and enables more comprehensive analysis of clean energy related studies with nationally representative data. Second and theoretically, it advances our understanding of how emotions related to existential insecurity shape clean energy policy behaviors. Future research could extend this framework to examine how different aspects of policy framing might differentially affect the suppression of climate-related fears. Additionally, longitudinal applications of this approach combining with large language modeling could help track how the relationship between political framing and negative emotions evolves in response to changing environmental conditions and policy-making.
A nationwide transition to clean energy still faces persistent political challenges in the United States. While there is an established scientific consensus of climate change, the urgence to change the status quo fails to trigger existential insecurity of many Americans (Popovski, 2024). It is because the public support for clean energy policies remains deeply polarized among partisan lines (Mayer and Parks, 2024; Mayer and Smith, 2024).
Scholars find that strong partisanship amplifies polarization over climate change policies among Americans (Mayer, 2019; Mayer and Parks, 2024; Mayer and Smith, 2024). Strong Republican partisans always oppose clean energy policies, while strong Democrats support them. A 2023 Pew’s American Trends Panel Survey (ATP2023) confirm the partisan divisions (Funk, Tyson and Nolan, 2023). However, it remains unclear whether this partisan effect varies across different levels of climate change fear, as existing surveys measuring clean energy policy preferences lack data on Americans’ climate change perceptions.
Exploring Political Factors in Clean Energy Transition Using Machine Learning Technique 73
Environmental psychologists find that the fear of climate change is common and can motivate individuals to adopt pro-environmental behaviours (van der Linden, 2015; Clayton and Karazsia, 2020). The fear of climate change triggers one’s existential insecurity (Kester et al., 2020; von Gal, Fabiani and Piccardi, 2024). Scholars also find that socio-cultural and demographic indicators such as race, gender, education, income, and religiosity are consistently strong predictors for climate change fear (Hickman et al., 2021). However, existing studies rely heavily on overseas cases or non-probabilistic samples from U.S., which limits their generalizability to the broader American population. While the Chapman University Survey of American Fears (CUSAF), a nationally representative sample, has consistently measured Americans’ climate change attitudes using a six-item index since 2014 (Bader et al., 2022), the survey lacks measurements of clean energy policy preferences as well.
A SIMULATION STRATEGY To address the gap, this study introduces a simulation-based methodology that combining machine learning with traditional survey analysis to examine how fear of climate change interacts with political partisanship to shape clean energy policy preferences and behaviours. Our analytical strategy proceeds in three stages. First, with a pooled CUSAF data (N = 8,755), we train a XGBoost (Extreme Gradient Boosting) model to estimate the relationship between commonly used apolitical demographic features and fear. We choose XGBoost because research shows that XGBoost performs high level of accuracy in predicting environmental ideologies (Yang and Li, 2021; Shao and Zhang, 2024; Tripathi and Trigunait, 2024). We also conduct robustness checks to ensure model time invariance, as the training data spans multiple collection periods. Second, we apply the model to Pew Resarch Center’s American Trends Panel Survey Wave 128. With the Pew sample, we simulated fear of climate change scale using an identical group of demographic indicators. And finally, we analyse how these simulated emotional predispositions interact with the strength of political partisanship to predict support for clean energy policies.
Selection of Data and Variables For training data, we pooled 7 cross-sectional samples of CUSAF together (Wave 2014, and 2016–2019, 2021, and 2022). We choose this survey because CUSAF is the only national survey that has been conducted annually since 2014, except for 2020 (suspended due to the pandemic). Every sample is nationally representative. We only exclude the 2015 wave due to the lacking relevant items. The eventually pooled sample size is 8,755.
We construct a fear of climate change index as the outcome variable. The index is constructed using six four-point Likert scales (from 1 = Not afraid to 4 = Very afraid after reverse recoding) that has been consistently included in CUSAF since 2014. The items ask respondents “How afraid are you of” a. air pollution; b. pollution of drinking water; c. pollutions of oceans, rivers and lakes; d. extinction of planet and animal species; e. oil spills; and f. global
74 Yang and Li
warming and climate change. The fear index show strong internal consistency with Cronbach alphas range from 0.91 to 0.94. And the index is rescaled to the range from 1 to 4.
We selected eight shared demographic indicators between CUSAF and Pew’s ATP survey, standardizing their coding schemes for consistency: we coded 1. A four-category race and ethnicity (non-Hispanic white, non- Hispanic black, Hispanic, non-Hispanic other races); 2. a five-point interval of age cohort; 3. household income (standardized); 4. a four-category of US Census region (Northeast, Midwest, South, West); 5. a two-category gender (Male, non-Male); 6. a binary formal education (Less than bachelor degree, Bachelor degree or above); 7. a four-category religious traditions (Protestant, Catholic, Other religions, Religious nones); 8. a six-point interval of religious attendance. We coded a year variable to identify each survey wave’s collection period.
For data of simulation and interaction analysis, we analyse data from Pew’s American Trends Panel Wave 128 (May 2023), a nationally representative sample (N = 10,329). After removing cases with missing data, our analytical sample comprised 9,758 respondents (94.5% of original). For the interaction analysis, we used a four-category variable combining partisan and ideological strength (Liberal Democrat, Moderate/Conservative Democrat, Moderate/Liberal Republican, and Conservative Republican) as the moderator.
We select three clean energy transition policy preferences and behaviours as outcome variables for interaction analysis. The first outcome variable is a binary item asks respondents whether they think the federal government should prioritize policy either to develop clean energy or to expand fossil fuel extraction. The second outcome variable is an index of six items asking respondents if they favor or oppose policy proposals to a. plant more trees; b. tax business by carbon emissions; c. provide tax cut to encourage carbon emission reduction technologies; d. requiring power plants to eliminate all carbon emissions by 2040; e. require oil companies to seal methane gas leaks; and f. require new buildings to be run only on electricity. The Cronbach alpha of the policy index is 0.75. The third outcome variable is a four-point Likert scale asking respondents how likely do they consider to purchase an electric vehicle.
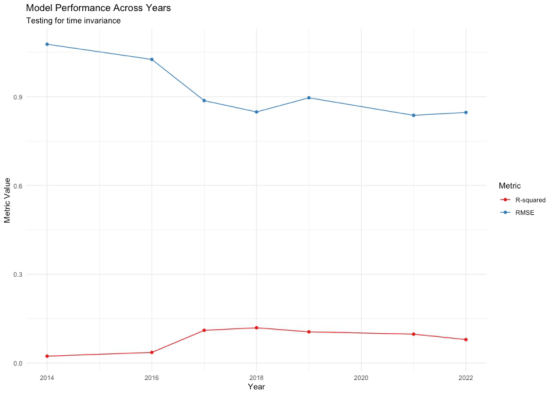
Model Training and Time Invariance Tests We first train our model within each wave of the training data and test if our model’s fit statistics vary by year. Figure 1 visualizes our model fit statistics by wave. As the figure shows, the model fit statistics get stabilized in the post-2017 waves.
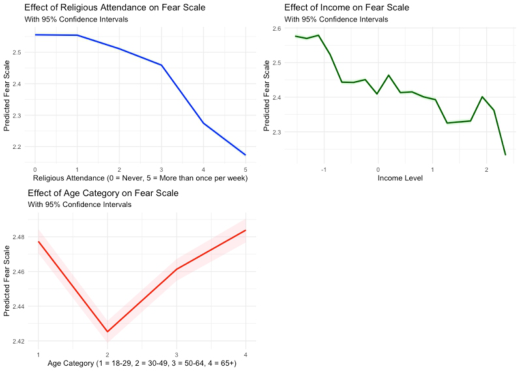
Therefore, we created a pre/post-2017 dummy variable and retrained the model with this additional temporal indicator. Our findings suggest the most powerful predicators are income, religious attendance and age with relative contribution parameters (gains) are (0.23, 0.18, and 0.10). Figure 2 illustrates the nonlinear relationships between the estimated fear index and the three key predictors (95% CIs are in shades). Religious attendance and income (in
Exploring Political Factors in Clean Energy Transition Using Machine Learning Technique 75
z-scores) negatively predict climate change fear, while age shows a curvilinear relationship, with respondents aged 30–50 reporting the lowest fear levels.
Figure 1: Time invariance test result for the XGBoost modelling across CUASF waves.Figure 2: Feature importance in predicting the fear scale.
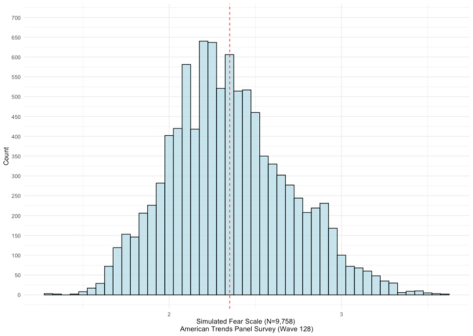
FINDINGS We apply the trained model with the APT2023 data and simulate fear of climate change scores for each respondents. Figure 3 shows the distribution of the simulated fear of climate change index, and the red dashed line refers to the mean of the distribution. As it shows, the index distribution is in a shape of good normality with a mean of 2.35, standard deviation of 0.35, and a skewness of 0.34 and kurtosis score of only −0.1.
76 Yang and Li
Figure 3: Histogram of the simulated fear scale distribution with the ATP2023 data.
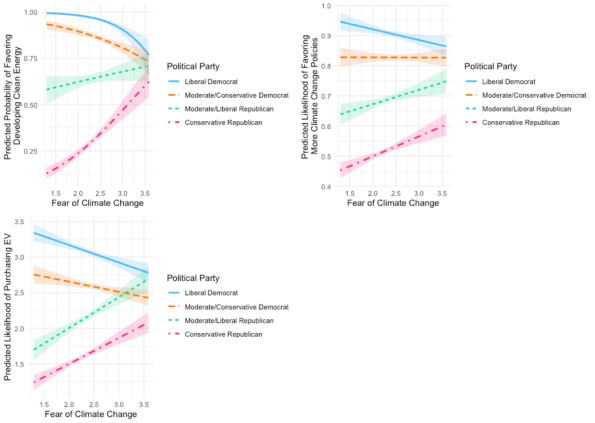
We then run regression models with the simulated fear index interacting with the strength of partisanship. As the fear index is predicted by the mentioned eight demographic indicators, we do not control these common indicators in our regression modelling. Figure 4 visualized our interaction results.
Overall, all three interactions are statistically significant and the models are of reasonably high level of model fit statistics (for the policy priority model, the pseudo-R2 is 0.29, for the policy choice model, the R2 is 0.31, and for the electric vehicle purchasing model the R2 is 0.29).
Figure 4: Interaction analysis results.
Exploring Political Factors in Clean Energy Transition Using Machine Learning Technique 77
Second, we find that the partisan division is declining with the increase of fear of climate change across all three outcome variables. More importantly and interestingly, we find that for liberal Democrats (the blue lines), the effects of fear on clean energy transitioning preferences and behaviours declines while for the conservative Republicans (pink lines), the effects increase in a significant way. For example, regarding the likelihood of buying electric vehicles, the effect almost doubled for conservative Republicans as their fear of climate change increase from 1.5 to 3.5, indicating that right- wing partisanship fail to hinder the effect of fear of climate change on clean energy transitioning preferences.
CONCLUSION
This study is one of the first in the scholarship that adopt machine learning simulation method to analyze multiple waves of several nationally representative surveys. Thus, the study advances our understanding of clean energy policy preferences in three ways. First, methodologically, we demonstrate how machine learning can bridge data gaps between surveys with different focuses, enabling more comprehensive analysis of climate attitudes using nationally representative data. Our simulation approach shows promise for future research combining datasets to study complex social phenomena. Second, we challenge conventional wisdom about partisan polarization in clean energy policy preferences. While partisanship remains a strong predictor, our findings reveal that its hindering effect weakens as climate change fear increases. Conservative Republicans show increased support for clean energy initiatives when they experience higher levels of climate fear, suggesting emotional responses may override partisan resistance Third, our results highlight the varying impact of climate fear across different clean energy behaviors and policy preferences, from general policy support to specific actions like electric vehicle purchases.
However, our study has limitations. The simulation approach, while innovative, relies on demographic predictors and cannot capture all factors influencing climate fear. Additionally, our cross-sectional data cannot establish causal relationships or track how these relationships evolve over time.
Policy-wise, our findings suggest that addressing climate change fears through evidence-based communication might be effective even among conservative populations, particularly when focused on specific policy proposals rather than broad ideological positions. Future research could examine how different policy framing approaches might affect the relationship between partisan identity and climate-related fears, particularly using longitudinal data to track changes over time.
REFERENCES
Clayton, S. and Karazsia, B. T. (2020) ‘Development and validation of a measure of climate change anxiety’, Journal of Environmental Psychology, 69, p. 101434. Available at: https://doi.org/10.1016/j.jenvp.2020.101434.
78 Yang and Li
Funk, C., Tyson, A. and Nolan, H. (2023) Majorities of Americans Prioritize Renewable Energy, Back Steps to Address Climate Change. Pew Research Center. Hickman, C. et al. (2021) ‘Climate anxiety in children and young people and their
beliefs about government responses to climate change: A global survey’, The Lancet Planetary Health, 5(12), pp. e863–e873. Available at: https://doi.org/ 10.1016/S2542-5196(21)00278-3. Kester, J. et al. (2020) ‘Between hope, hype, and hell: Electric mobility and the interplay of fear and desire in sustainability transitions’, Environmental Innovation and Societal Transitions, 35, pp. 88–102. Available at: https://doi.org/ 10.1016/j.eist.2020.02.004. Mayer, A. (2019) ‘Partisanship, politics, and the energy transition in the United
States: A critical review and conceptual framework’, Energy Research & Social Science, 53, pp. 85–88. Available at: https://doi.org/10.1016/j.erss.2019.02.022. Mayer, A. and Parks, P. (2024) ‘Media and partisanship in energy transition: Towards a new synthesis’, Energy Research & Social Science, 108, p. 103368. Available at: https://doi.org/10.1016/j.erss.2023.103368. Mayer, A. and Smith, E. K. (2024) ‘Can solar energy become polarized? Understanding the role of expressive and negative partisanship in support for solar tax credits’, Energy Research & Social Science, 113, p. 103545. Available at: https://doi.org/10.1016/j.erss.2024.103545. Popovski, V. (2024) ‘Climate change as an existential threat: Translating global goals
into action’, Environmental Policy and Law, 54(2–3), pp. 127–139. Shao, C. and Zhang, H. (2024) ‘Climate change characteristics and population health impact factors using deep neural network and hyperautomation mechanism’, The Journal of Supercomputing, 80(7), pp. 8637–8667. Available at: https://doi.org/ 10.1007/s11227-023-05795-y. Tripathi, S. and Trigunait, R. (2024) ‘Achieving sustainable practices: environmental
sustainability and semi-supervised learning for carbon footprint reduction’, Environment, Development and Sustainability [Preprint]. Available at: https:// doi.org/10.1007/s10668-024-05578-2. van der Linden, S. (2015) ‘The social-psychological determinants of climate change risk perceptions: Towards a comprehensive model’, Journal of Environmental Psychology, 41, pp. 112–124. Available at: https://doi.org/ 10.1016/j.jenvp.2014.11.012. von Gal, A., Fabiani, G. and Piccardi, L. (2024) ‘Climate change anxiety, fear,
and intention to act’, Frontiers in Psychology, 15. Available at: https://doi.org/ 10.3389/fpsyg.2024.1341921. Yang, Z. and Li, R. (2021) ‘Feature Selection Modeling on Predicting EV Charging Station Coverage Rate in Southern California’, in. Advances in Simulation and Digital Human Modeling: Proceedings of the AHFE 2020 Virtual Conferences on Human Factors and Simulation, and Digital Human Modeling and Applied Optimization, July 16-20, 2020, USA, Springer, pp. 94–99.
LISTED IN THE AHFE DIGITAL BOOKSTORE CATALOGUE
Explore the complete digital volume
Human Factors in Software and Systems Engineering
Read this individual research paper free through the original publisher, or explore the full digital proceedings book.
ISBN 978-1-964867-57-1
Explore this ISBN in the AHFE Bookstore ↗Listed in the July 2026 bookstore catalogue; search by ISBN to confirm current availability · Digital book purchase optional