Tero Reunanen, Vesa Taatila (2025). Clusters and factors influencing student satisfaction among graduates of Turku university of applied sciences. In: Human Factors, Business Management and Society. AHFE Open Access, vol. 176, pp. 218–227. https://doi.org/10.54941/ahfe1006319
Student satisfaction in studies is one of the most critical areas of information for universities, often highlighted through student questionnaires. Understanding why some students are more satisfied with their studies than others is essential for improving organizational performance. These aspects have been under scrutiny at Turku University of Applied Sciences (TUAS) in earlier studies. TUAS has previously investigated the attributes influencing student satisfaction and the correlation between staff satisfaction and student satisfaction. While some factors explaining variations in satisfaction are straightforward, others are more complex and potentially critical for the institution’s future. Our prior research demonstrated that student satisfaction correlates with staff perceptions of justice. Additionally, we identified several variables influencing student satisfaction. Student satisfaction is particularly intriguing because it is often associated with positive outcomes, such as higher graduation rates. Given that universities of applied sciences aim to produce new professionals for society, understanding the variables impacting student graduation remains a priority. In previous research, we studied the correlation between student satisfaction and on-time graduation. Interestingly, no significant correlation was found. This finding motivated further exploration into student satisfaction, focusing on identifying clusters and factors in the data. This study utilized data from the AVOP feedback questionnaire, which collects evaluations and feedback from graduating students about their education. The AVOP findings are used locally by institutions to enhance processes and nationally for performance-based monitoring and funding decisions. All graduating degree students from Finnish universities of applied sciences are invited to complete the questionnaire. The dataset comprised responses from 1 814 TUAS graduates who completed the AVOP questionnaire in 2023. The data analysis was conducted using Excel and Python. Samples were extracted from the dataset and incorporated into a statistical model using Excel spreadsheets. This study aimed to answer the following research questions: Is there a correlation between student satisfaction and specific factors at the time of graduation? Can students be grouped into clusters based on the data? How can these correlations and clusters be interpreted, and what conclusions can be drawn? The findings provide valuable insights for understanding the dynamics of student satisfaction. Future research directions and practical recommendations will also be presented in the paper.
Student satisfaction is a critical area of research for higher education institutions, influencing organizational development, student retention, and institutional reputation. Universities routinely measure student satisfaction through surveys and feedback mechanisms to enhance educational programs and improve student experiences. Despite its relevance, the exact role of student satisfaction in shaping academic outcomes remains a complex subject, requiring deeper investigation. Prior studies at Turku University of Applied Sciences (TUAS) have examined various aspects of student satisfaction, its influencing factors, and its potential correlation with key academic and institutional metrics (Reunanen & Taatila, 2021; 2022, Reunanen et al., 2024).
Clusters and Factors Influencing Student Satisfaction Among Graduates 219
Previous research has identified multiple dimensions influencing student satisfaction, including disciplinary, demographic, and situational variables (Reunanen & Taatila, 2022). Among these, the perception of fair treatment by university personnel has emerged as a significant factor. Findings suggest that student satisfaction is strongly linked to perceived justice within the university environment, reflecting the broader organizational climate (Reunanen & Taatila, 2021).
One central research question in prior investigations has been whether student satisfaction correlates with graduation rates. However, empirical evidence from TUAS suggests that no clear or consistent correlation exists between these two variables (Reunanen et al., 2024). This finding challenges the common assumption that higher satisfaction leads to better academic progression and on-time graduation. Instead, graduation rates appear to be influenced by external factors, including field of study and career- related motivations. Students in disciplines where a diploma is essential for professional entry, such as healthcare or engineering, demonstrated higher on-time graduation rates, independent of their reported satisfaction levels (Reunanen et al., 2024). These results suggest that structural and career- related incentives may play a more substantial role in determining academic completion than overall satisfaction.
Building on these insights, the present study aims to further explore the underlying structure of student satisfaction by identifying clusters and key influencing factors at the time of graduation. Using data from the 2023 AVOP questionnaire, which gathers feedback from all graduates of Finnish universities of applied sciences, this research seeks to determine whether satisfaction follows distinct patterns among different student groups. The dataset, comprising 1,814 responses, allows for a data-driven analysis using Excel and Python to identify potential relationships and segmentations in the satisfaction data.
The research is guided by three core questions: 1) Is there a correlation between student satisfaction and specific factors at the time of graduation? 2) Can graduates be grouped into clusters based on satisfaction-related variables? 3) How can these findings be interpreted to enhance institutional practices and future research?
By expanding the understanding of student satisfaction clusters, this study aims to contribute to the ongoing discourse on higher education performance metrics and student experience improvements. The results will provide practical recommendations for university administrators and policymakers while addressing gaps in existing literature.
RESEARCH Initial Sample
In this research, we utilized the AVOP feedback questionnaire as the primary instrument for gathering data on student satisfaction. The AVOP (Ammattikorkeakoulujen Valmistumisvaiheen Opiskelijapalaute) is a national survey administered to students graduating from Finnish Universities of Applied Sciences (UAS). Developed collaboratively by UAS
220 Reunanen and Taatila
institutions and the Ministry of Education and Culture, the AVOP questionnaire serves as a standardized tool for evaluating and providing feedback on various aspects of higher education (avop.fi 2025).
The research sample consisted of all TUAS bachelor’s degree graduates who responded to the AVOP questionnaire in 2023. The total number of respondents was 1,814; however, 99 individuals did not approve the use of their responses for further research purposes, resulting in a final sample size of 1,715. The questionnaire comprised 104 items, including both closed- ended questions and an open feedback section. Most questions utilized a Likert scale ranging from 1 to 7, where 1 represented the lowest rating and 7 the highest. Certain exceptions were present in the questionnaire structure. For instance, the question “To what extent do you believe student feedback was taken into account in the development of studies?” used a 5-point Likert scale, with 1 indicating “A lot” and 5 indicating “Not at all.” Similarly, “How regularly were you given the opportunity to provide feedback on courses?” also employed a 5-point Likert scale, but responses were divided into percentage-based cohorts: 1 corresponded to “81–100%,” and 5 corresponded to “0–20%.” Another deviation in the scale was seen in “Has it been possible to complete international courses at your university, for example, through online or project studies?” where response options were categorical: (1) Yes and enough, (2) Yes, but not enough, and (3) No, according to my knowledge. Additionally, for the question “Have you obtained a job corresponding to your education?, responses were binary: (1) Yes, (2) No. Overall student satisfaction was measured using the question “How likely are you to recommend Turku University of Applied Sciences to a friend?, which was answered using a Likert scale ranging from 0 (least likely) to 10 (most likely).
In addition to the research-specific questions, the AVOP questionnaire included several demographic variables: response timestamp, degree program, campus location, study mode, study language, age cohort, gender, and background education. Respondents also indicated whether their data could be used for further research and, if so, whether their responses could be linked to their study records. For this study, the utilized demographic variables were degree program, age cohort, gender, and background education. The graduates were categorized into 30 distinct degree programs. Age cohorts were grouped into four categories: (1) Under 25, (2) 25–34, (3) 35–45, and (4) Over 45 years old. Gender was categorized into three groups: (1) Male, (2) Female, and (3) Other. Background education was divided into eight categories: (1) Upper secondary school, (2) Vocational school, (3) Science university degree, (4) Upper secondary school and vocational school (dual degree), (5) UAS degree, (6) Foreign degree, (7) No degree after primary school, and (8) Other.
Analysis The analysis began by examining whether a correlation exists between the combined responses of different degree programs. Arithmetic means were
Clusters and Factors Influencing Student Satisfaction Among Graduates 221
calculated for each degree program, followed by a correlation analysis. The results indicated that all degree programs correlated positively with each other at a significance level of p < 0.01.
Next, a correlation analysis was conducted between individual questionnaire items. The results showed that all questions correlated positively with each other at p < 0.01, except for two questions: “To what extent do you believe student feedback was taken into account in the development of studies?” and “How regularly were you given the opportunity to provide feedback on courses?” These two questions exhibited a negative correlation with all other questions while correlating positively with each other at p < 0.01. The explanation for this pattern is straightforward, both items had reverse scaling compared to the rest of the questionnaire.
Although factor analysis is typically uninformative in such cases, it was performed to confirm the results. As expected, the analysis did not identify distinct, interpretable factors beyond one general factor encompassing all questions, along with a few random associations. Therefore, the findings suggest that treating the research statements as independent variables, rather than grouping them into latent factors, may be a more suitable approach for further analysis. However, as factor structure analysis was not the primary objective of this study, a more detailed investigation is left for future research.
Following the analysis of questionnaire items, the focus shifted to examining correlations among respondents. First, a correlation analysis was performed across degree programs by calculating average responses for each program. The results showed that all degree programs correlated significantly with each other at p < 0.01. Subsequently, an analysis was conducted to explore the relationship between demographic attributes and the question “How likely are you to recommend Turku University of Applied Sciences to a friend?”, which serves as a representative indicator of graduate satisfaction.
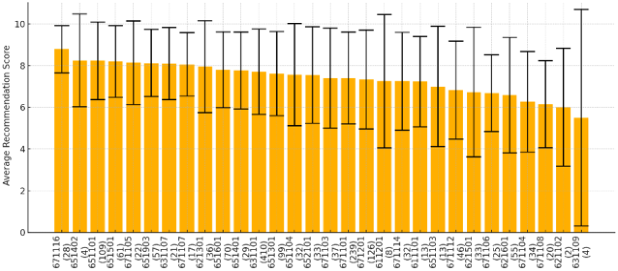
Figure 1 illustrates the average responses to this question across different degree programs. The results indicate notable variation among programs, with the highest average score at 8.79 and the lowest at 5.50, while the overall average across degree programs was 7.38. Standard deviation also varied considerably, with the lowest recorded at 1.13 and the highest at 5.2. It is important to note that the extreme low score and high standard deviation were observed in a degree program with only four respondents, highlighting the impact of small sample sizes. As this research does not specifically focus on determining which disciplines exhibit higher satisfaction levels, we limit our conclusions to stating that there are statistically significant differences between degree programs.
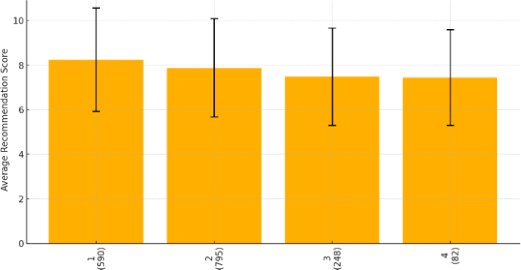
The analysis of different age cohorts indicates variations in satisfaction levels across age groups. As illustrated in Figure 2, satisfaction appears to decrease as graduates’ age increases. However, the differences are less pronounced than those observed between degree programs. The highest recorded satisfaction score was 8.24, while the lowest was 7.45. Standard deviation values ranged between 2.32 and 2.15, suggesting that variability in satisfaction is relatively consistent across all age groups. These findings
222 Reunanen and Taatila
indicate that younger graduates tend to report more positive experiences compared to older graduates.
Figure 1: University recommendation likelihood by degree programme. Number of respondents is in parentheses under degree programme code.Figure 2: University recommendation likelihood by age group.
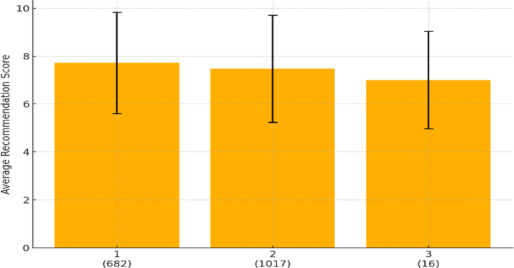
The analysis of satisfaction across gender groups revealed statistically significant differences. Male graduates reported the highest satisfaction levels, with an average score of 7.71, whereas respondents in the “other” category reported the lowest satisfaction at 7.00. Standard deviations across gender groups were relatively consistent, ranging between 2.11 and 2.03 (Figure 3).
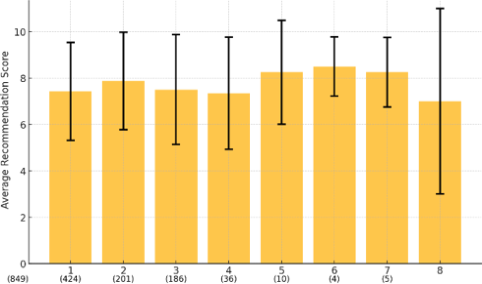
Figure 4 presents satisfaction levels among graduates based on their educational background before enrolling at TUAS. The highest satisfaction level (8.50) was recorded among graduates who had previously completed a foreign degree, while the lowest (7.00) was observed among those who reported an unspecified prior education. Notably, the sample sizes for these two groups were small, with only four and five respondents, respectively. A particularly interesting finding is that graduates with upper secondary education, a university degree, or a dual degree background reported similar satisfaction levels. In contrast, graduates with a vocational school background exhibited the highest satisfaction levels among larger respondent groups.
Clusters and Factors Influencing Student Satisfaction Among Graduates 223
Figure 3: University recommendation likelihood by gender.Figure 4: University recommendation likelihood by education before TUAS.
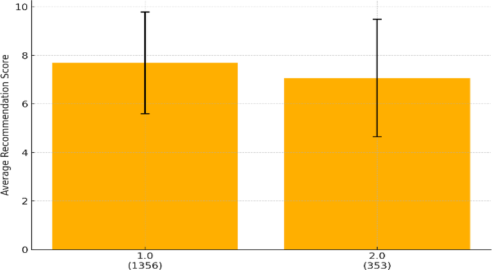
The analysis also examined the relationship between employment alignment and satisfaction. As shown in Figure 5, a statistically significant difference in satisfaction exists depending on whether graduates secured employment that matched their field of study. Graduates who reported having a job aligned with their education had an average satisfaction score of 7.70, whereas those whose employment did not match their studies reported a lower score of 7.07. Additionally, the standard deviation was higher (2.42) among respondents without a matching job compared to 2.10 for those in aligned positions.
Figure 5: University recommendation likelihood by whether graduate got workplace matching to education in the time of graduation.
224 Reunanen and Taatila
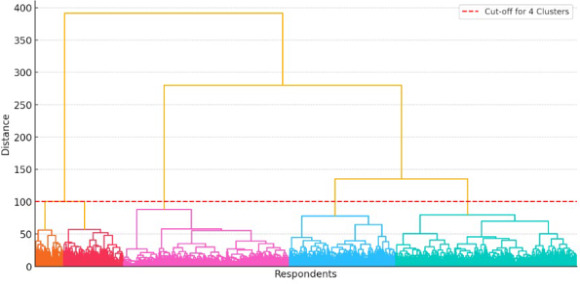
A hierarchical clustering analysis was conducted to explore whether respondents could be grouped based on their survey responses. The dataset was normalized, and a dendrogram (Figure 6) was generated. Initially, the analysis was performed using five clusters, but some clusters appeared closely packed together, suggesting over-segmentation. Additionally, several clusters exhibited similar response profiles, making them harder to distinguish. To improve interpretability, an alternative three-cluster analysis was conducted. While this approach produced smoother transitions between groups, it lacked clear differentiation in satisfaction trends. A four-cluster model was then tested, which revealed distinct patterns, particularly among respondents with strong opinions about practical training, job relevance, and international opportunities. Based on this, the four-cluster model was selected for further analysis.
Figure 6: Hierarchical clustering dendrogram with 4 clusters.
Table 1 presents the top 10 questions associated with PCA1 and PCA2. The questions in PCA1 primarily pertain to teaching quality, study motivation, coherence, and competence development, indicating that PCA1 represents “Quality of Educational Experience.” A high PCA1 score suggests that students found their studies structured, engaging, and effective in skill development. Conversely, PCA2 focuses on career preparedness, working-life integration, and job market support, indicating that PCA2 represents “Career Preparedness and Work-Life Integration.” A high PCA2 score suggests that students felt well-prepared for employment, whereas a low PCA2 score may reflect gaps in career services and industry connections.
Table 1: Top 10 questions for clustering PCA.
Table available in the original PDF paper.
Top PCA1 Questions Top PCA2 Questions Overall assessment of studies Enough opportunities to participate in studies cooperating with the working life. Teaching and guidance Satisfied with the working life relationships built
during the studies.
Continued
Clusters and Factors Influencing Student Satisfaction Among Graduates 225
Table 1: Continued Top PCA1 Questions Top PCA2 Questions
Table available in the original PDF paper.
Studies were motivating and
Received sufficient guidance and advice for job
inspiring
seeking (job application, CV, job interviews). Studies formed a coherent
Received sufficient support for career planning
entity
during studies. Teaching methods and
Subjects were addressed clearly and understandably.
working practices were versatile and suited various learning situations Development of competence Study courses matched the contents described in the curriculum. Subjects were addressed
College staff supported sufficiently in building working life relationships.
consistently and systematically Learning materials were
Received sufficient guidance, advice, and information to become an entrepreneur.
comprehensive, clear, and concise Proximity to working life in
Enough theory and information in studies.
Studies
Subjects were addressed consistently and
Received sufficient feedback systematically.
on the development of competence
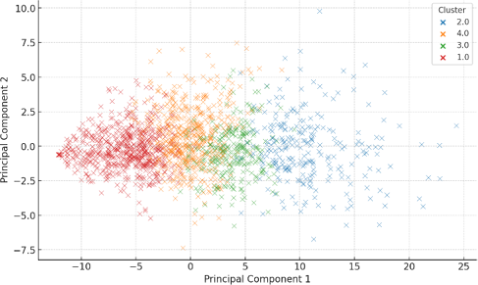
Figure 7 illustrates the scatter plot of respondent clusters based on PCA components. Comparisons with three- and five-cluster models confirmed that four clusters provided the most descriptive sample segmentation. The clusters were categorized as follows: Cluster 1: Respondents with negative PCA1 scores (low satisfaction with academic quality). Cluster 2: Respondents with strongly positive PCA1 scores (high satisfaction with educational experience). Cluster 3: Respondents with moderately positive PCA1 scores. Cluster 4: Respondents with neutral PCA1 scores. PCA2 values were more evenly distributed, though respondents in Cluster 1 demonstrated a notable trend: as PCA1 values decreased, PCA2 values tended toward zero.
Figure 7: Cluster scatter xy plot.
226 Reunanen and Taatila
Lastly, an analysis was conducted to determine whether demographic variables (degree program, age, gender, prior education, or job alignment) correlated with cluster membership. The results indicated that none of these demographic factors were significantly associated with cluster assignment. Thus, student satisfaction clusters were determined by response patterns rather than demographic backgrounds, suggesting that perceptions of education are independent of basic metadata characteristics.
RESULTS AND CONCLUSION The findings of this research reinforce previous research that student satisfaction varies significantly across degree programs. This variation highlights the impact of disciplinary differences in structuring education, instructional quality, and career expectations. Satisfaction levels were also found to be influenced by age, with younger graduates reporting higher satisfaction than older ones. Gender differences were observed as well, with male graduates generally more satisfied than female graduates, aligning with previous research findings. An interesting outcome emerged from analyzing respondents’ educational backgrounds. Graduates with a vocational school background reported the highest satisfaction among larger groups, while those with an upper secondary or prior university degree showed nearly equal levels of satisfaction. This suggests that students’ expectations and experiences differ depending on their educational pathways before university. Employment alignment also played a crucial role. Graduates who had secured jobs matching their education at the time of graduation reported significantly higher satisfaction than those whose employment did not align with their studies. While this could be attributed to general life satisfaction, the data did not allow for deeper analysis into whether job-seeking challenges or employment quality influenced satisfaction levels.
Clustering analysis revealed four distinct groups based on two primary factors: Quality of Educational Experience (PCA1) and Career Preparedness and Work-Life Integration (PCA2). While satisfaction with studies varied significantly, it did not directly determine how prepared students felt for work-life. This suggests that learning in higher education is highly individualized. Some dissatisfied students may still develop strong career competencies through independent learning, while highly satisfied students may feel unprepared for their careers.
These findings have several implications. First, institutions should consider discipline-specific approaches to improving satisfaction, as one-size-fits- all strategies may be ineffective. Additionally, universities should support older students and female students more effectively to enhance their educational experiences. Finally, career services and employer connections should be strengthened to bridge the gap between education and work-life preparedness.
Future research should explore causal relationships between satisfaction and employment outcomes, as well as investigate how students with different satisfaction levels engage with self-directed learning and external career opportunities. Further qualitative research could also provide deeper
Clusters and Factors Influencing Student Satisfaction Among Graduates 227
insights into students’ subjective experiences and expectations regarding their education and career preparedness. This study underscores the complexity of student satisfaction, emphasizing the need for a nuanced approach to institutional development and student support.
ACKNOWLEDGMENT
The authors wish to express their gratitude for the opportunity to conduct this research in the spirit of open science. We affirm that our work was guided solely by our commitment to contribute to the academic community, free from external demands or influences. Furthermore, we acknowledge that this research was undertaken without the benefit of external funding, underscoring our dedication to the pursuit of knowledge. We hope that our findings will serve to further enrich the discourse in our field.
REFERENCES
AVOP, Feedback questionnaire for University of Applied Sciences graduands https:// avop.fi/en. Reunanen, T., Taatila, V., Joshi, M. (2024). Correlation between students’
satisfaction with studies and graduation. In: Vesa Salminen (eds) Human Factors, Business Management and Society. AHFE (2024) International Conference. AHFE Open Access, vol. 135. AHFE International, USA. http://doi.org/10.54941/ ahfe1004956 Reunanen, T. J. & Taatila, V. P., (2021). Felt Justice. Correlations Between University Students and University Personnel. In: J. I. Kantola et al. (Ed.), AHFE 2021, LNNS 267, pp. 158–166. Reunanen, T., Taatila, V. (2022). Shared Work Load and Team Spirit - Correlations
between University Students and University Personnel. In: Vesa Salminen (eds) Human Factors, Business Management and Society. AHFE (2022) International Conference. AHFE Open Access, vol. 56. AHFE International, USA. http://doi.org/ 10.54941/ahfe1002293 Reunanen, T., Taatila, V. (2022). Student Satisfaction Towards Studies - Disciplinary, Demographic or Situation Related Variable?. In: Vesa Salminen (eds) Human Factors, Business Management and Society. AHFE (2022) International Conference. AHFE Open Access, vol. 56. AHFE International, USA. http://doi.org/ 10.54941/ahfe1002290
LISTED IN THE AHFE DIGITAL BOOKSTORE CATALOGUE
Explore the complete digital volume
Human Factors, Business Management and Society
Read this individual research paper free through the original publisher, or explore the full digital proceedings book.
ISBN 978-1-964867-52-6
Explore this ISBN in the AHFE Bookstore ↗Listed in the July 2026 bookstore catalogue; search by ISBN to confirm current availability · Digital book purchase optional