This study proposes Eco Track, a dual-end digital platform designed for sustainable product lifecycle management. The system integrates environmental data provided by enterprises with behavioral data recorded by users, enabling a visualized and interactive management experience across four key product lifecycle stages: production, transportation, usage, and recycling. Employing User-Centered Design (UCD), emotional design, and gamification strategies, the research evaluates the platform’s interaction effectiveness and user acceptance through prototype development and usability testing. Results indicate that data visualization, emotional feedback, and incentive mechanisms significantly enhance users’ awareness of and engagement in sustainable behaviors. This paper establishes a replicable interaction design framework, offering practical design paradigms and methodological references for the development of future green digital platforms.
Research Background Amid the escalating global environmental crisis, sustainable development has increasingly become a core focus of national policies and corporate strategies. Throughout their entire life cycle—from raw material extraction, manufacturing, packaging, and transportation, to usage and end-of-life recycling—products can have significant environmental impacts (Rossi et al., 2020; Allwood et al., 2019). Studies indicate that the early stages of the product lifecycle, such as production and transportation, can account for more than 70% of total carbon emissions (Muthu, 2020). Therefore, effective management and tracking of environmental information across the full product lifecycle are essential to achieving emission reduction goals.
Although carbon labels and green certifications have been gradually adopted, their presentation remains largely static—relying on symbols or text—and lacks user-friendly data expression formats (Nguyen et al., 2021). Most environmental information is limited to product packaging
or manuals, making it difficult for consumers to fully understand the actual environmental impact these labels represent, thereby weakening their motivation to make green purchasing decisions (Joo et al., 2021). In addition, most current environmental information platforms are enterprise-centric, lacking integration of user behavioral data during the product use and recycling stages, resulting in a persistent data disconnect between enterprise and user ends (Guinée et al., 2016; Huang et al., 2022).
With the advancement of digital technologies and human-computer interaction design, there is new potential to build dynamic and interactive environmental information platforms. By presenting environmental data through dynamic visualizations and integrating real-time user behavior tracking and feedback, such systems can enhance environmental awareness while supporting closed-loop lifecycle data management (Almeida et al., 2022; Wieringa et al., 2020). In particular, incorporating User-Centered Design (UCD), emotional design, and gamification strategies can further increase user engagement and platform stickiness (Rigby & Ryan, 2017; Liao et al., 2021).
Problem Definition Currently, digital platforms for sustainable products face three major challenges: First, data sources are limited, relying heavily on enterprise- side uploads, with a lack of user behavioral data collection and feedback mechanisms (Zhou et al., 2022). Second, the presentation of green information is complex and difficult for users to interpret, resulting in a low conversion rate of environmental awareness into consumer behavior (Janssen et al., 2020). Third, the absence of effective incentive mechanisms makes it difficult to sustain long-term user engagement in sustainable practices (Yang et al., 2022).
Research Objectives To address these challenges, this study introduces Eco Track, a user-centered platform for sustainable product lifecycle management. By integrating data from both enterprises and users, and incorporating visual interfaces and emotional engagement features, the platform aims to enhance transparency across all product stages—production, transportation, usage, and recycling. It uses intuitive data visualization to improve user understanding of key environmental indicators, and applies emotional design and gamification to boost motivation and encourage long-term sustainable behavior.
LITERATURE REVIEW
Sustainable Product Lifecycle Management Life Cycle Assessment (LCA) is currently the most widely used tool for analyzing sustainable products, with extensive applications across sectors such as energy, transportation, food, and building materials (Hauschild et al., 2018; Curran et al., 2017). Standardized LCA procedures, such as those outlined in ISO 14040/14044, have been broadly adopted by enterprises
as the basis for monitoring environmental performance and obtaining green certifications (Zhang et al., 2016).
However, traditional LCA is typically conducted during the product design phase and is primarily driven by enterprises. It relies heavily on data collected from the supply chain while often neglecting users’ actual usage behaviors and end-of-life recycling processes, which limits the comprehensiveness of the lifecycle analysis (Guinée et al., 2016). In recent years, scholars have introduced the concept of Participatory Lifecycle Management (Participatory LCM), which emphasizes the role of user-generated data in enhancing lifecycle modeling (Huang et al., 2022). Nonetheless, related systems and platform implementations are still in early exploratory stages.
Sustainable Interaction Design Methods User-Centered Design (UCD) emphasizes identifying user needs in real-world usage scenarios and improving product usability and contextual adaptability. This method has demonstrated significant success in fields such as smart home systems and energy feedback interfaces (Zhang et al., 2020; Hamari et al., 2019). In recent years, interaction design has played an increasingly important role in sustainability, with growing research interest in integrating user perception with behavioral intervention. For instance, energy-saving data can be presented through color cues, animations, or graphical feedback to reinforce user engagement with sustainable behavior.
Furthermore, emotional design and gamification strategies have proven effective in enhancing long-term user engagement. Studies show that the integration of points, reward mechanisms, and visual feedback elements into green consumption platforms can significantly increase user retention and facilitate the transformation of sustainable intentions into actions (Liao et al., 2021; Rigby & Ryan, 2017). The visualization of metrics such as carbon emissions, water usage, and energy consumption is a critical pathway for enhancing environmental literacy. When combined with technologies such as QR codes or smart labels, these approaches can substantially increase user access to and trust in environmental data.
RESEARCH METHODOLOGY Design Process
This study adopts the Design Thinking approach to guide the development of the Eco Track platform and its interaction system. The process emphasizes a user-centered five-phase iterative cycle: Empathize, Define, Ideate, Prototype, and Test. The research team conducted user research to identify key challenges and motivations related to understanding sustainable information, thereby clarifying the central design issues and proposing functional ideas. During the prototyping phase, interaction sketches were developed and refined through user feedback and usability testing. This user-centered methodology was applied throughout the entire platform development process to ensure that the interface structure, operation flow, and emotional feedback align with user needs and usage habits.
User Research To align the platform design with user needs, this study conducted mixed- method research during the early design phase, focusing on two main user groups: consumer-end users (e.g., eco-conscious individuals, homemakers, and activists) and business-end users (e.g., sustainable entrepreneurs and procurement managers). Together, these groups represent the platform’s core interaction stakeholders.
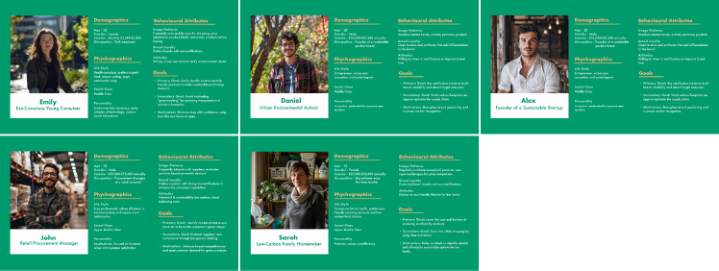
(1) Persona Development Based on preliminary research, five core Personas were created to represent typical users across consumer and business contexts. These include eco- conscious individuals seeking transparency in product information, as well as brand and procurement professionals focused on sustainability compliance and communication. The Personas highlight diverse needs in behavior tracking, feedback preferences, and green value recognition, serving as a practical reference for feature design and interaction flow planning.
Figure 1: User personas.
(2) User Research Methods To gather both quantitative and qualitative insights, the study used a mixed-methods approach combining a questionnaire and semi-structured interviews. The questionnaire, distributed to 38 participants (with 32 valid responses), covered topics such as awareness of green labels, platform usage, visualization preferences, and responses to gamified incentives. Additionally, 12 target users were interviewed—grouped by Persona—to discuss their real-world experiences, concerns, and motivations. The data were analyzed through thematic coding, revealing key user needs in information transparency, efficient feedback, clear visualization, and engaging motivational design.
(3) Scenario-Based Task Design To validate the platform concept, three representative usage scenarios were defined and applied during prototype testing: scanning a product to view its environmental impact, logging usage data to update personal eco- contributions, and recording recycling actions to receive rewards. These scenarios helped simulate real user flows and informed the refinement of key interaction points.
PLATFORM INTERACTION DESIGN FRAMEWORK System Architecture
The Eco Track platform is built around four key stages of the product life cycle: production, transportation, usage, and recycling. It features a dual-end architecture, combining a web-based system for enterprises and a mobile app for users. The platform integrates environmental data collection, user behavior tracking, and feedback to support full-cycle sustainability engagement.
On the enterprise side, manufacturers register products and upload key environmental data—such as carbon emissions, water usage, and energy consumption. The system then generates a digital environmental label linked to a QR code on the product.
On the user side, the mobile app allows consumers to scan the QR code to view lifecycle data, track their usage and recycling behaviors, and receive real-time feedback. Personal eco-contributions—like energy saved or emissions reduced—are visualized through charts on the homepage, reinforcing continued engagement.
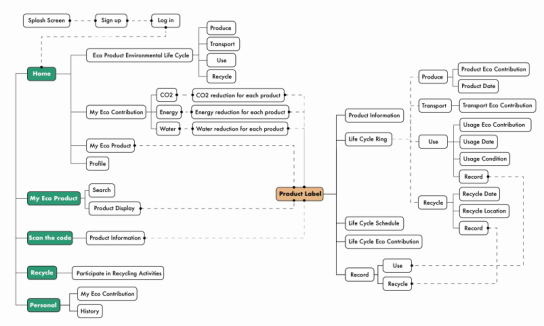
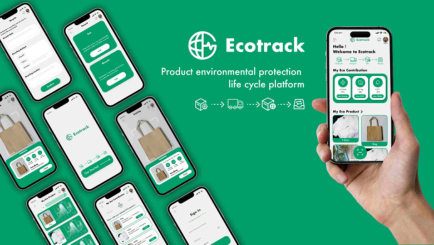
Figure 2: Eco track system architecture interface.Figure 3: Eco track mobile interface overview and life cycle concept illustration.
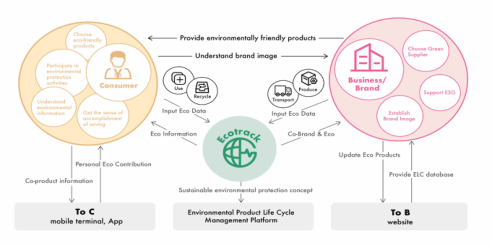
The core logic of the platform lies in the two-way communication between the enterprise and user ends: enterprise-provided data ensures transparency and credibility for consumers, while user behavior data enriches the life cycle dataset and supports the brand’s green credibility. This closed-loop data synergy fosters a co-creation model of green value built on interactive feedback, thereby promoting long-term development of sustainable digital platforms.
Figure 4: Enterprise-user bidirectional data collaboration model.
User Flow and Functional Pathways The platform’s user interaction is designed as a simple loop: scan a product, view its impact, record behavior, and receive feedback—minimizing the learning curve and encouraging continued use. New users are guided through a welcome screen to register or log in via email, username, Google, or Apple ID, after which they enter the homepage.After logging in, users land on the homepage, where the top section shows their environmental contributions— energy saved, CO2 reduced, and water conserved—along with icons and progress percentages. The lower section lists scanned eco-labeled products, which link to detailed lifecycle data.
Figure 5: Login and registration interfaces & APP homepage interface.
Figure available in the original PDF paper.
Tapping the scan button activates the camera to scan a product’s QR code. The app then shows the product’s environmental label, including name, material, key carbon/water/energy data, and a visual life cycle path. Users can view impact comparisons (e.g., “3.2 kg CO2 saved = 12 km less driving”) and read detailed info on production and materials.
Figure 6: Scan interaction and label information page.
Figure available in the original PDF paper.
User Behavior Tracking and Feedback System In the “Record” module, users can log their product usage and recycling actions. They enter usage dates and frequency, or record recycling time, method, and location. Submitted data updates their personal environmental records and is reflected on the homepage.
Figure 7: Usage and recycling record interfaces.
Figure available in the original PDF paper.
The “My Eco Contribution” module provides users with staged feedback on their environmental achievements, organized under three tabs: Energy, CO2, and Water. Users can review contribution logs per product and visualize the positive environmental effects of their actions—for example, “You reduced 1.3 kg of CO2 by purchasing this T-shirt.” Each metric is displayed on a dedicated card showing the total contribution and percentage progress, reinforcing users’ green identity and motivation.
The “Product Label” and “Produce Detail” modules in Eco Track aim to comprehensively present a product’s environmental performance and data sources across all life cycle stages. These components form the platform’s core informational architecture and are key interaction points for driving sustainable consumption behavior.
Figure 9: Product lifecycle detail interface.
Figure available in the original PDF paper.
On the product detail page, Eco Track presents a circular diagram of the four life cycle stages—Production, Transportation, Usage, and Recycling— along with a “Life Circle”score to reflect overall environmental performance. Users can view carbon, water, and energy data by stage, along with trend charts and timelines. The lower section provides material and manufacturing
details through text and visuals. This combination of graphics and data creates an intuitive and trustworthy green label system that improves user understanding and confidence in sustainable products.
USABILITY TESTING AND USER FEEDBACK Testing Objectives and Methods
After developing the high-fidelity prototype of Eco Track, a structured usability test was conducted to assess interaction flow, visual clarity, task efficiency, and user satisfaction. The test focused on key modules like QR scanning, behavior logging, visual feedback, and gamified incentives. Using task-based testing and the System Usability Scale (SUS), 12 users—including both business and consumer representatives from the five Personas— participated. All had prior platform experience and basic eco-awareness and digital skills.
Task Design and Interaction Flow To assess the platform’s functionality and usability, five key tasks were designed based on user journey analysis. These included: scanning a product to access lifecycle data, logging usage and recycling behaviors, viewing personal environmental contributions, and completing a gamified green task. Each task targeted a core feature, allowing evaluation of interaction flow, form usability, visual clarity, and incentive effectiveness.
Table 1: Mapping of user tasks and evaluation metrics.
Table available in the original PDF paper.
Avg. Time Common Issues Task ID Description Success Rate (%) (s) Identified
T1 Scan and view lifecycle data
100% 18.3 2 users unclear about Life Circle scoring T2 Log usage behavior
92% 23.1 1 user misunderstood frequency selector T3 Log recycling behavior
100% 26.8 2 users found location input field hard to interpret T4 View
100% 15.2 1 user confused by some visual icons
contribution metrics T5 Complete task and receive reward 100% 21.4 1 user overlooked badge/points update
Evaluation Results and Analysis (1) System Usability Scale (SUS) Evaluation
To quantitatively assess the platform’s usability and first-time user satisfaction, the System Usability Scale (SUS) was applied post-task. This standardized tool consists of 10 five-point Likert items assessing
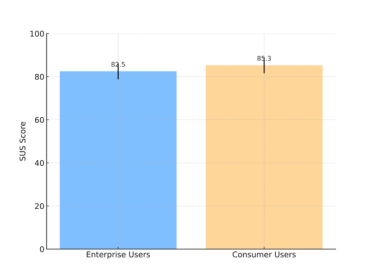
usability dimensions such as learnability, complexity, feature integration, user confidence, and overall experience. All 12 users completed the SUS questionnaire. The average SUS score was 84.2, which exceeds the excellent usability threshold of 80.3. Breakdown of results: Business-end users: 82.5,Consumer-end users: 85.3,Standard deviation: ±3.7. These results suggest that the Eco Track platform performs well in terms of layout clarity, interaction flow, and perceived ease of use. Open-ended feedback highlighted the QR scan feature, task guidance, consistent color schemes, and iconography as highly intuitive. The lifecycle score display and eco achievement feedback modules were especially praised as “concretizing abstract environmental concepts” and “evoking behavioral resonance.”
Figure 10: SUS score distribution chart.
(2) Task Completion and Interaction Analysis From a behavioral perspective, the platform showed strong usability with an average task completion rate of 98.3% and an average total time of 89 seconds, indicating smooth interaction and high learnability. All tasks were completed successfully by most users, with only a minor issue in Task T2, where one user misunderstood the frequency selector. Users found the QR scanning (T1), recycling input (T3), and eco-contribution viewing (T4) intuitive, though suggestions included adding tooltips, structured input fields, and icon explanations. In Task T5, some users missed the reward feedback, suggesting the need for more prominent visual cues. Notably, over 75% of participants highlighted the eco-feedback cards—such as “equivalent to driving 12 km less”—as especially motivating and memorable.
DISCUSSION AND CONCLUSION This study presents Eco Track, a user-centered platform that connects enterprise environmental data with user behavior across four product lifecycle stages: production, transportation, usage, and recycling. By integrating QR identification, data visualization, gamified incentives, and feedback mechanisms, the platform enhances the accessibility of environmental information and encourages sustainable engagement.
Usability testing shows strong results, with an average SUS score of 84.2 and a 98.3% task completion rate. Features such as lifecycle scoring and eco-achievement tracking effectively translate abstract sustainability concepts into meaningful actions. Users responded positively to visual feedback and gamified tasks, indicating high learnability and motivational impact.
However, limitations remain. The current version lacks integration with real-time enterprise systems, and the user sample was limited to younger, environmentally conscious individuals. Future research should involve broader demographic testing, integration of actual product data, and stronger privacy safeguards.
In sum, Eco Track demonstrates that transparent lifecycle data and engaging interaction design can turn environmental awareness into tangible behavior. The platform offers practical insights for sustainable digital experiences and serves as a reference model for green transformation in product and service ecosystems.
REFERENCES
Almeida, R., Barbosa, J. L. V. and Alves, M. B., 2022. A framework for integrating product environmental information using smart labels: A consumer-centered perspective. Journal of Cleaner Production, 343, p. 130956. Allwood, J. M., Ashby, M. F., Gutowski, T. G. and Worrell, E., 2019. Material
efficiency: A white paper. Resources, Conservation and Recycling, 55(3), pp. 362–381. Bernardes, A. M., Zamberlan, R. M. and Figueiredo, R. A., 2023. Data visualization for environmental awareness: Strategies and user engagement in sustainability dashboards. Sustainability, 15(2), p. 4572. Curran, M. A., 2017. Life Cycle Assessment: A Review of the Methodology and
Its Application to Sustainability. Current Opinion in Chemical Engineering, 17, pp. 79–84. Guinée, J. B., Heijungs, R., Huppes, G. and Zamagni, A., 2016. Life cycle assessment: Past, present, and future. Environmental Science & Technology, 50(13), pp. 7390–7395. Hamari, J., Koivisto, J. and Sarsa, H., 2019. Does gamification work? – A literature
review of empirical studies on gamification. In: Proceedings of the 47th Hawaii International Conference on System Sciences. Hawaii, USA: IEEE, pp. 3025–3034. Hauschild, M. Z., Rosenbaum, R. K. and Olsen, S. I., 2018. Life Cycle Assessment: Theory and Practice. Cham: Springer. Huang, B., Yang, Y. and Yang, J., 2022. Participatory life cycle management:
Integrating user data into LCA for sustainable design. International Journal of Life Cycle Assessment, 27(4), pp. 556–567. Janssen, M., Chang, S. and Mohaddes, S., 2020. User understanding of eco-labels: A review of consumer perception studies. Journal of Environmental Psychology, 71, p. 101439. Joo, J., Kim, S. and Kim, H., 2021. How eco-labels affect consumers’ purchase
intention: The mediating role of environmental concern. Sustainability, 13(3), p. 1040. Liao, Y., Song, S. and Du, Y., 2021. Gamification for sustainable consumption: A systematic review of design strategies and behavioral outcomes. Sustainability, 13(19), p. 10843.
Muthu, S. S., 2020. Assessing the Environmental Impact of Textiles and the Clothing Supply Chain. Cambridge: Woodhead Publishing. Nguyen, T., Ngo, T. D. and Le, T. P., 2021. Green labels and consumer trust: The role
of information clarity and credibility. Journal of Retailing and Consumer Services, 59, p. 102388. Rigby, C. S. and Ryan, R. M., 2017. Time well-spent? Motivation for entertainment media and its eudaimonic aspects through the lens of self-determination theory. In: Reinecke, L. and Oliver, M. B., eds. The Routledge Handbook of Media Use and Well-Being. London: Routledge, pp. 34–48. Rossi, M., Charon, S., Wing, G. and Ewell, J., 2020. Design for environment: A
life cycle approach using ISO 14040 and ISO 14044. Environmental Quality Management, 29(3), pp. 65–77. Wieringa, M., van den Hoven, J. and Beekman, V., 2020. Data-driven design for sustainability: Using feedback to improve environmental behavior. Journal of Responsible Technology, 1, p. 100001. Yang, S., Liu, Y. and Chen, Y., 2022. Understanding user participation in
environmental behavior platforms: The roles of gamification and social influence. Computers in Human Behavior, 130, p. 107192. Zhang, Y., Ren, S. and Liu, Y., 2016. Life cycle assessment of consumer products: Challenges and opportunities. Environmental Impact Assessment Review, 60, pp. 1–7. Zhang, R., Chen, Y. and Xu, F., 2020. User-centered sustainable design: Practices
and future trends. Sustainability, 12(18), p. 7551. Zhou, D., Wang, J. and Tang, M., 2022. Bridging the data gap in sustainable platforms: A review of participatory eco-design tools. Journal of Cleaner Production, 338, p. 130507.
LISTED IN THE AHFE DIGITAL BOOKSTORE CATALOGUE
Explore the complete digital volume
Affective and Pleasurable Design
Read this individual research paper free through the original publisher, or explore the full digital proceedings book.
ISBN 978-1-964867-40-3
Explore this ISBN in the AHFE Bookstore ↗Listed in the July 2026 bookstore catalogue; search by ISBN to confirm current availability · Digital book purchase optional