Haruki Yamada, Hiroaki Kosaka (2025). Prototype of system to identify shape of figure from contour drawn by line of sight. In: Accessibility, Assistive Technology and Digital Environments. AHFE Open Access, vol. 162, pp. 81–87. https://doi.org/10.54941/ahfe1006015
Some diseases, such as amyotrophic lateral sclerosis, make it impossible to move only a limited number of body parts. Patients with these diseases have normal thinking ability and will, but their means of expressing their intentions are diminished. For instance, patients who cannot move their mouths cannot speak, and patients who cannot move their fingers cannot write or operate a PC or smartphone. Eye gaze-based input systems are developed as a new input method in PCs and smartphones. Current gaze input systems often operate the computer by varying the duration of gazing and blinking. This system has two types of operations. Here, consider operating a smartphone with eye gaze-based input. In this case, selection of an icon and tap operations can be performed, but there are not enough types of eye gaze-based input to perform flick, pinch-in or pinch-out operations. In addition to gazing and blinking, Kosaka et al. propose drawing figures such as circles and rectangles on the screen with the line of sight. For instance, if a user surrounds the icon with the line of sight and the trajectory of the line is square, the user flicks it. This allows for more types of operations using eye tracking-based input. Therefore, Kosaka et al. developed a prototype system to estimate the type of figure drawn from the trajectory data of the line of sight on the screen using a probabilistic Hough transform, but the system did not perform well in recognizing figures. In this study, we developed and evaluated the prototype machine learning system to recognize the type of figure drawn from eye tracking data. We expect that the system recognizes shapes correctly even when gaze trajectory data contains a lot of noise or relatively complex shape data by using machine learning. The prototype system using transition learning correctly identified relatively large shapes 97% of the time and relatively small shapes 78% of the time.
Diseases such as amyotrophic lateral sclerosis restrict movement in only certain parts of the body. Patients with these diseases retain normal thinking ability, cognitive abilities and decision-making capacity, but their ability to express their intentions is diminished (Tetsuya et al., 2005). For instance, patients who cannot move their mouths cannot speak, and those who cannot move their fingers cannot write or operate a PC or smartphone. Eye gaze- based input systems have been developed as an alternative input method for PCs and smartphones. Current gaze input systems typically operate computers by varying the duration of gazing and blinking. These systems support two types of operations. Consider operating a smartphone using eye gaze-based input. While selecting an icon and performing tap operations are possible, existing gaze-based input methods do not support actions like flicking, pinching in, or pinching out. In addition to gazing and blinking, Kosaka et al. proposed a method in which users draw figures, such as circles and rectangles, on the screen using line of sight. For instance, if a user surrounds the icon with the line of sight and the trajectory of the line is square, the system interprets this as a flick gesture. This approach enables more types of operations using eye tracking. Kosaka et al. developed a prototype system to recognize figures on the basis of gaze trajectory data
using a probabilistic Hough transform. However, the system struggled with accurate figure recognition.
In this study, we developed and evaluated a prototype machine learning system to identify the type of figure drawn using eye tracking data. By leveraging machine learning, we aim to improve shape recognition accuracy, even when the gaze trajectory data contains significant noise or represents relatively complex shapes.
GRAPHIC IDENTIFICATION SYSTEM
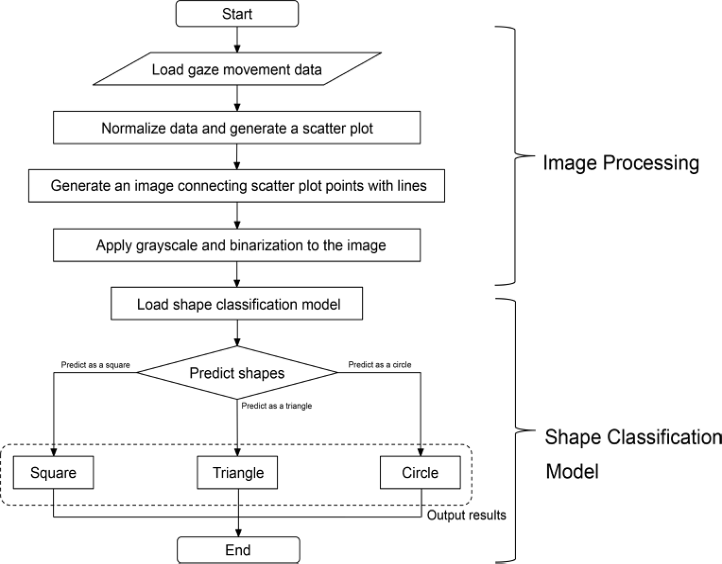
Figure 1 shows the scheme and procedure of the graphic identification system. The system consists of two main components: image processing, which generates images from eye movement recording data, and shape classification model, which identifies the shape of the figure using machine learning.
Figure 1: Scheme and procedure of graphic identification system.
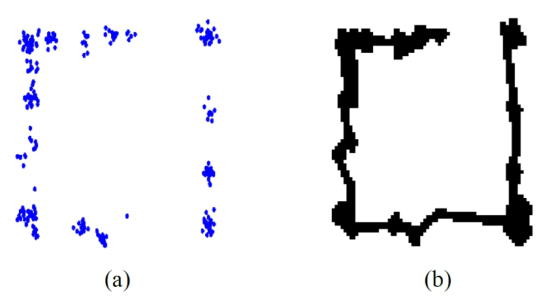
Image Processing The input data for this system consists of eye movement time-series data recorded while a participant looks at the computer screen. The eye movement data are captured as time-specific XY coordinates. For instance, when a participant traces the outline of a square with their gaze on the screen, a scatter plot, as shown in Figure 2(a), can be generated on the basis of the recorded XY coordinates. This scatter plot represents the contour of the gaze trajectory traced by the participant. The system then connects the points in
Prototype of System to Identify Shape of Figure From Contour Drawn by Line of Sight 83
the scatter plot with straight lines to generate a black-and-white image, as shown in Figure 2(b). This image is used as training data to build the shape classification model.
Figure 2: (a) Example of recorded gaze data when a participant traces the outline of a square on the screen, (b) generated black-and-white image of connected gaze data.Figure 3: Composition of transfer learning model.
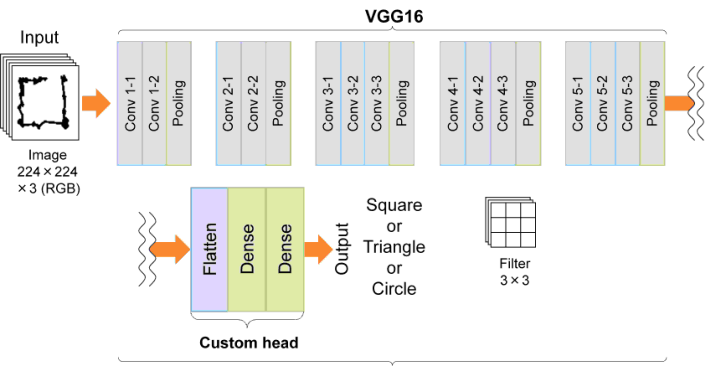
Shape Classification Model Kosaka et al. recorded eye movement data while participants traced squares, triangles, and circles with their gaze on a computer screen. This data was used to train the system. We applied transfer learning (Toshihiro, 2010) to build the model. Figure 3 shows the structure of the transfer learning model for shape classification. We adopted VGG16 (Karen et al., 2015) as the pre-trained model. VGG16 consists of 13 convolutional layers alternating with 5 pooling layers, followed by 3 fully-connected layers at the end. We applied a custom head to this system that retains VGG16’s feature
84 Yamada and Kosaka
extraction capabilities while incorporating a new Flatten layer and two fully- connected layers. The system’s input was a 224 × 224 pixel RGB image generated from eye movement data. The 3D tensor was converted into a 1D vector in the Flatten layer before being fed into the fully-connected layers. The first fully-connected layer contained 256 nodes and used a ReLU (Rectified Linear Unit) (Abien, 2019) activation function. The second fully-connected layer had three output nodes, corresponding to square, triangle, and circle classifications, and applied a softmax activation function (Bolin et al., 2018).
Apparatus
Table 1 shows the parameters of the transfer learning model we developed.
Table 1: Parameters of developed model.
Table available in the original PDF paper.
Item Details Figure Type Square, triangle and circle Dataset 180 for training and 20 for evaluation in each figure Data Argumentation Random rotation within 25 degrees Horizontal and vertical inversion Pre-trained Model VCG16 Epoch 15 Batch Size 32 Image Size 224 square pixels Convolutional Layer 13 layers Pooling Layer 5 layers Flatten Layer 1 layer Hidden Layer 1 fully connected layer (dense layer), 256 neurons and ReLU activation function Output Layer 1 fully connected layer (dense layer), 3 neurons and softmax activation function Loss Function Categorical cross-entropy Optimizer Adam (default setting)
Training Results
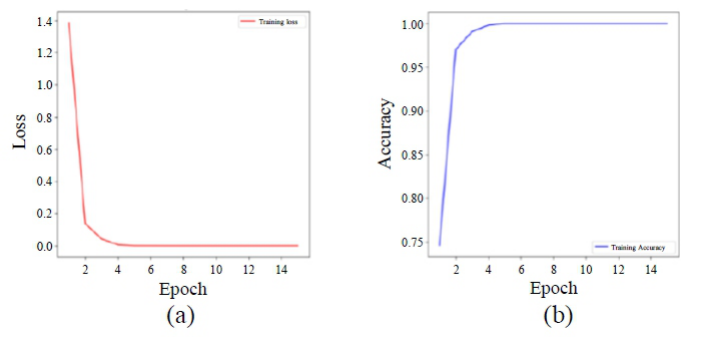
Figure 4 shows the loss and accuracy of the training dataset at each epoch. In epoch 14, the loss was extremely small at 0.00004117, and the accuracy reached its maximum value of 1.00. This high accuracy suggests that our model fits the training data well.
Next, we tested the model using a dataset not used during training. The model achieved a high accuracy of 0.9825. However, it should be noted that both the training and test data were collected from the same participants. Therefore, this evaluation may be insufficient to assess the mode’s generalizability.
Prototype of System to Identify Shape of Figure From Contour Drawn by Line of Sight 85
Figure 4: Loss (a) and accuracy (b) for training data set.
EXPERIMENT TO EVALUATE GRAPHIC IDENTIFICATION SYSTEM We conducted an experiment to evaluate the prototyped shape identification model. In this experiment, we collected new eye movement data as participants traced shapes on the screen with their gaze. We input the data collected in this experiment into the graphic identification model and evaluated whether it could accurately identify the type of figure drawn from eye tracking data.
Procedure The procedure for this experiment was as follows:
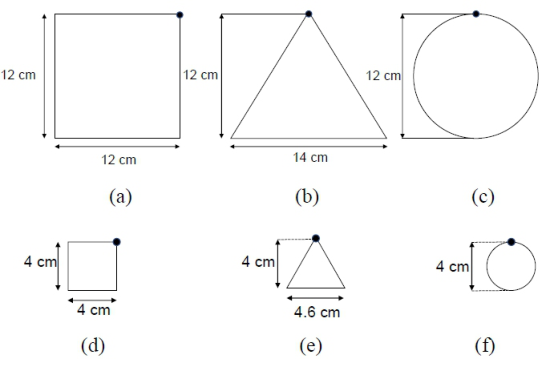
1. We explained the purpose of the experiment, the tasks participants would perform, and any potential risks. A total of 30 participants agreed to participate. 2. We calibrated the gaze measurement system for each participant to ensure accurate eye movement recording. 3. We displayed one of the figure images (square, triangle, or circle) from Figure 5 on a PC monitor. 4. Participants traced the outline of each shape, starting from the vertex marked with a black dot. 5. We recorded their eye movements. 6. Participants repeated steps 3 to 5 six times, tracing all six figures in Figure 5 with their gaze. 7. We inputted the eye movement data obtained in step 6 into the graphic identification system shown in Figure 1. 8. The system outputted the results of the shape identification.
Results
Table 2 shows the accuracy of the graphic identification system. The table shows that relatively large figures—Figure 5(a), (b), and (c)—all achieve an accuracy of over 95%. This indicates that the system can identify larger figures with high accuracy.
86 Yamada and Kosaka
Figure 5: Figures participants looked at and traced on computer screen. Lengths in each figure indicate sizes when displayed on computer screen.Table 2: Accuracy of the graphic identification system’s output.
Next, we focus on the type of figures. Table 2 shows that the accuracy for the relatively small square, Figure 5(d), is lower than that of the large one, Figure 5(a). A similar trend is observed when comparing the accuracy of the circles in Figures 5(c) and (f). However, no significant difference in accuracy was found between Figures 5(b) and (e).
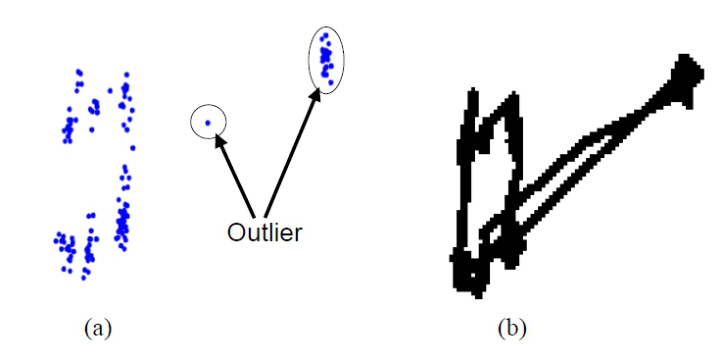
Here, we consider why accuracy is unaffected by size for triangles. Figure 6(a) shows recorded gaze data from a participant tracing the outline of a square on the screen. This data contains outliers. We assume that outliers may arise from two possible causes: (1) the participant momentarily gazed at a location other than the intended contour, or (2) the gaze measurement device incorrectly detected the gaze point. The shape classification model tends to classify inputs such as those in Figure 6(b) as triangles. To improve the accuracy of for Figures 5(d) and (f) shown in Table 2, the noise similar to that as shown in Figure 6(b) should be removed before inputting it the data into the model. One possible improvement is to smooth the trajectory by connecting points with curves rather than straight lines when generating input images, as seen in Figure 6(b).
Prototype of System to Identify Shape of Figure From Contour Drawn by Line of Sight 87
Figure 6: (a) Example of recorded gaze data when a participant traces the outline of a square on the screen. The data included outliers. (b) Generated black-and-white image of connected gaze data.
CONCLUSION
In this study, we proposed a new input method for operating a computer: tracing the outline of a figure on the screen with the user’s eyes. We prototyped a system in which eye movement data is used as input when the user traces the outline of a shape on the screen with his/her gaze, and the system automatically identifies the shape. We conducted an experiment to evaluate the system. The results showed that the system could identify triangles, as well as relatively large squares and circles, with good accuracy. However, the system struggled to accurately identify relatively small squares and circles. Future research will focus on improving the accuracy of our system’s shape identification, such as by removing noise from the input data.
REFERENCES
Abien Fred M. Agarap. (2019). Deep Learning using Rectified Linear Units (ReLU), arXiv:1803.08375v2. Bolin, Gao and Lacra, Pavel. (2018). On the Properties of the Softmax Function with
Application in Game Theory and Reinforcement Learning, arXiv:1704.00805v4. Karen, Simonyan and Andrew, Zisserman. (2015). Very Deep Convolutional Networks For Large-Scale Image Recognition, Conference Paper at International Conference on Learning Representations 2015. Tetsuya, Ohya and Masashi, Kawasumi. (2005). Development of an Input Operation
for the Amyotrophic Lateral Sclerosis Communication Tool Utilizing EOG, Transactions of Japanese Society for Medical and Biological Engineering, Vol. 43, No. 1, pp. 172–178 (in Japanese). Toshihiro, Kamishima. (2010). Transfer Learning, Journal of the Japanese Society for Artificial Intelligence, Vol. 25, No. 4, pp. 572–580 (in Japanese).
LISTED IN THE AHFE DIGITAL BOOKSTORE CATALOGUE
Explore the complete digital volume
Accessibility, Assistive Technology and Digital Environments
Read this individual research paper free through the original publisher, or explore the full digital proceedings book.
ISBN 978-1-964867-38-0
Explore this ISBN in the AHFE Bookstore ↗Listed in the July 2026 bookstore catalogue; search by ISBN to confirm current availability · Digital book purchase optional