Tatsuya Sakabe, Hiroaki Kosaka (2023). Attempt to develop analysis model of reader’s pictogram understanding process. In: Cognitive Computing and Internet of Things. AHFE Open Access, vol. 73, pp. 212–218. https://doi.org/10.54941/ahfe1003298
When designing pictograms, a pictogram designer decides the meaning intended to be conveyed by a pictogram. It is desirable that the reader understands the meaning of the pictogram as intended by the designer. However, there are readers who understand a pictogram very differently from the designer's intention. Due to this difference between the designer’s intention and these readers’ understanding, the pictogram communicates the wrong message to the readers. This difference should be minimized.We attempted to develop a model to analyze a reader’s pictogram comprehension process. Analyzing the reader's pictogram comprehension process will contribute to clarifying the causes of differences between readers’ understanding and designers’ intentions. The proposed model does not simulate the cognitive processes of the reader. Instead, it logically analyses the process from the pictogram that a reader reads as input to the phrases representing the pictogram described by the reader as output.First, we conducted an experiment in which subjects looked at pictograms and described what pictograms they saw. We collected pictogram comprehension data through the experiment. Second, on the basis of the collected data, we developed a model that analyzed the process of understanding for the pictograms used in the experiment.The proposed model consists of three procedures:1)Breaking down the pictogram that a reader reads into its elements such as human beings and objects.2)Analyzing the relationship between each element.3)Analyzing the relationship between how a reader actually reads and understands a pictogram and the pictogram's grammatical relationship.We believe that the model is useful for estimating in detail why readers understand pictograms the way they do.
Pictograms used for public facility information, etc., must be easily under- stood and accurately conveyed to everyone. However, there are pictograms that cannot be understood correctly. Because it is desirable for all people to be able to understand all pictograms correctly, a method is required for designing and evaluating pictograms that can be understood correctly.
Ros offers guidance in designing and reporting pictogram-based research in health communication (Ros, 2021). She also asserts that future pictogram research should focus on the type of information being conveyed, in addi- tion to legibility and visibility characteristics such as color, size, shape, line thickness, figure/background contrast, crowding, viewing distance, and print quality (Ros, 2021).
Communication between patients and healthcare workers (HCWs) may on occasion be challenged by disparities in cultural background, age and educa- tional level. Pictograms are considered effective for smooth communication between patients and HCWs. Farnam et al. evaluate the scientific literature and investigate the effect and practical utility of pictograms in medical set- tings with focus on dermatological patients (Farnam et al. 2022). They assert that the quality of the development process is important to ensure the utility
Attempt to Develop Analysis Model of Reader’s Pictogram Understanding Process 213
of any pictogram. They also describe that involving the target population in the design and validation of the pictograms may be critical.
Spinillo discusses the use of pictograms considering their information content, graphic complexity and cultural dimension (Spinillo, 2012). She indicates that pictograms can be regarded as communication artifacts that integrate syntactic and semantic aspects of a message and are related to readers’ perception of pictorial representation and, their production and interpretation are embedded in a cultural context (Spinillo, 2012). She also points that pictograms should be designed with a cultural and gender accent (Spinillo, 2012).
While these previous works are interesting findings, they do not address how to specifically apply these findings. Specific methodologies for designing easy-to-understand pictograms and specific tools to explain how pictograms are understood are required.
We believe that the pictogram understanding process needs to be analy- zed for improving pictogram design. From the perspective of semiotics, Tanaka analyzed the information conveying function of pictograms for facility information displays (Tanaka, 2018). As a result of the analysis, Tanaka argued that the information conveying function of pictograms can be explained by their iconicity, indexicality, determinacy, or a combination thereof (Tanaka, 2018). He also argued that these properties of picto- grams make their informational content intuitive (Tanaka, 2018). On the other hand, he argued that the context in which a pictogram is used influ- ences the understanding of the pictogram, and that a pictogram can be understood in multiple ways depending on the context in which it is used (Tanaka, 2018).
Tanaka described important perspectives in analyzing how pictograms are understood (Tanaka, 2018) but did not provide a practical procedure for analyzing individual pictograms.
The purpose of this study is to prototype a model that logically analyzes the understanding of pictograms. The model aims to be able to explain why certain pictograms are understood as they are. Understanding the reasons for the difference between the reader’s understanding and the designer’s intent will help improve pictogram design.
INFORMATION CONVEYING FUNCTION ELEMENT OF PICTOGRAM Information transfer function elements of a pictogram are defined in previous studies (Tanaka, 2018, 2019). These elements affect the reader’s understan- ding of the pictogram. We assume that these elements can be categorized into three categories.
1. Characteristics of a pictogram itself 2. Environment in which pictograms are used 3. Knowledge and experience of a reader.
These three points are explained in detail.
214 Sakabe and Kosaka
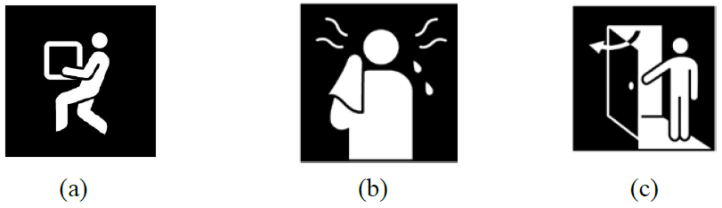
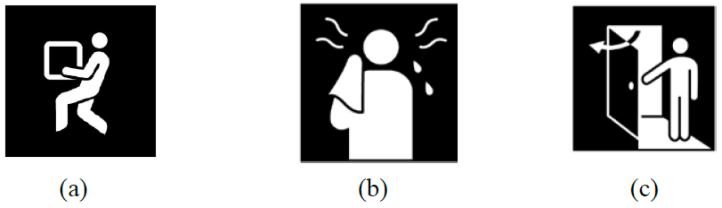
Characteristics of a Pictogram Itself Characteristics of a pictogram itself consist of constructiveness and indexi- cality, which are defined in previous studies (Tanaka, 2018). Consider the pictograms in Figure 1.
The pictogram in Figure 1(a) consists of two elements: a square object and a person holding it. As shown in Figure 1(a), a pictogram can be bro- ken down into elements that have meaning in their own right. This is called constructiveness (Tanaka, 2018).
The pictogram in Figure 1(b) shows a curve that represents heat, which is invisible in reality. The pictogram in Figure 1(c) shows an arrow indicating the direction of door motion. These pictograms visually represent by means of symbols what is not visible in reality. This is called indexicality (Tanaka 2018).
Environment in Which Pictograms Are Used Consider the pictogram in Figure 2.
To understand this pictogram as a ticket office or a fare adjustment, it is necessary to recognize that the object held by the person in this figure is a ticket and that the design on the left side represents a ticket vending machine or a fare adjustment machine. To understand the pictogram in this way, the pictogram needs to be used in a station or airport. The reader’s understanding of a pictogram depends on the place where the pictogram is used. This is called context (Tanaka, 2018).
Knowledge and Experience of a Reader Knowledge and experience of a reader consist of analogy, contract, and domain. Consider the pictograms in Figure 3.
Figure 1: Example of pictograms: (a) Person who carries a thing, (b) Hot, and (c) Open.Figure 2: Example of pictogram. Tickets and fare adjustment.
Attempt to Develop Analysis Model of Reader’s Pictogram Understanding Process 215
Figure 3: Example of pictogram: Cat.
Figure available in the original PDF paper.
The pictogram in Figure 3 can be easily understood as a cat. This is because the designer of this pictogram and the reader share the same visual image of a cat. This is called analogy (Tanaka, 2018). Contract and domain are explained in previous studies (Tanaka 2018, 2019).
ANALYTICAL PROCESS MODEL OF UNDERSTANDING PROCESS First, Kosaka et al. conducted an experiment in which 13 participants read 56 pictograms and answered what each pictogram was. For example, when reading the pictogram in Figure 1(a), participants answered in a variety of ways, including “carry” and “carry things.” Next, we developed a pictogram understanding analysis process model on the basis of the pictograms inclu- ding Figure 1(a) and example answers collected in that experiment. We also developed a model on the basis of the characteristics of a pictogram itself, environment in which pictograms are used, and knowledge and experience of a reader defined in the previous section. This model attempts to logically explain why the pictogram in Figure 1(a) led to answers such as “carry” and “carry things.”
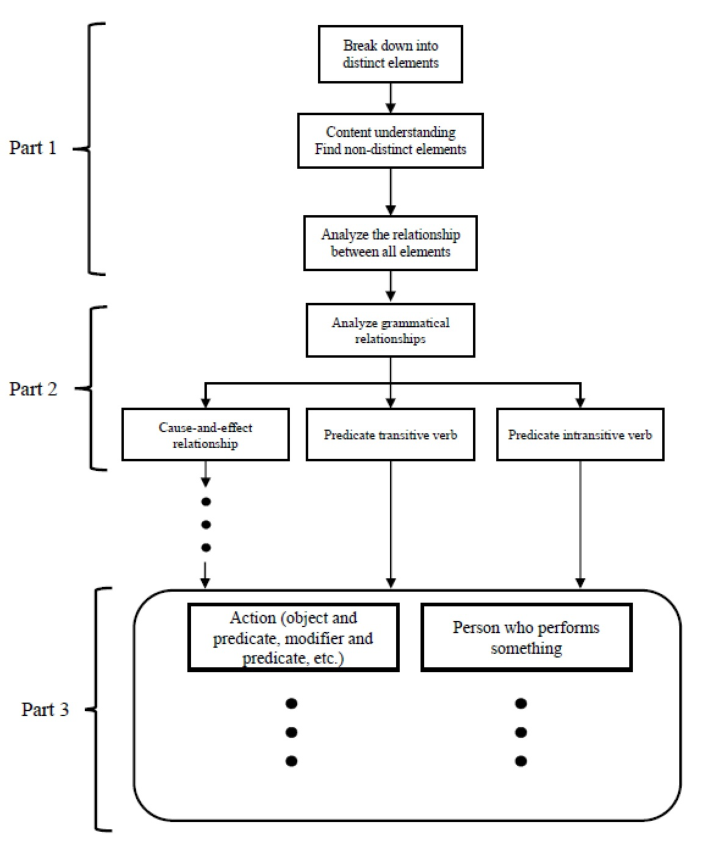
Figure 4 shows part of the model we developed. The model consists of three major parts, Part 1, Part 2 and Part 3. Each part is described below.
Part 1: Break down the elements that make up a pictogram. There are two main types of elements. The first is an element as seen, such as “person” or “door.” The second is an element obtained as a result of associating with the pictogram and the elements, such as “heavy” or “hot.” In a pictogram, several elements may make up a meaningful figure. Those elements can be considered as one group.
Part 2: Analyze a grammatical or causal relationship between elements or groups of elements in a pictogram.
Part 3: Determine how a pictogram is understood by the grammatical and causal relationships between elements. The determinants are various, inclu- ding the behavior exhibited by the element or group of elements, the subject of the behavior, the instructions, and commonality.
Here we attempt to use this model to explain why the reader of the pictogram in Figure 1(a) understood it as “carry things”.
First, a pictogram with constructiveness has multiple elements that have meaning by themselves. Extracting these one by one is called elemental decomposition. Decomposed elements are called distinct elements. For exam- ple, recognizing Figure 1(a) by dividing it into “objects” and “person” is elemental decomposition, and each element is called a distinct element.
216 Sakabe and Kosaka
Figure 4: Pictogram understanding analysis process model.
The reader of a distinct element considers what it indicates and again understands the element. We called that content understanding. For exam- ple, the square object in Figure 1(a) can be understood as “a thing” as it is, but it is also natural to understand it as “luggage.”
A pictogram reader may read something that is not written in the picto- gram. For example, a reader of Figure 1(a) may associate “heavy” with it. In such cases, we consider “heavy” as one element and call the element a non- distinct element. From the above, we assume that a reader breaks down a pictogram into its elements. For example, we assume that Reader A breaks down Figure 1(a) into three elements: “things,” “person,” and “carry.”
Next, we analyze the relationship for all obtained elements. In many cases, the analysis is based on grammatical structures. For example, we assume
Attempt to Develop Analysis Model of Reader’s Pictogram Understanding Process 217
the pictogram in Figure 1(a) has the elements “luggage,” “heavy,” “person,” and “carry”. In this case, if “person” is the subject, “heavy” is the modifier, “luggage”is the object, and “carry”is the predicate, we can consider one sen- tence “A person carries heavy luggage.” When the sentence is considered from these elements in this way, we assume that there is a grammatical relation- ship between the elements. We assume that there are three major grammatical relationships:
1. The elements have a causal relationship. 2. The predicate is a transitive verb. 3. The predicate is an intransitive verb.
In the case of Reader A, she/he considers the sentence “A person carries a thing.” The predicate is a transitive verb: “carry.” Therefore, the case corre- sponds to “2. The predicate is a transitive verb.” From the above, we believe that when a reader reads the pictogram in Figure 1(a) and understands that the pictogram has the elements “thing,” “person,” and “carry,” she/he reads the pictogram as a sentence whose predicate is a transitive verb.
Finally, we analyze the relationship between how a reader actually reads and understands a pictogram and the pictogram’s grammatical relationship. We assume that Reader A reads the pictogram in Figure 1(a) to mean “Carry things.” Then we consider that Reader A answers “Carry things” when picking out the predicate and the object from the sentence “A person car- ries a thing.” From the above, we attempted to logically explain why the pictogram in Figure 1(a) led to the answer “Carry things”.
Reader B understood Figure 1(a) to mean that the luggage is heavy. Here we analyze why he understood it that way using the model in Figure 4 for this case.
First, Figure 1(a) is decomposed into distinct elements “things” and “per- son”. Next, “thing” is interpreted as “luggage.” This is content understan- ding. Furthermore, Reader B associates that the luggage is heavy based on the posture of the person holding it in Figure 1(a) and a non-distinct element “heavy” is found.
Reader B understands “a luggage is heavy” and “a person carries luggage heavily” from the relation among these distinct elements and non-distinct elements. There is a cause-and-effect relationship between the two sentences. Finally, Reader B focused on the cause, “the baggage is heavy,” which he understood and answered “the luggage is heavy” to see Figure 1(a).
We analyzed that Reader B found a cause-and-effect relationship in the pictogram. He also interpreted “thing” as “luggage” and focused on “heavy” and “luggage”. Thus, we can analyze the differences in understanding between readers A and B using the model shown in Figure 4.
CONCLUSION
We attempted to logically explain why readers read pictograms the way they do. An experiment was conducted in which 13 participants read 56 pictograms and answered what each pictogram was. We developed a
218 Sakabe and Kosaka
pictogram understanding analysis process model and attempted to analyze the pictogram understanding process by using the model.
Future work will logically explain another case of why readers read pictograms the way do and explain the entire model we developed.
ACKNOWLEDGMENT
The authors would like to acknowledge Daishin Uemura, a former stu- dent of National Institute of Technology, Nara College, who carried out the experiment together.
REFERENCES
Atsushi Tanaka. (2018) “A Semiotic Study of Pictograms in the Guide Display”, bulletin of Faculty of International Studies, Niigata University of International and Information Studies Volume 3. pp. 41–50 (in Japanese) Atsushi Tanaka. (2019) “A Cognitive Semiotic Study for an Interpretation of
Pictograms”, bulletin of Faculty of International Studies, Niigata University of International and Information Studies Volume 4. pp. 131–143 (in Japanese) Farnam Barati Sedeh, et al (2022), “Communicating with patients through pictograms and pictures – a scoping review”, Journal of Dermatological Treatment, Vol. 33, pp. 2730–2737 Gunther Kress, Theo van Leeuwen. (2021). Reading images. New York: Routledge. Ros Dowse. (2021) “Designing and reporting pictogram research: Problems, pitfalls
and lessons learnt”, Research in Social and Administrative Pharmacy, Vol. 17, pp. 1208–1215 Spinillo, Carla Galvão (2012), “Graphic and cultural aspects of pictograms: an information ergonomics viewpoint”, Proceedings of 18th World congress on Ergonomics, Vol. 41, No. Supplement 1, pp. 3398–3403
LISTED IN THE AHFE DIGITAL BOOKSTORE CATALOGUE
Explore the complete digital volume
Cognitive Computing and Internet of Things
Read this individual research paper free through the original publisher, or explore the full digital proceedings book.
ISBN 978-1-958651-49-0
Explore this ISBN in the AHFE Bookstore ↗Listed in the July 2026 bookstore catalogue; search by ISBN to confirm current availability · Digital book purchase optional