Johnell Brooks, Patrick Rosopa, Casey Jenkins, Jose D Villa, Elizabeth Perry, Patrik Schuler, Joshua Roper, Paul Riebe, Samuel Blankenship, Megan Gilstrap, Amanda Meldzuk, Matthew Morris, Rebecca Pool, Jackson Grant, Daniel Greco, Braden Hudgins, Tyler Warren, Kevin J Pritchett, William Cox, Todd Shealy, Frank Rice, Peioneti Lam, Linda De Simone, Edward Hennessy, Blake Mitchell (2025). The Impact of Four Field of View Conditions on Team Marksmanship Performance Using a Team Shooting Scenario (TSS) Task. In: Accessibility, Assistive Technology and Digital Environments. AHFE Open Access, vol. 162, pp. 211–221. https://doi.org/10.54941/ahfe1006028
The purpose of this study was to examine the influence of four field of view (FOV) conditions on three-person team’s marksmanship performance in terms of aiming time, accuracy, precision, and targets hit using a Team Shooting Scenario (TSS) task developed by the U.S. Army. Forty-eight soldiers from the South Carolina National Guard participated. The FOV restrictors included two monocular (41o and 78o) and two binocular (129o and 150o) restrictors. Soldiers were tasked with discriminating between distractors and threats (“T”), using the TSS’s 28 light boxes around a circle with a 15m diameter. Three of the four test variables were significantly different based on FOV condition; accuracy, precision, and hits significantly varied, while aiming time did not. For accuracy, the smaller the FOV, the better the performance. FOV was a statistically significant predictor of precision in the smallest and largest FOV conditions when using the quadratic effect where an inverted U-shape demonstrates greater precision. The greatest number of targets hit for both the linear and quadratic effects increase as FOV decreases. To provide guidance on optimal future head mounted devices needed for teams of soldiers during combat related tasks, it is critical to have team-based data to assess soldier performance and the effect of FOV on performance.
Improving soldier lethality continues to be a U.S. Army priority (Headquarters DOA, 2019a). For soldiers to be considered mission ready, they must demonstrate marksmanship competency (Headquarters DOA,
2019b). The importance of visual performance in soldier marksmanship is reflected in the Army’s long-standing requirement for visual acuity standards, which have been in place since World War II to ensure that soldiers possess adequate visual capabilities for effective marksmanship and combat readiness (Wells et al., 2009). Research has shown that an individual’s visual abilities have an impact on their marksmanship performance. Recent work from Lam et al. (2023) also found evidence that fireteams with higher central vision processing accuracy scores tend to have a higher probability of hitting targets.
The critical role of vision in marksmanship performance is evident in the military use of visual enhancement devices (e.g., sights, optics, and night vision devices), (Lam et al., 2023). To optimize the effectiveness of these technologies and determine the necessary requirements for soldier performance, it is essential to understand how key elements, such as field of view (FOV), can influence marksmanship performance.
The purpose of this study was to examine how FOV degradation impacts the marksmanship performance of small teams of soldiers, using the team shooting scenario (TSS) task developed by Brown et al. (2022). In this study, participants completed the TSS multiple times, wearing four FOV restrictors, which ranged from a maximum horizontal binocular 150
FOV to a minimum monocular 41
FOV. This type of research examining combat related tasks must be considered when providing recommendations for optimal horizontal visual field sizes for future head mounted devices.
METHOD
Participants The final number of soldiers included in the present study was 48. Three participants were excluded: two for FOV restriction outliers and one for lack of effort. Teams consisted of three soldiers. Teams with data for only one of the three team members were excluded. Missing or invalid data was typically due to equipment error. For the final data set, there were 149 teams. There were 124 teams with three team members’ data and 25 teams with two team members’ data.
Participants were recruited from the South Carolina National Guard. Participants included were predominantly males (6 females) between the ages of 19 and 57 years (M = 35.6, SD = 9.3) with a range of 2 to 39 years of service. There were 42 right-handed shooters, and 38 participants who were right-eye dominant. Thirty-three have been deployed ranging from one to seven deployments, with an average of 2.3 deployments (SD = 1.4). All participants completed a marksmanship training course and passed their most recent marksmanship qualification.
Research Design A one-way within-subjects design was used to examine the effects of the four levels of FOV restriction on team marksmanship performance. All participants completed the TSS in each of the four FOV conditions in a quasi-randomized order. The composition of each three-person team changed with each TSS task.
The Impact of Four Field of View Conditions on Team Marksmanship Performance 213
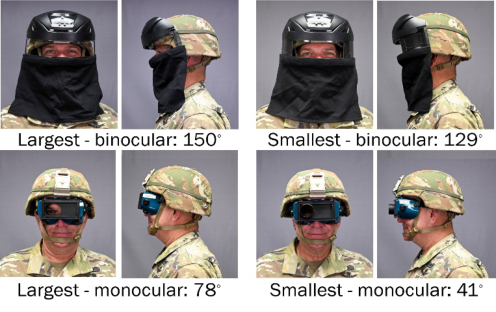
Field of View Restrictors Each participant used a set of four FOV restrictors which were selected to allow for a broad range of exploration while balancing the time and effort needed to complete the study. FOV ranged from a binocular, horizontal FOV of 150
similar to the Army’s sun, wind, and dust (SWD) goggles to a monocular 41
comparable to a single tube PVS-14 night vision device. See Figure 1 for images of the FOV restrictors and the participants’ mean FOV. An eye patch was worn on the non-dominant eye when participants used the monocular FOV restrictors.
Figure 1: The four FOV restrictors used in the study.
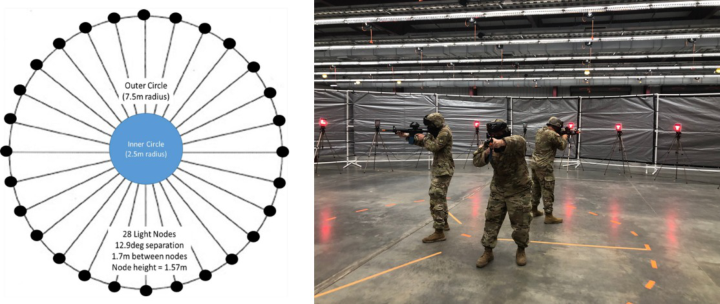
Team Shooting Scenario (TSS) Task The study used the TSS task as described in Brown et al. (2022). Described briefly, TSS uses an outer circle of 28 light box targets with a radius of 7.5 meters. Three participants stand within an inner circle; tape was used to make equal size sectors, one for each participant (see Figure 2). The light boxes display threats as a “T” while distractors are displayed as a “L” in different orientations.
Figure 2: A schematic of the TSS is presented on the left (courtesy of Brown et al., 2022) while a photo showing the set up and location of the study is on the right.
Weapon Simulation and Soldier Performance Measurement Participants used a de-militarized M4 carbine (rifle) with a LaserShot, Inc. CO2-operated recoil simulation system (lasershot.com) with a M68 close combat optic (CCO) mounted on the Picatinny rail. For additional technical information, please see research by Brown and colleagues’ (Brown & Mitchell, 2022; Brown et al., 2019; Brown et al., 2022).
Procedure After participants provided consent and completed a background questionnaire, a perimeter was used to measure participants’ baseline and horizontal FOV while wearing each of the four restrictors. Then, participants completed a high contrast Bailey Lovie acuity chart at 20 feet for screening purposes.
A team of three soldiers started at the experimenter’s table, donned the assigned FOV restrictor/helmet, collected their weapon, and after calibrating their weapon, walked to the circle where they selected one of the three firing sectors.
Performance Measures The number of targets shot at by each soldier varied. For each soldier’s attempt/shot aiming time, accuracy, precision, and hit were obtained.
Additional measures were computed for each soldier including mean aiming time, mean accuracy, mean precision, proportion hit (i.e., probability of hit), and the number of shots taken.
Aiming time was operationalized as the time in seconds it took for a soldier to move, detect, and position the weapon prior to engaging the target.
Accuracy was calculated as the Euclidean distance of a soldier’s shots from the center of the target in millimeters. A small value is better.
Precision represented the average distance between a soldier’s dynamic shots in mm (shot group dispersion or cluster tightness). Because participants were not instructed to use a controlled pair, the average distance across a soldier’s shots was computed with respect to the centroid of all shots that a soldier took. A small value suggests better precision (less dispersion). The larger the value suggests the soldier was less precise in their shots (more dispersion).
Hit: For each target shot at, a binary variable indicated whether a soldier hit the target (coded as 1) or did not hit the target (coded as 0).
Survey Measures After each team completed the TSS task with one FOV condition, surveys were completed individually, see Table 1. Only significant results are presented.
The Impact of Four Field of View Conditions on Team Marksmanship Performance 215
Table 1: Survey measures and definitions.
Table available in the original PDF paper.
Measure Definition Borg Rating of Perceived Exertion (RPE) (Williams, 2017) Choose the number that best describes your level of exertion on a scale of 6 (no exertion at all) to 20 (maximal exertion) Fatigue Indicate the intensity of fatigue during the previous event on a scale of 0 (least fatigue) to 10 (most fatigue) Stress Indicate the intensity of stress during the previous event on a scale of 0 (least stress) to 10 (most stress) Physical activity required
(Hart, 2006)
“How much physical activity was required (e.g., pushing, pulling, turning, controlling, activating, etc.)?” on a scale of 0 (very low) to 10 (very high) Mental & perceptual activity required (Hart, 2006)
“How much mental and perceptual activity was required (e.g., thinking, deciding, calculating, remembering, looking, searching)?” on a scale of 0 (very low) to 10 (very high) Time pressure (Hart, 2006)
“How much time pressure did you feel due to the rate or pace at which the tasks or task elements occurred?” on a scale of 0 (very low) to 10 (very high) Performance monitoring (Sellers, 2013)
“How much did the task require you to monitor your performance (i.e., ensure you were performing at specific levels)?” on a scale of 0 (very low) to 10 (very high) Task success (Hart, 2006) “How successful do you think you were in accomplishing the task?” on a scale of 0 (very low) to 10 (very high) Mental & physical demand (Hart, 2006)
“How hard did you have to work (mentally and physically) to accomplish your level of performance?” on a scale of 0 (very low) to 10 (very high) Frustration (Hart, 2006) “How frustrated (e.g., insecure, discouraged, irritated, stressed, and annoyed) versus satisfied (e.g., secure, gratified, content, relaxed, complacent) did you feel during the task?” on a scale of 0 (very low) to 10 (very high)
Data Analysis Prior to conducting analyses, the raw data were examined for errors and screened for outliers. There was no evidence of outliers. To analyze the data and account for the dependent nature of the observations, multilevel modeling was used. For all models involving shot level data, the soldier and the team each served as a random effect. The random effect for soldier accounted for the clustering of observations within each soldier. The random effect for team accounted for the clustering of soldiers within a team. To provide evidence of clustering, the null model was fit for each dependent variable and the intraclass correlation was computed.
Based on an examination of q-q plots as well as D’Agostino’s skewness test, numerous dependent variables had marginal distributions that were positively skewed. These variables were aiming time, accuracy, and precision. When these dependent variables were transformed using either a
square root or natural log transformation, the marginal distributions were normally distributed. Although the transformed variables were modeled using linear mixed models with a normal probability distribution, to facilitate interpretation in the Results section below, the predicted values were back- transformed to the original units (e.g., mm or seconds). Because hit was binary (i.e., 0 or 1), this variable was modeled using a linear mixed model with a binomial distribution. For all models, residuals were examined to ensure the tenability of the homoscedasticity assumption.
RESULTS
Descriptive statistics including means and standard deviations on the four main outcomes at shot level by FOV are shown in Table 2. Results are presented for each measure where the independent variable was FOV. For all models, we tested for linear and quadratic effects.
Table 2: Means and standard deviations on study variables by field of view.
Precision (mm) Hit 0.51 0.50 0.50 0.50 0.51 0.50 0.50 0.50 Note. n represents the number of shots per FOV condition.
Aiming Time There was no statistically significant effect of FOV on aiming time. Thus, the FOV manipulation did not affect soldiers’ aiming time within a team.
Accuracy The soldiers’ team mean accuracy ranged from 561 mm in the 78
FOV condition to 574 mm with a 41
FOV. The poorer performers skewed the 41
FOV condition; the mean is 574 mm while the median is 546 mm (difference of 27 mm). The difference between the mean and the median in the other three conditions are 9 mm for 78
, 5 mm 129
, and 18 mm for 150
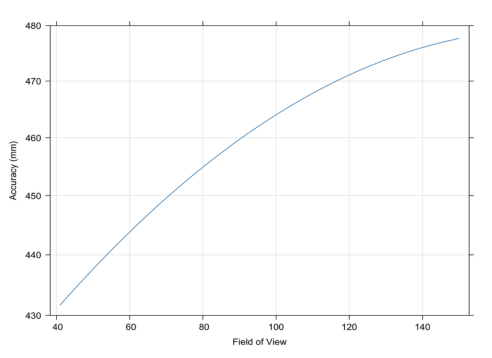
. FOV was a statistically significant predictor of accuracy (see Table 3). Although the quadratic effect was not significant, the linear effect was statistically significant. Figure 3 depicts this relationship. As FOV increased, accuracy within a team generally decreased.
* p < 0.1, * p < 0.05, ** p < 0.01, *** p < 0.001 Note: N = number of shot observations. TP = test participant. The number of teams was 149. Standard errors appear in parentheses beneath parameter estimate. The natural log transformation of accuracy and precision was modeled using linear mixed effects with a normal probability distribution. Linear mixed effects with a binomial distribution and logit link were used to model hit (1 = yes, 0 = no).
Figure 3: Team shooting scenarios: Effect of FOV on accuracy.
Precision Team mean precision scores ranged from 471 mm in the 129
FOV condition to 500 mm in the 78
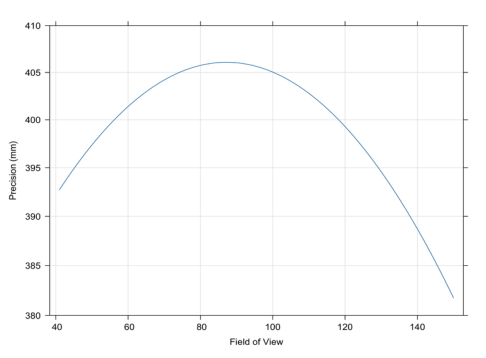
FOV condition. FOV was a statistically significant predictor of precision (see Table 2). In particular, although the linear effect was not statistically significant, the quadratic effect was statistically significant. Figure 4 depicts the inverted U-shape relationship between FOV and precision.
Figure 4: Team shooting scenarios: Effect of FOV on precision.
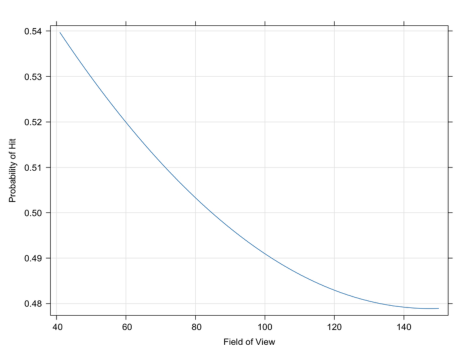
Hit Team mean likelihood to hit the target ranged from 51% in the 41
FOV condition to 49% in the 150
FOV condition. FOV was a statistically significant predictor of hit (see Table 2). Both the linear and quadratic effects were statistically significant. See Figure 5 to better understand the nature of the relation between FOV and hit.
Figure 5: Team shooting scenarios: Effect of FOV on probability of hit.
Survey Measures The summary statistics are presented in Table 4. The participant identifier served as a random effect in the multilevel models. Because FOV did not have a significant effect on control emotions, team communication required, team
The Impact of Four Field of View Conditions on Team Marksmanship Performance 219
coordination required, team time difficulty, team emotional demand, team performance monitoring, team support difficulty, and frustration with team, these variables are not discussed further.
Table 4: Means and standard deviations on TSS survey variables by FOV.
Table available in the original PDF paper.
41
78
129
150
Equation reproduced from the original PDF.
14.15 2.81 12.64 2.75 11.62 2.53 11.60 3.19
Variable M SD M SD M SD M SD BORG Perceived Exertion
Note. For all measures, a larger score indicates more of the construct.
Below, the survey measures where FOV had a statistically significant effect are reported. For all pairwise comparisons, Tukey’s honestly significant difference was used to control familywise Type I error rate at .05.
BORG Perceived Exertion - χ2 (3) = 108.81, p <.001. Perceived exertion was greater for 41
compared to 129
and 150
. Perceived exertion was greater for 78
compared to 129
and 150
.
Fatigue - χ2 (3) = 49.38, p <.001. Fatigue was greater for 41
compared to 129
and 150
. Fatigue was greater for 78
compared to 129
and 150
.
Stress - χ2 (3) = 90.44, p <.001. Stress was greater for 41
compared to 129
and 150
. Stress was greater for 78
compared to 129
and 150
.
Physical Activity Required - χ2 (3) = 68.07, p <.001. Physical activity required was greater for 41
compared to 129
and 150
. Physical activity required was greater for 78
compared to 129
and 150
.
Mental & Perceptual Activity Required - χ2 (3) = 85.31, p <.001. Mental and perceptual activity required was greater for 41
compared to 129
and 150
. Mental and perceptual activity required was greater for 78
compared to 129
and 150
.
Time Pressure - χ2 (3) = 57.50, p <.001. Time pressure was greater for 41
compared to 129
and 150
. Time pressure was greater for 78
compared to 129
and 150
.
Performance Monitoring - χ2 (3) = 8.40, p = .038. Performance monitoring was greater for 41
compared to 150
.
Task Success - χ2 (3) = 53.54, p <.001. Task success was lower for 41
compared to 78
, 129
, and 150
.
Mental & Physical Demand - χ2 (3) = 40.41, p <.001. Mental and physical demand was greater for 41
compared to 129
and 150
. Mental and physical demand was greater for 78
compared to 150
.
Frustration - χ2 (3) = 24.02, p <.001. Frustration was greater for 41
compared to 129
and 150
.
DISCUSSION
The soldiers’ accuracy and ability to hit the target was best in the smallest FOV, approximately 41
. However, the soldiers self-reported their highest levels of exertion, fatigue, stress, physical activity, mental and perceptual activity, time pressure, and poorest performance in this same condition. This paradox between observed and perceived performance may be due to soldiers being aware they are unable to see/sense their surroundings even though their focus on the target is maximized. This paradox needs further exploration since this study took place in ideal indoor conditions with full illumination, a comfortable temperature, a smooth concrete surface, free of hazards, not being under fire, etc. It may also be beneficial to explore performance with teams of two rather than three soldiers to fully explore the impact of the restricted FOVs where each soldier is required to cover a larger sector, thus increasing the need to communicate with one another to be successful. Marksmanship is the act of a soldier displaying their ability to put rounds where they are trying to put them. Warfare utilizes not only marksmanship but also communicating, moving, and surviving in ever changing environments. Dynamic scenarios such as the Team Shooting Scenario, provide soldiers the opportunity to practice incorporating these critical elements into their training. Feedback at the conclusion of each task can show soldiers their performance including any “friendlies” shot as well as missed targets who could have shot them. Multi-day training efforts or repeated exposure to training tools such as the Team Shooting Scenario which limits a soldier’s FOV should be explored to determine if, and when, soldiers adapt or adjust to smaller visual fields prior to being in combat environments.
CONCLUSION
This study aimed to examine the influence of four FOV conditions on a team’s marksmanship performance using the TSS task. 48 soldiers completed the TSS task while wearing each of the FOV restrictors, ranging from the maximum binocular 150
FOV to the minimum monocular 41
FOV. Performance results showed that accuracy, precision, and hits were significantly different based upon FOV, while aiming time was not. Survey results showed that the FOV conditions significantly impacted perceived exertion, fatigue, stress, physical activity required, mental and perceptual activity required, and time pressure. The findings of how a reduced FOV impacts team marksmanship performance should be taken into consideration when determining future head mounted device decisions; it is important
The Impact of Four Field of View Conditions on Team Marksmanship Performance 221
to balance soldiers’ objective and subjective results to maximize soldiers’ performance.
ACKNOWLEDGMENT
This work was supported by Clemson University’s Virtual Prototyping of Autonomy Enabled Ground Systems (VIPR-GS), under Cooperative Agreement W56HZV-21-2-0001 with the US Army DEVCOM Ground Vehicle Systems Center (GVSC) via funding from DEVCOM Soldier Center (Line of Effort BC2, Task 2 – Design Guidance for Headborne Systems).
DISTRIBUTION STATEMENT A. Approved for public release; distribution is unlimited. PR2025-2423
REFERENCES
Brown, S. A. T., Villa, J., Mitchell, K. B., Hussey, E. K., & Ramsay, J. W. (2019).
Simulated marksmanship performance methodology: Assessing lethality, mobility and stability during a military field training exercise. In: Cassenti D. (eds). Advs in Hum Factors Sim, 958, Springer, Cham. Brown, S. T. & Mitchell, K. B. (2022). Development of a fundamental and operational marksmanship score based on expert and novice marksmanship data. Brown, S., Lam, P., Christopher, J., Goodenough, R., Villa, J., Bode, V., &
Mitchell, K. B. (2022). A Novel Methodology for Evaluating Military Teamwork and Team Marksmanship Performance. Digital Human Modeling and Applied Optimization, 46, 53. Hart, S. G. (2006). NASA-task load index (NASA-TLX); 20 years later. In Proceedings of the human factors and ergonomics society annual meeting (Vol. 50, No. 9, pp. 904–908). Sage CA: Los Angeles, CA: Sage publications. Headquarters DOA. (2019a). Army modernization strategy: Investing in the future.
Washington, DC. Headquarters DOA. (2019b). Training and qualification – individual weapons. TC 3–20.4. Washington, DC. Lam, P., Villa, J., Christopher, J., Brown, S., Desimone, L., Elmore, W.,
Elkin-Frankston, S., Bode, V., & Mitchell, B. (2023). Evaluating the Effects of Visual Traits on Individual Marksmanship Performance in a Simulated Fireteam Engagement. Digital Human Modeling and Applied Optimization, 29. Sellers, J. M. (2013). Team workload questionnaire (TWLQ): Development and assessment of a subjective measure of team workload. Wells, K. H., Wagner, H., Reich, L. N., & Hardigan, P. C. (2009). Military
readiness: An exploration of the relationship between marksmanship and visual acuity. Military medicine, 174(4), 398–402. Williams, N. (2017). The Borg rating of perceived exertion (RPE) scale. Occupational medicine, 67(5), 404–405.
LISTED IN THE AHFE DIGITAL BOOKSTORE CATALOGUE
Explore the complete digital volume
Accessibility, Assistive Technology and Digital Environments
Read this individual research paper free through the original publisher, or explore the full digital proceedings book.
ISBN 978-1-964867-38-0
Explore this ISBN in the AHFE Bookstore ↗Listed in the July 2026 bookstore catalogue; search by ISBN to confirm current availability · Digital book purchase optional