Ji Yeon Kim, Ki Hwan Kim, Young Jin Kang, Seok Chan Jeong (2025). Underwater Fish length detection Using the AI-Based Depth Estimation. In: Intelligent Human Systems Integration (IHSI 2025): Integrating People and Intelligent Systems. AHFE Open Access, vol. 160, pp. 141–146. https://doi.org/10.54941/ahfe1005819
The scale of terrestrial aquaculture is steadily increasing compared to marine aquaculture. It is crucial to automatically observe and manage the growth process in terrestrial aquaculture facilities. However, the need to handle fish out of water to measure their size and weight can decrease their market value. This paper proposes the use of cameras to install underwater cameras for the automatic measurement of fish size, utilizing essential distance detection. This method allows for the relative estimation of the distance of fish underwater, where the pixel to meter approach is not feasible. It enables more accurate predictions of fish size by inferring the depth crucial to the pixel to meter calculation.
According to the Food and Agriculture Organization (FAO), global consumption of edible fish increased from approximately 130 million tons in 2011 to about 150 million tons in 2016, marking a 16.3% increase. During the same period, per capita sea-food consumption also rose from 18.5 kg to 20.3 kg, an increase of approximately 9.7%, indicating a growing demand for seafood (FAO, 2018). Notably, major aquaculture- leading nations like Norway have been early adopters of the industrialization and technologization of aquaculture, and more recently, have been pushing forward with the smartification of aquaculture through the application of ICT technologies (Chang, 2017). Consequently, energy costs constitute a significant portion of operational expenses in fish farming, prompting efforts to reduce these costs.
Terrestrial aquaculture technology has evolved over centuries, but technological research and development have progressed at a relatively slow pace. In this field, key challenges such as measuring the size of fish are being addressed by integrating the latest technologies. Research by Shi et al. (2020) presents a method for automatically measuring fish standard length non- intrusively using a stereo vision system implemented with LabVIEW, which greatly benefits the aquaculture industry. Shafait et al. (2017) developed
a semi-automatic measurement technique using stereo video technology, which saves time and costs compared to manual measurements and reduces measurement errors. Recent advancements in AI technology have enabled more diverse and complex measurements. Research by Ranftl et al. (2020) reports significant improvements in monocular depth estimation techniques through mixed training on various depth datasets and the development of a new loss function, enhancing generalization and accuracy. Additionally, Yang et al. (2024) have produced effective outcomes by combining depth estimation and semantic segmentation using semi-supervised learning techniques with unlabelled data. Yang et al. (2022) explains the differences in measuring the distance of objects underwater and in air using optical image sensors. The study highlights that due to differences in the refractive index underwater, objects appear larger than they are. This difference is a crucial factor to consider when capturing images in aquatic environments. The study analyses images taken underwater to confirm these differences, noting that with refractive indices of 1.0 in air and 1.33 underwater, objects appear approximately 3/4 closer than they actually are. This phenomenon significantly impacts the measurement of object size and distance underwater (Yang et al., 2022).
To correct these phenomena, this paper proposes a technical approach to reduce depth perception errors in objects during underwater photography. By considering the difference in refractive index in aquatic environments, a correction equal to the refractive index is applied to the estimated distance of each pixel. This correction process enables more accurate estimation of the size and distance of objects, providing essential information not only for measuring fish in aquatic environments but also for various underwater research and activities. Therefore, the aim of this paper is to accurately estimate the relative depth of fish in underwater environments, thereby improving the accuracy of object depth measurements. Experiments conducted in various aquaculture settings allow for the non-intrusive, real- time prediction of fish size.
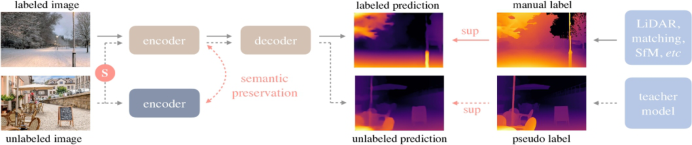
Experiments The Depth Anything model (Yang et al., 2024), as shown in Figure 1, presents a robust approach to monocular depth estimation using large- scale unlabelled datasets. As part of emerging foundational models in computer vision, this model is characterized by its ability to utilize unlabelled data without specific customization, employ a simple yet effective learning strategy, and effectively generalize joint learning of labelled and unlabelled data. It leverages approximately 62 million unlabelled images to expand data diversity and reduce generalization errors. This is crucial as acquiring large-scale labelled datasets for depth estimation can be cost-prohibitive and labour-intensive. The model uses auxiliary supervision techniques that inherit semantic prior knowledge from data augmentation and pre-trained encoders to enhance robust representation learning. This approach helps the model better handle unseen images by understanding advanced scene semantics. Consequently, Depth Anything trains in a self-learning manner
Underwater Fish Length Detection Using the AI-Based Depth Estimation 143
using labelled images and pseudo labelled images (synthetic labels) generated from unlabelled datasets. This method improves the model’s generalization capabilities across various scenes and conditions.
Figure 1: The diagram illustrates the “Depth Anything”(Yang et al., 2024) pipeline (see Figure 1). Solid lines represent the flow of processing for labelled images, whereas dotted lines indicate the flow for unlabelled images. The ‘S’ symbol signifies the addition of strong perturbations used in training models with different types of images and labels.
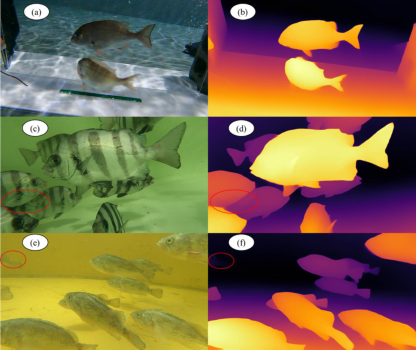
In an indoor aquaculture environment, various fish species and environmental settings were recorded using GoPro 8 monocular lens equipment. Figure 2 displays the results derived from employing the Depth Anything model to estimate depth values of images capturing three distinct fish species. While the results intricately capture the outlines of most fish and effectively represent varying depths based on the distance of the fish, several issues persist. In the second image, there is a region where fish overlap exquisitely, displaying boundaries too faint for fish detection. Moreover, in the third image, a fish located at the top right corner remains indistinguishable in the depth image. These instances illustrate the limitations of standard processing in scenarios characterized by severe object overlap and considerable distance variations.
Figure 2: Results of depth estimation for various fish in underwater environments using a monocular lens camera: (a) Configuration of an underwater studio setting, (b) Depth prediction results for the (a) image, (c) Aquaculture farm A environment (red circles indicate undetected fish), (d) Depth prediction results for the (c) image, (e) Aquaculture Farm B environment (red circles indicate undetected fish), (f) Depth prediction results for the (e) image.
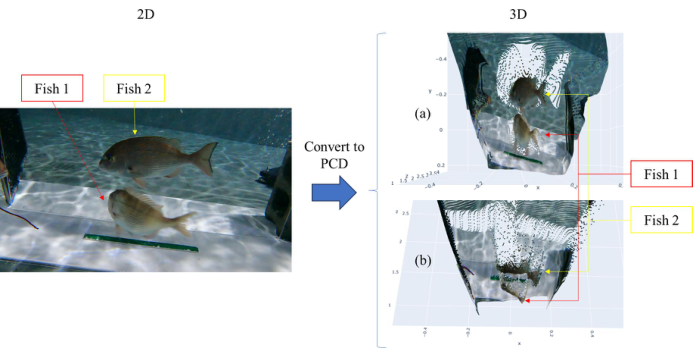
We utilized metric depth to perform Point Cloud Data (PCD) transformation of underwater fish images captured through a 2D monocular lens and assessed the accuracy. For the experiment, a bar set at 30 cm was placed at the bottom of the image to indirectly infer the size of the fish. The results, as shown in Figure 3, confirmed that the two fish appeared at different distances. Figure 3-a represents the PCD from the front view, while Figure 3-b depicts a view looking down vertically from the surface. Through Figure 3-b, we can see that the fish are positioned at different locations.
Figure 3: Changes in representation when converting 2D images of underwater fish to 3D PCD: (a) Frontal view based on the 3D PCD output, (b) Top view based on the 3D PCD output.
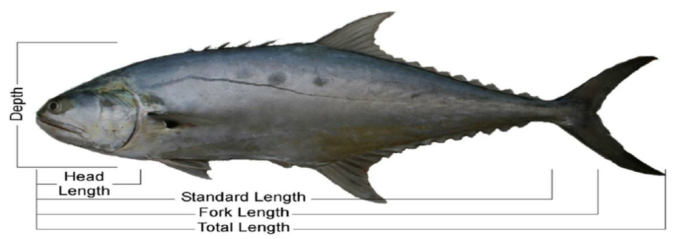
Standard length measurements were selected from the fish’s mouth to the mid-point of the tail fin based on the PCD results. Due to the inability of a monocular lens to accurately predict curved surfaces, the three-dimensional straight-line distance was calculated in terms of pixels per interval. Measuring the length of the fish from Fig. 3-b, it was possible to calculate relative distances as shown in Table 1. The final length measurements varied depending on the FL and the lengths along the x and y axes.
The Standard length from mouth to tail is calculated using Equation (1) as 0.1370 meters for Fish1 and 0.1858 meters for Fish2. Considering the difference in length due to refraction in water, by multiplying by a refractive index of 1.33, the final lengths are approximately 0.182 meters for Fish1 and 0.247 meters for Fish2. These measurements closely resemble the reference green stick of 30 cm. While direct physical contact to verify the sizes of the fish in the photos was not possible due to aquaculture farm conditions, taking into account that the average size of the fish in the aquaculture tank is about 24 cm, the average prediction error compared to the actual fish sizes is estimated to be around 10%.
Equation reproduced from the original PDF.
Underwater Fish Length Detection Using the AI-Based Depth Estimation 145
The body length from mouth to tail is calculated using Equation (1) as 0.1370 meters for Fish1 and 0.1858 meters for Fish2. Considering the difference in length due to refraction in water, by multiplying by a refractive index of 1.33, the final lengths are approximately 0.182 meters for Fish1 and 0.247 meters for Fish2. These measurements closely resemble the reference green stick of 30 cm. While direct physical contact to verify the sizes of the fish in the photos was not possible due to aquaculture farm conditions, taking into account that the average size of the fish in the aquaculture tank is about 24 cm, the average prediction error compared to the actual fish sizes is estimated to be around 10%. The purpose of this paper is to correct the standard length of fish based on their depth. Therefore, the standard length of the fish was calculated as the three-dimensional straight-line distance from the pixel representing the fish’s mouth to the central pixel of the tail fin, derived using Equation (1).
Table 1. Fish body length calculation: coordinate points and distance data.
Table available in the original PDF paper.
Fish X Y Z Distances Predict Length 1 Mouth −0.0977 0.1291 1.3186 1.5 0.1858*1.33 = 0.247114 Tail 0.0834 0.1704 1.3246 2 Mouth −0.0633 −0.0700 1.1910 1.2 0.1370*1.33 = 0.18221 Tail 0.0584 −0.0757 1.1283
Figure 4: Method and location for measuring the standard length of fish.
CONCLUSION
In smart aquaculture, optimal growth management and production forecasting significantly aid farm operations by reducing cultivation costs and adjusting shipping times. With AI-based systems capable of calculating fish body length, it becomes possible to deploy automated systems that determine the optimal time for shipment based on monitoring environments. However, for underwater imaging, the resolution varies greatly depending on the water quality, necessitating distance corrections even when 2D data is available to calculate fish height and length. Additionally, algorithms capable of accessing depth values are required for calculating weight.
In smart aquaculture, optimal growth management and production forecasting directly facilitate the reduction of cultivation costs and the timing of shipments, thereby aiding farm operations significantly. Particularly, the technology to estimate fish size and weight through underwater imaging is essential. With AI-based techniques to calculate fish standard length and estimate weight, it becomes possible to avoid the labour-intensive tasks of manually removing fish to check their size and weight. Instead, an automated system could be implemented in a monitoring environment to determine the optimal time for shipment. However, to integrate AI technology, it is indispensable to have a system for viewing underwater images in the farm and data for AI training in place beforehand. Given the variable resolution of underwater images depending on water quality, 2D data can be used to calculate fish standard length, but corrections based on distance are necessary. Additionally, an algorithm capable of accessing depth values is required for accurate weight estimation.
ACKNOWLEDGMENT
This work was supported by Innovative Human Resource Development for Local Intellectualization program through the Institute of Information & Communications Technology Planning & Evaluation (IITP) grant funded by the Korea government (MSIT)(IITP-2025-RS-2020-II201791).
REFERENCES
Chang, Y. (2017). Analysis of promising sectors in the aquaculture industry. Korea Maritime Institute. FAO, “2018 the state of world fisheries and aquaculture,” 2018. pp. 2–5. Ranftl, R., Lasinger, K., Hafner, D., Schindler, K., & Koltun, V. (2020). Towards
robust monocular depth estimation: Mixing datasets for zero-shot cross-dataset transfer. IEEE transactions on pattern analysis and machine intelligence, 44(3), 1623–1637. Shafait, F., Harvey, E. S., Shortis, M. R., Mian, A., Ravanbakhsh, M., Seager, J. W.,...
& Edgington, D. R. (2017). Towards automating underwater measurement of fish length: A comparison of semi-automatic and manual stereo–video measurements. ICES Journal of Marine Science, 74(6), 1690–1701. Shi, C., Wang, Q., He, X., Zhang, X., & Li, D. (2020). An automatic method of fish length estimation using underwater stereo system based on LabVIEW. Computers and electronics in agriculture, 173, 105419. Yang, H., Tian, S., Fan, J., Han, Y., Zhou, C., & Ou, Y. (2022). A precise
calibration method for the underwater binocular camera with unknown refractive index. IEEE Sensors Journal, 23(2), 1565–1574. Yang, L., Zhuo, W., Qi, L., Shi, Y., & Gao, Y. (2022). St++: Make self-training work better for semi-supervised semantic segmentation. In Proceedings of the IEEE/CVF conference on computer vision and pattern recognition (pp. 4268–4277). Yang, L., Kang, B., Huang, Z., Xu, X., Feng, J., & Zhao, H. (2024). Depth
anything: Unleashing the power of large-scale unlabeled data. arXiv preprint arXiv:2401.10891.
LISTED IN THE AHFE DIGITAL BOOKSTORE CATALOGUE
Explore the complete digital volume
Intelligent Human Systems Integration (IHSI 2025): Integrating People and Intelligent Systems
Read this individual research paper free through the original publisher, or explore the full digital proceedings book.
ISBN 978-1-964867-36-6
Explore this ISBN in the AHFE Bookstore ↗Listed in the July 2026 bookstore catalogue; search by ISBN to confirm current availability · Digital book purchase optional