Jonas Stehlin, Aaron Häusler, Kordian Caplazi, Andreas Kunz (2024). Geospatial Positioning Using a Smartphone and the MS HoloLens. In: Human Systems Engineering and Design (IHSED2024): Future Trends and Applications. AHFE Open Access, vol. 158, pp. 165–174. https://doi.org/10.54941/ahfe1005540
During excavations, very often underground facilities are damaged, as shown in a statistics from the U.S. From all these damages, more than 36% were because of locating problems. This paper thus introduces a system that relies on Google Street View geospatial data to determine the precise position for excavation work. The visual surrounding is captured by a smartphone using Google’s ARCore and Visual Positioning System (VPS). Google’s VPS transforms the camera data into a local point cloud. Concurrently, the rough location of the smartphone is found using its GPS. This location is necessary to determine which section of the global point cloud (based on Street View data) has to be compared to the local point cloud. This comparison yields an accurate position and orientation of the smartphone. A QR code with the positional data encoded is displayed on the screen. It has to be scanned with the MS HoloLens 2 (HL2). By doing so, the HL2 is able to determine the smartphone’s position and orientation relative to itself. In combination with the information decoded from the QR code the HL2 can calculate its global position and orientation. With the positional data available on the HL2 the information of the underground facilities can be displayed. The plans are moved to the correct position, and rotated to match the orientation of the HL2. To evaluate this new system it was compared with a system based on real-time kinematics (RTK) in real-life situations. Leica’s FLX 100 plus in combination with refnet’s reference service was used to set up the RTK calibration system. With Leica’s Zeno Connect smartphone app the FLX 100 plus was connected to the reference service. An additional app was used to transfer the positional data via Bluetooth to the HL2. Both systems were examined regarding accuracy and precision under different conditions. The tolerance of the Swiss cadastral system (± 150 mm) was chosen as a reference value. To measure the deviation of the results from the real value, national and cantonal fixpoints were used. These are marked by bolts in the ground and their accuracy is < 10 mm. In order to find the offset of the rotation 5 m lines were drawn in the test plans along the edge of the sidewalk. The deviation was measured by aligning the plans correctly, the errors were equal to the displacement needed. The RTK method performed well in open areas, where almost all results under the reference value of ± 150 mm. In densely built-up areas the accuracy ranged from 1.26 - 8.66 m, and the precision from 4.41 - 13.1 m. The method with Google’s Geospatial API and only a smartphone achieved an accuracy of 0.21 to 0.43 m and a precision of 1.28 - 2.26 m in open areas. In densely built-up areas the accuracy was 0.28 - 0.36 m, and the precision 0.22 - 0.28 m. In these tests no impact due to the age of the Street view data was noticeable.
During excavations, very often underground facilities are damaged, as shown in a statistics from the U.S. (CGA, 2023), with an increasing trend in particular for telecommunication cables. From all these damages, more than 36% were because of locating problems. A comprehensive survey on how to reduce underground damage is given in Al-Bayati & Panzer (2019). For these location problems, the major reasons are: (i) lack of training, (ii) missing or wrong data, (iii) markers get obscured or disappear during construction, and (iv) location equipment limitations (Al-Bayati & Panzer, 2020). Besides these shortcomings, another important source of error is the “lack of clear communication between locators and excavators”(Al-Bayati et al., 2020). To encounter these problems, several technical solutions have been researched, which will be summarized in the next chapter.
RELATED WORK
Most of the proposed approaches try to improve the map of underground utilities by employing a ground penetration radar (GPR) and measuring the radar’s position with the global positioning system (GPS). The data is then integrated in a map, in which also the excavator’s position is known
(Tanoli et al., 2019). The accuracy of the GPS is improved using a real-time kinematics (RTK) module. To improve the communication to the excavator, the merged map is directly mapped in the machine cabin (Schreiber et al., 2008). To further avoid damaging underground utilities, magnetic sensors were also connected to the bucket, but an on-site test is missing (Kim et al., 2022). To improve the visibility of underground infrastructure, the maps were not just displayed on a screen in the cabin, but also to other on-site personnel using augmented reality devices such as the MS HoloLens (Behzadan & Kammt, 2009). These approaches were later commercialized e.g., by vGIS (vGIS, 2023) or Trimble (Trimble, 2023). However, all existing approaches need additional receivers for GPS and/or RTK data, which is an additional financial effort and requires additional training of the workers.
This paper thus introduces a novel approach that is based on Google’s ARCore Geospatial API and a newly developed Android application. The rough position is determined using the smartphone’ s GPS position, and the more precise position is determined by the surroundings with the smartphone. The collected data is then compared to a point cloud calculated from Google StreetView data. This comparison provides the accurate position of the smartphone, which is encoded in a QR code. The HoloLens 2 (HL2) scans the QR code to obtain necessary data for the correct placement of plans for underground utilities.
The following chapters describe the technical realization of the system, followed by an accuracy comparison to an RTK system. The remainder of the paper then gives a summary and an outlook on future work.
SYSTEM SETUP In our research, we aim to evaluate the performance of a traditional RTK device-based method against our innovative strategy, which utilizes Google’s ARCore platform (Google ARCore, 2023). To achieve this, we have implemented both the conventional RTK-based system and our newly developed vision-based positioning system, named VisionGeo AR.
RTK Positioning Most of the existing geospatial positioning systems for outdoor usage rely on regular GPS data, which is further refined with a real-time kinematics (RTK) device (Wiki Echtzeitkinematik, 2023) to reach an accuracy of down to 20 mm. The system requires a base station, from which the position is precisely known. Both, the base station as well as a mobile station measure the GPS signal. The base station now compares its well-known position with the positional information from the GPS system, calculates the difference, and sends this difference information to the mobile device as a correction factor. The closer the mobile device is to the base station, the more precise the results will be. In our case, we rely on terrestrial base stations, and we access the correction data through refnet service (Refnet, 2023). To receive correction data from refnet, the RTK device needs an Internet connection, which is typically provided by a smartphone. The smartphone also provides
Geospatial Positioning Using a Smartphone and the MS HoloLens 167
the Internet connection to the HL2, which should display the underground facilities at the measured location.
The smartphone communicates with the RTK device via Bluetooth, while the connection to the HL2 is done through an FTP connection. Once the connection between the RTK device and the smartphone is established, the positional data (longitude, latitude, and altitude) is transferred using the standardized NMEA protocol (National Marine Electronics Association, 2023). Using the FTP connection, this geospatial position is transferred to the HL2 as well as the preprocessed data of the underground facilities. Within the HL2 app, a suitable map from the Geo Information System (GIS) can be selected, followed by a calibration of the HL2’s position and orientation. The GIS data is modelled in Unity, and also the calibration data is stored here.
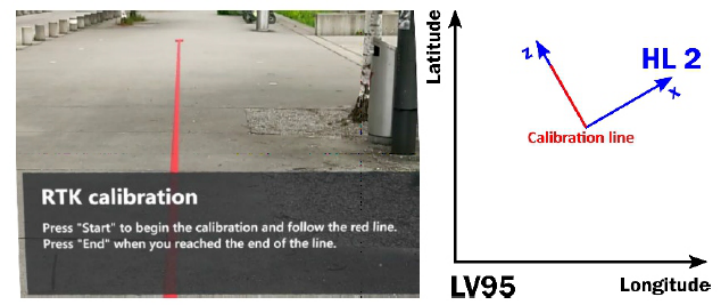
To correctly display the underground facility data on the HoloLens, its coordinate system must be mapped to the one being used in the RTK device, which is in our case the LV95 coordinate system (Bundesamt für Landestopografie Swisstopo 2023). The calibration process is required to map the HL2’s coordinate system (stemming from Unity) to the LV95 system. For doing so, the user is instructed to walk along a straight line that is displayed in the HL2 and which is parallel to the z-axis of the HL coordinate system (see Figure 1). While walking, the RTK device collects positional data. The geospatial data coming from the RTK device contains the positional information in the WGS84 format (National Geospatial- Intelligence Agency, 1984), which is a worldwide-used coordinate system for positional information. Since the used GIS data is available for the LV95 format only, the WGS84 also has to be converted to the LV95 format using the REFRAME library from Swisstopo (Swisstopo 2023).
Figure 1: Calibration process of the HoloLens.
The RTK data as well as the HL2’s positional data are stored in a list, consisting of n pairs of RTK and HL data. In a first step, all measurements from the HL will be filtered out, whose x-values deviate by more than 200 mm from the calibration line. In a subsequent step, also the RTK data is
refined. Using a pair of coordinates of this data set, the slope is calculated (Eq. 1): ; for i, j = {1, 2, . . . , n} and i̸ = j m1, m2, . . . , mk
Equations and mathematical formulas are available in the original paper PDF.
(1) From this number of slopes (as well as from the coordinates of the individual measurement points), the median value is calculated (see Eq. 2), since it is less sensitive to outliers compared to a mean value.
ml + ml + 1
ml + 1 for odd n = 2l + 1 1 2 From em, g Lat, and ] Long, the latitude axis segment LatOTS is calculated (Eq. 3):
g Lat −f m ] Long
(3) All measurement points whose latitude values are further away than 500 mm will be deleted (Eq. 4).
Lati −
em Longi + LatOTS In the next step, a straight line calibration is calculated using the least squares method. First, the mean values Long and Lat are calculated (Eq. 5), and from this the slope m (Eq. 6) and the latitude axis segment (Eq. 7).
n X
n X
Lati (5)
2 (6)
Pn
i −n Long
Now, another filtering takes place: All latitude values that deviate by more than 400 mm from the calculated one will be deleted (Eq. 8).
mLongi + Lat0
Lati −
< 400 mm for i = {1, 2, ..., n} (8) However, since measurements were deleted now, the calibration line has to be recalculated. This will be done in an iterative way until no outliers are removed anymore. Having this calibration line in place now, the rotation angle γ (see Figure 1) between the LV95 and the HL2 coordinate systems can be calculated (Eq. 9).
m xn
xn
In a final step, it has to be taken into account that the origins of the LV95 and the HL2 coordinate systems still do not match. Thus, the HL2 coordinate
Geospatial Positioning Using a Smartphone and the MS HoloLens 169
system will be shifted together with the aforementioned rotation. This will be done using homogeneous coordinates (Eq. 10).
[Equation or mathematical symbol available in the original paper PDF]
[Equation or mathematical symbol available in the original paper PDF]
[Equation or mathematical symbol available in the original paper PDF]
[Equation or mathematical symbol available in the original paper PDF]
[Equation or mathematical symbol available in the original paper PDF]
[Equation or mathematical symbol available in the original paper PDF]
[Equation or mathematical symbol available in the original paper PDF]
[Equation or mathematical symbol available in the original paper PDF]
cos (−γ ) 0 −sin (−γ )
−γx
[Equation or mathematical symbol available in the original paper PDF]
[Equation or mathematical symbol available in the original paper PDF]
[Equation or mathematical symbol available in the original paper PDF]
[Equation or mathematical symbol available in the original paper PDF]
0 1 0 sin (−γ ) 0 cos (−γ )
0 −γz
0 γLat
[Equation or mathematical symbol available in the original paper PDF]
[Equation or mathematical symbol available in the original paper PDF]
[Equation or mathematical symbol available in the original paper PDF] (10)
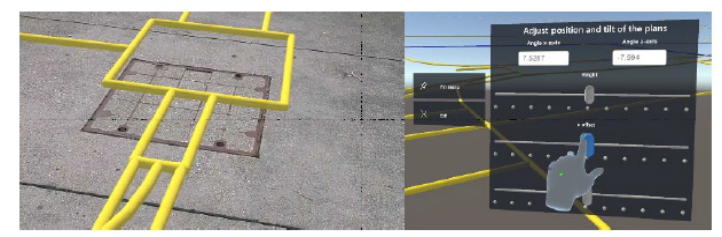
0 γlat + sin (γ ) γx −cos (γ ) γz After the calibration, the visualization of the underground facilities will match the real environment. However, due to measurement errors it might happen that the visualization is off the real position of up to 200 mm the the x- and z- coordinates. In this case, a manual readjustment is also possible based on visible real objects (see Figure 2).
Figure 2: Manual adjustment after the calibration process.
While this measurement procedure is working in principle, it might have its downsides in the relatively high price of the RTK device, and in the reduced accuracy in densely built-up areas. Thus, an alternative approach is based on StreetView data and Google’s Geospatial API.
Geospatial API Positioning For this new positioning method, the Geospatial API as part of Google’s ARCore was used (Google Geospatial, 2023). Once the ARCore is activated (Google Explore, 2023), it has to be authorized to call the Visual Positioning System (VPS). Then, the spatial positioning can be started.
First, the regular GPS signal is used to determine the relevant data set from Google StreetView, with which the images taken by the smartphone will be compared. The StreetView data set consists of a huge point cloud that was generated by a neural network on images taken in the street. The neural network was trained in such a way that it determines elements that do not change over a longer period of time, thus in particular buildings. The image taken by the smartphone’ s camera is now also converted to a point cloud and compared to the VPS model. Once a match is found, the Geospatial API calculates position and orientation of the smartphone that has taken this
specific image. The geospatial information is then stored in a geospatial pose, which can be accessed. For taking a picture, an app as shown in Figure 3 was developed.
Figure 3: Manual adjustment after the calibration process.
Figure available in the original PDF paper.
The screen of this app is split in two parts. In the upper part, the QR code will be shown, which can be scanned by the HL. If the position is not determined yet, “Localizing” will be displayed instead of the QR code. In the lower part of the screen, the camera stream is visualized to show the user which real environment he is currently taking a picture from. In addition, three buttons are displayed. The button “Horizontal acc.” defines a threshold value that has to be reached before the QR code is shown. Pressing the “Submit”button confirms the entered threshold value. The same principle applies for the button “Angular acc.”, which allows defining the angular threshold value. The button “Mode” toggles between determining the angle from “Geo” (Geospatial API) and “Mag” (internal magnetometer & accelerometer).
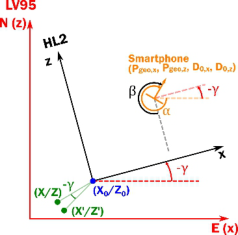
While the transformation from HL2 to LV95 coordinates was already discussed, a second coordinate transformation is required now for the coordinates stemming from the smartphone (see Figure 4).
Figure 4: Coordinate transformation from the smartphone to the HL2.
First, the angle γ needs to be calculated based on the angle α that is measured by the smartphone. β is the angle that is measured
Geospatial Positioning Using a Smartphone and the MS HoloLens 171
counterclockwise from the negative z-axis of the HL2 coordinate system to the facing direction of the smartphone. Thus, the angle γ is γ = α−β −90
. With this angle γ , the measure smartphone’s position Pgeo,x, Pgeo,z: in the LV95 coordinate system, as well as the distances D0,x, D0,z between smartphone and HL, the position of the HL in the LV95 coordinate system can be calculated by Eq. 11:
cos (γ ) −sin (γ )
+ sin (γ ) cos (γ )
Pgeo, x Pgeo, z
X0 Z0
−D0,x −D0,z
Comparative Measurements of Both Systems The two systems were evaluated regarding accuracy and precision. Accuracy describes how close the measured values are to a real value, while precision describes how close measured values are to each other. The two systems are compared under two environmental situations: density built-up areas and open areas. The results are shown in Table 1.
Table 1. Comparison of the RTK-based system and the Geospatial App under different environmental situations. Two measurement values are given for each condition, taken at different locations.
Table available in the original PDF paper.
Densely built-up areas Open areas Accuracy [m] Precision [m] Accuracy [m] Precision [m]
The results show that the RTK system has accuracy and precision issues in density built-up areas, since the measured values are clearly above the values given by an external geodetic reference that allows for a tolerance of T = 0.15 m in horizontal direction. The measurement error potentially comes from shadowing effects and multipath propagation of the radio waves, since the results become significantly better in open areas. The Geospatial App on the other hand performs well in density built-up areas, since many visual features exist in the environment.
The Rover RTK system, while struggling with accuracy and precision in densely built-up areas, significantly improves its performance in open areas. This improvement suggests that the RTK system’s limitations in urban environments are primarily due to obstructions and multipath effects, which are less prevalent in open spaces. Such findings highlight the importance of considering environmental factors when deploying RTK-based positioning solutions, especially in urban planning and construction projects where precision is paramount.
Conversely, the Geospatial App demonstrates robust performance in densely built-up areas, benefiting from the rich visual cues that these environments provide. This advantage makes it particularly suited for
applications requiring high levels of accuracy and precision in urban settings, such as augmented reality (AR) experiences, urban navigation, and location- based services. However, its performance in open areas, while still within acceptable ranges, indicates potential challenges when visual features are sparse, affecting the system’s ability to maintain high levels of precision.
This comparative study underscores the complementary nature of the RTK and Geospatial App systems, suggesting a potential for hybrid approaches that leverage the strengths of each under different environmental conditions. Such an integrated system could dynamically switch between or combine data from both technologies, optimizing accuracy and precision across a broader range of environments. This approach could offer significant benefits for a wide array of applications, from autonomous vehicles and drones to environmental monitoring and smart city infrastructure development, ensuring optimal performance regardless of the operational context.
SUMMARY AND OUTLOOK This paper unveils a cutting-edge geospatial application that leverages Google StreetView imagery to determine the precise location and orientation of a smartphone. This process involves identifying specific environmental visual markers and encoding this spatial data into a QR code. When this code is scanned by the HoloLens 2 device, it triggers the display of underground utilities as an augmented reality overlay on the user’s actual environment. Comparative analysis reveals that this novel approach surpasses traditional RTK systems in accuracy, particularly within urban areas characterized by high building density. Further, the research will explore enhancing the system’s geolocalization accuracy by engaging in the scanning of additional identifiable features within the environment and refining the data through interpolation methods. This next phase of development promises to further elevate the application’s utility in complex urban landscapes.
Expanding upon this, the significance of this research lies not only in its immediate application but also in its potential to set new standards for urban geospatial technologies. The application’s adeptness at navigating densely populated areas opens a realm of possibilities for urban planning, emergency response, and infrastructure management, where traditional systems often falter due to the complex interplay of buildings and signals. By harnessing the ubiquitous and regularly updated Google StreetView database, the application ensures that its visual markers are both accessible and current, offering an adaptive solution that keeps pace with the changing urban fabric.
Moreover, the integration of QR codes and augmented reality technology presents an innovative method of data visualization and interaction, enhancing user engagement and comprehension. This method not only simplifies the complex data associated with underground facilities but also makes it directly actionable for professionals in the field, ranging from construction workers to city planners.
As future research focuses on refining the accuracy and reliability of this system, there is potential for broadening its application beyond urban environments. Exploratory work could extend its utility to rural or
Geospatial Positioning Using a Smartphone and the MS HoloLens 173
undeveloped areas where traditional mapping and positioning services are less accurate or entirely unavailable. Additionally, the scalability of this technology could see it adapted for various other uses, such as environmental monitoring, disaster management, and augmented reality gaming, offering a versatile platform for a wide range of applications.
In conclusion, this geospatial application marks a promising advancement in the field of location-based services. By aiming to enhance accuracy and usability within challenging urban environments, it contributes to refining existing methodologies and potentially opens avenues for inventive applications across various industries and disciplines.
REFERENCES
Al-Bayati, A. J., Panzer, L. (2019). “Reducing Damage to Underground Utilities: Lessons Learned from Damage Data and Excavations in North Carolina”, in: Journal of Construction Engineering and Management, Vol. 145, No. 12, pp. 04019078–1–04019078–8. Al-Bayati, A. J., Panzer, L. (2020). “Reducing Damage to Underground Utilities:
Importance of Stakeholders’ Behaviors”, in: Journal of Construction Engineering and Management, Vol. 146, No. 9. Al-Bayati, A. J., Panzer, L. and Kaddoura, K. (2020) “Minimizing Underground Infrastructure Damage: Utility Locators’ Perspectives”, in: Pipelines, pp. 387–391. Behzadan, A. H., Kammt, V. R. (2009) “Interactive Augmented Reality Visualization for Improved Damage Prevention and Maintenance of Underground Infrastructure”, in: Proceedings of Construction Research Congress, pp. 1214–1222; 2009 Bundesamt für Landestopografie Swisstopo (September 8, 2023), Landesvermessung
LV95, https://www.swisstop.admin.~CH/de/wissen-fakten/geodaesie-vermessun g/bezugsrahmen/local/lv95.html. Common Ground Alliance (December 12, 2023), https://commongroundalliance.c om/dirt-dashboard. Google ARCore (September 7, 2023), Overview of ARCore and supported development environments, https://developers.google.com/ar/develop Google Explore (September 7, 2023), Explore the Geospatial API for your Android
app (Kotlin/Java), https://developers.google.com/ar/develop/java/geospatial/ enable. Google Geospatial (September 7, 2023), Build global-scale, immersive, locationbased AR experiences with the ARCore Geospatial API, https://developers.goo gle.com/ar/develop/geospatial. Kim, J., Ham, Y. and Park, H. (2022) “Underground Metal Pipelines Localization
using Low-cost Wireless Magnetic Sensors Mounted on an Excavator”, in: IEEE Transactions on Industrial Electronics, Vol. 69, No. 10, pp. 10474–10683. National Geospatial-Intelligence Agency, (September 8, 2023), “World Geodetic System 1984 (WGS 84)”, https://earth-info.nga.mil/index.php?dir=wgs84&acti on=wgs84. National Marine Electronics Association (July 16, 2023), NMEA 2000 Standards,
https://www.nmea.org/nmea-2000.html. Refnet (July 16, 2023), “Home”; https://www.refnet.ch. Schreiber, F., Rausch, P. and Diegelmann, M. (2008), “Use of a Machine Control & Guidance System, Determination of Excavator Performance, Cost Calculation and Protection Against Damaging of Pipes and Cables”, in: Proceedings of the 1st International Conference on Machine Control & Guidance, pp. 21–30.
Swisstopo (July 16, 2023), “Entwickler-Ressourcen (DLL/JAR)”, https://www.swis stopo.admin.ch/de/geodata/applications/geosoftware/dll.html. Tanoli, W. A., Sharafat, A., Park, J. and Seo, J. W. (2019), “Damage Prevention for
Underground Utilities using Machine Guidance”, in: Automation in Construction, Vol. 107; paper 102893. Trimble Site Vision (December 3, 2023), https://sitevision.~Trimble.com. vGIS (December 3, 2023), https://www.vgis.io. Wikipedia, (October 1, 2023), “Echtzeitkinematik”, https://de.wikipedia.org/wiki/ Echtzeitkinematik.
LISTED IN THE AHFE DIGITAL BOOKSTORE CATALOGUE
Explore the complete digital volume
Human Systems Engineering and Design (IHSED2024): Future Trends and Applications
Read this individual research paper free through the original publisher, or explore the full digital proceedings book.
ISBN 978-1-964867-34-2
Explore this ISBN in the AHFE Bookstore ↗Listed in the July 2026 bookstore catalogue; search by ISBN to confirm current availability · Digital book purchase optional