Peter Roessger, Cristi Acevedo, Miriam Bottesch, Samuel Nau, Tobias Stricker, Frederik Diederichs (2024). The Rolling Robot and the Human Brain: Handover of the Driving Task in Automated Vehicles. In: Human Interaction and Emerging Technologies (IHIET 2024). AHFE Open Access, vol. 157, pp. 84–93. https://doi.org/10.54941/ahfe1005467
The automation of driving represents a pivotal innovation in vehicular technology, transitioning from automating secondary and tertiary tasks such as ignition, gearboxes, and rain sensors, to automating the core driving procedures. This redefinition of the driving process fundamentally alters the human-machine interface (HMI) and vehicle interiors. Ensuring safe driving, vehicle usability, and a positive user experience necessitates clear delineation of responsibilities between human and machine drivers.In a laboratory study with 20 participants (55% female, 45% male, ages 20-59) with varying experience in advanced driver assistance systems (ADAS), four handover procedures were evaluated for understandability and user experience. The study comprised two parts: testing the comprehensibility of animated icons and a comparative analysis of four handover procedure designs. Icon sets differed in their representation—one holistic and the other detailed—and varied in their display strategy and location.Data were collected via direct questioning, the Net Promoter Score (NPS), the meCUE user experience questionnaire, design rankings, and open interviews. Results indicated a preference for detailed icons over holistic ones. The most favored handover procedure featured a centrally located, single detailed icon representing the current activity, leading to superior scores in NPS, meCUE, and overall ranking. Interview feedback highlighted preferences for clarity, simplicity, and central icon placement. Younger participants favored animated icons with bubble effects, while older participants preferred simpler designs. These findings underscore the importance of user-centric design in automated driving systems.The study was performed during the KARLI project funded by the German Ministry of Economy.
Automation stands as one of the pivotal megatrends reshaping automobility. Over the years, automation has seamlessly integrated into the fabric of automotive technology, manifesting in innovations such as automated ignition systems, automated gearboxes, electric window lifters, and rain sensors. Each of these advancements has incrementally enhanced the driving experience, contributing to the ongoing evolution of vehicles.
In recent years, the scope of automation has broadened significantly, leading to a transformative redefinition of the relationship between drivers
The Rolling Robot and the Human Brain: Handover of the Driving Task 85
and their vehicles. Modern automation trends are poised to modify the core interaction between humans and what can be seen as rolling robots: the driving procedure itself. This profound shift bears significant implications for the Human-Machine Interface (HMI), as well as the overall usability and user experience (UX) within vehicles.
Recognizing the critical need to understand these implications, the KARLI project was initiated. Within the framework of this project, we conducted a comprehensive UX study to evaluate the comprehensibility of icons and the acceptance of various interaction procedures. A primary focus of our investigation was the handover process of the driving task from the driver to the automated system. This aspect of automation is particularly crucial, as it directly influences driver trust and the overall safety of automated driving systems.
The study aimed to identify which design of the handover procedure garnered the highest acceptance among users. By meticulously analyzing user feedback and interaction data, we sought to pinpoint the most effective design elements that facilitate a smooth and intuitive transition of control. The insights gained from this study are set to be integrated into the final version of the KARLI HMI, ensuring that the system meets high standards of usability and user satisfaction.
This paper presents the methodology, findings, and implications of our study, contributing valuable knowledge to the ongoing discourse on automotive automation and HMI design. Through this research, we aim to advance the development of user-friendly automated driving systems that enhance both safety and the driving experience.
KARLI is a project funded by the German BMWK (Bundesministerium für Wirtschaft und Klimaschutz, Federal Ministry of Economy and Climate Protection). The objective of the KARLI project is to create an adaptive, responsive, and compliance-oriented interaction system for future vehicles (Diederichs et al., 2022, KARLI, 2024). In pursuit of this goal, KARLI is developing AI functions that are relevant to customer needs. These functions aim to identify driver states and formulate interactions tailored to various levels of automation.
In the work package “Level compliant behavior”KARLI aims to assess the driver’s state, behavior, and likely ability to act is derived from the present driving scenario, which includes considerations of the level of automation. Part of this is the development of HMI solutions for save handovers between vehicle and driver.
BACKGROUND
In the context of partial automation, there is a division of tasks between the human driver and the automated vehicle. This paper adopts the levels of automated driving as defined by SAE J3016 (SAE, 2021). At Level 0 (no driving automation) and Level 5 (full driving automation), the driving task is exclusively performed by either the human driver or the automated system, respectively. However, at Levels 1 through 4, the driving responsibilities are shared between the driver and the automated system.
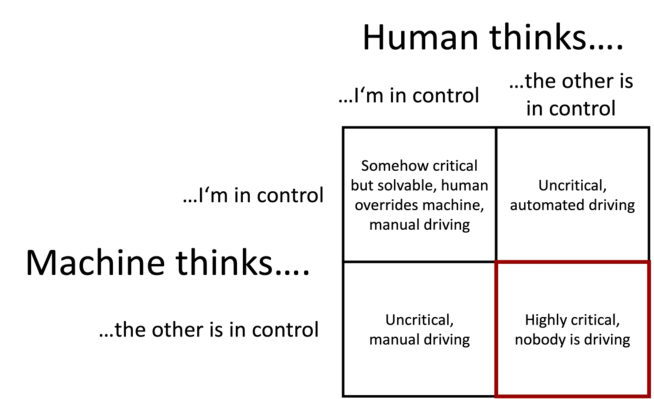
A fundamental question in partially automated driving is, “Who is doing what at the moment, and how will that change in the future?” For ensuring both safety and an optimal UX, it is crucial to clearly indicate which components of the driving task are managed by the human driver and which are handled by the automated system. A critical safety concern arises when there is a miscommunication or misunderstanding between the vehicle and the driver regarding who is currently in control. This can lead to a scenario where both the driver and the vehicle assume the other is handling the driving task, resulting in a potentially dangerous situation where no one is driving (Figure 1).
Figure 1: Possible situations in task sharing (Rössger, 2024).
In the realm of traffic safety, two constructs are delineated for clarity: Situational Awareness (SA) and Mode Awareness (MA). According to Endsley (1995), Situational Awareness is defined as the perception of elements within the environment, the comprehension of their significance, and the projection of their status soon. Effective situational awareness of the current traffic environment, including both its static and dynamic elements, is crucial for the safe transition of vehicle control from an automated driving phase back to the human driver (Schlag, 2016).
Situational Awareness encompasses three levels: perception, comprehension, and projection. Perception involves recognizing critical factors in the environment, such as other vehicles, road signs, and pedestrians. Comprehension refers to understanding the implications of these factors for the driving context, such as recognizing that a pedestrian at the curb might step into the road. Projection entails anticipating future states, like predicting the movement of vehicles based on their current speed and trajectory.
Mode Awareness, on the other hand, pertains to the driver’s awareness of the vehicle’s current automation mode (Özkan et al., 2021). This includes knowledge and understanding of the system’s current state, its behavior, and its expected future states (Andre & Degani, 1997). Mode Awareness is critical
The Rolling Robot and the Human Brain: Handover of the Driving Task 87
because automated driving systems can operate in multiple modes, each with different capabilities and limitations. For instance, a vehicle might switch between manual driving, partial automation, and full automation modes, each requiring different levels of driver engagement and oversight.
To ensure safe vehicle operation, a driver must not only be aware of the current mode but also understand the implications of each mode for vehicle control and performance. This involves recognizing the system’s boundaries, such as when it can safely navigate on its own and when it requires driver intervention. Furthermore, the driver needs to be aware of transition cues indicating mode changes and be prepared to assume control when necessary.
Integrating these constructs into the design and operation of automated driving systems is essential for enhancing traffic safety. By ensuring drivers have a high level of Situational and Mode Awareness, we can mitigate the risks associated with automation and improve the overall safety and efficiency of vehicular traffic. Parts of this chapter are based on an internal paper of the KARLI Project (Pagenkopf et al., n.d.).
Addressing the issue of “who is doing what?”, including SA and MA is essential for the development of reliable and user-friendly partially automated driving systems. We need to clearly indicate who in the human-machine system is performing which tasks. Existing solutions are limited in the quality of information transfer, usability, and UX. We conducted a study to find out, which icons are easiest to understand, and which procedure finds the highest acceptance in the potential user group.
METHODS
In a study with 20 participants, 55% female, 45% male, aged between 20 and 59, two data collections were performed. The first phase of the study (icon test) collected data on the understandability of icons. Eight icons were tested, one for an Avatar, one for ok, and two sets of icons giving the respective instructions during the handover procedure (Table 1). All icons were animated.
Table 1. Matrix of the tested icons.
Table available in the original PDF paper.
In the second part of the study (handover procedures) four different designs of the handover procedure were tested. Videoclips of about 10sec length were shown in a loop. The participants watched them for the entire time we collected data for the respective design. The order of the designs was permutated systemically to reduce effects of order.
For the icon test data was collected applying the following methods:
Recording of the answers of the participants in written form, was the icon recognized correctly
If not, what did the participant believed it indicated
Was it seen as an information or as an advice.
Four different design variants (Designs A to D, Design A is shown as a sample in Figure 2) were developed to support the handover procedure from driver to vehicle.
Figure 2: Design A (icons detail, icons parallel to road, road mark lines, animated action).
The characteristics of the respective designs are described in Table 2.
Table 2. Design parameters.
Table available in the original PDF paper.
Kind of Icons Location of Icons Roadmarks Animation Design A Detail Parallel to road Line Action Design B Holistic Horizontal Line Figure and Action Design C Holistic Vertical Carpet Figure and Action Design D Detail Single Carpet Action and Bubbles
For the handover procedures the following data collection procedures were applied:
Net Promotor Score (NPS), one question: “How likely is it that you would recommend this company to a friend, colleague, or business partner?” Participants rate their answers on a scale from 0 to 10.
Expanded NPS, one question: how well did you understand the icon?
meCUE, a user experience questionnaire
Ranking of the designs (“which one did you like most, second, third, least?”)
Interview.
The Rolling Robot and the Human Brain: Handover of the Driving Task 89
For further insights into the meCUE tool, readers are referred to Minge et al. (2013) and Thüring & Mahlke (2007), while additional details on the Net Promoter Score can be found in references such as Baehre et al. (2022).
RESULTS
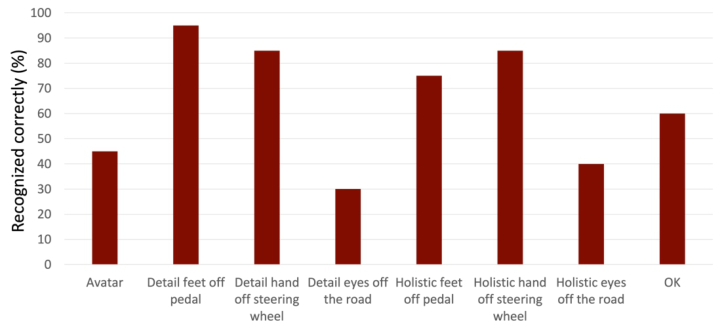
The icon best understood was the detail icon for feet off pedals. The detail icon hand off steering wheel and holistic hand of steering wheel were understood correctly by over 80% of the participants. Both icons for eyes off the road were understood by 40% of the participants or less (Figure 3).
Figure 3: Percentage of icons understood correctly.
The misinterpretations of the icons are listed in Table 3.
Table 3. Misinterpretations of the icons.
Table available in the original PDF paper.
Icon Missinterpretation
Steering wheel not working, touch the steering wheel
Avatar Maintenance mode, no meaning, Face ID, facial recognition, unlock vehicle, sleep mode, the car wants to say something Detail feet off pedal Take foot off the brake Detail hand off steering wheel
Something is in front of me, I don’t know
Detail eyes off road No idea, look forward, something is turned off, don’t fall asleep, poor visibility, camera not working, toggle eye tracking on/off, drowsiness detected, I must stay awake, sensor defect - I must take over Holistic feet off pedal Put foot on the pedal Holistic hand off steering wheel Holistic eyes off road No idea, vision, turn something off, warning that the driver is falling asleep, focus, restricted visibility, look straight ahead, look at the road, scan something OK —
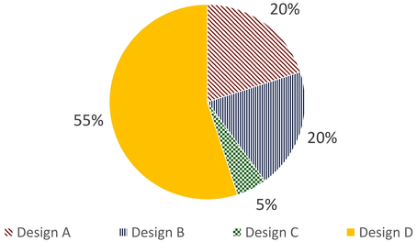
The favorite design was design D, 55% of the participants ranked in on place 1, the second place is shred between Designs A and B (20%), last was
design C (5%) (Figure 4). The results of the ranking were supported by the NPS and the meCUE overall rating. In the NPS (scale ranges from –100 to +100) Design D reached –30, Design A –40, Design B –55, and Design C –65. In the meCUE overall rating (scale from –5 to +5) Design D reached 2.1 points, Design A 2, Design B 1.4, and Design C 1.2.
There is a clear age dependency of the favorite designs. 72 % of the participants aged between 18 and 29 rated Design D as the best, 57% of the participants aged 30-39, 50% of the participants between 40 and 49, no participant of 50+ years of age rated it best.
The understandability of the designs, measured with the expanded NPS was positive for all designs. On a scale from –100 to +100 designs A and D reached 25 points, designs B and C 10 each.
Figure 4: Results of the design ranking (which design do you think is the best?).
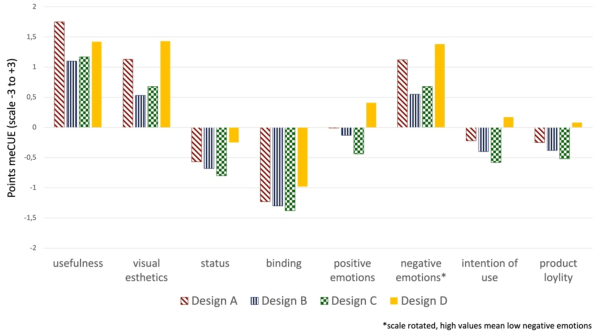
The single dimensions of the meCUE show that all designs are rated positive in usefulness, visual esthetics, and negative emotions (meaning, no negative emotions occurred). Negative scores were found for all designs in status and binding and for all design besides Design D in positive emotions, intention of use, and product loyalty (Figure 5).
Figure 5: Results meCUE, single dimensions for every design.
The Rolling Robot and the Human Brain: Handover of the Driving Task 91
CONCLUSION
The comprehensibility of the icons varied significantly, with the icons related to eyes-off the road being particularly poorly understood. Detailed icons tended to be more understandable than holistic icons. None of the designs for the handover procedure was rated as particularly good, and the Net Promoter Score was negative for all versions. This indicates that all designs had more detractors than promoters.
All designs were judged to be understandable, with Designs A and D ranking ahead of the other two. In the study section on icon comprehensibility, the detailed icons achieved better scores than the holistic icons. Designs A and D, both of which contain detailed icons, were rated as more comprehensible.
The comprehensibility of the icons ranged from 95% (detailed icon for foot off the pedal) to 30% (detailed icon for eye off the road). The holistic icon for look away was also poorly understood, with a 40% recognition rate. Overall, the detailed icons were better understood than the holistic icons. The icon for the avatar was understood quite poorly, though it is important to note that the context was completely missing. With context (such as language, interaction, and icon animation), the comprehensibility is very likely to be significantly higher. Misinterpretations were greatest for the eyes off the road icons. Often, they were not even associated with the theme of “vision” or were interpreted as the opposite (e.g., “do not fall asleep”). New and better comprehensible designs need to be found for the icons related to “take your eyes of the road.” The detailed icons were generally better understood than the holistic icons. This aligns with many statements from the interviews and the results of the NPS concerning comprehensibility.
The order of the designs was largely consistent across the different evaluation tools. In terms of ranking, ranking points, NPS, and the overall result of the meCUE questionnaire, Design D (Figure 6) was chosen as the best. Over half of the participants (55%) ranked Design D as the best in the ranking. Design A was mostly ranked second across the different evaluation methods. In the ranking, it shared the second place with Design B, while in ranking points, Design B slightly outperformed Design A. Design C was rated the worst by all methods. The age dependency of the ratings was notable; the younger the participants, the more distinctly Design D was favored. In the 50+ age group, Design D was not ranked first. The comprehensibility of Designs A and D was higher than that of the other two. All results were positive, indicating that in all cases, there were more promoters than detractors.
In the subdimensions of the meCUE, the results for Design D were confirmed. It performed the best in all dimensions except usefulness, where it ranked second. Design A won in the usefulness dimension and placed second in all other dimensions. Design B performed the worst in the dimensions of usefulness, visual aesthetics, and negative emotions. Design C scored the lowest in the dimensions of status, attachment, positive emotions, usage intention, and product loyalty. In the dimensions of usefulness, visual aesthetics, and negative emotions, all designs achieved positive values.
However, in the dimensions of status and attachment, the results were negative for all designs. Design D achieved positive values in the dimensions of positive emotions, usage intention, and product loyalty, while all other designs remained in the negative range.
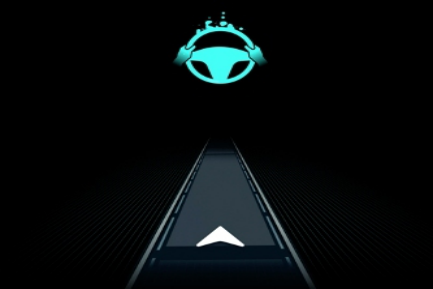
Figure 6: The winner, Design D (detailed icons, single presentation of icons, road marks carpet, animation is action and bubbles).
The results of the statistical procedures were supported by the interview statements. Design D was described positively, often with words like "cool." In contrast, Design C was described very negatively by many participants, with some even calling it "the worst design of all!" Among the participants, two groups emerged. One group appreciated the focus of Design D, noting that it only shows what is currently important. A slightly smaller group wanted to see which handover actions had already occurred and which were still to come. Many participants liked the bubbles in Design D and described them positively, while some found this design element negative, considering it too playful or unnecessary.
The icons were generally rated as understandable, except for the two icons for eyes off the road, which were found to be incomprehensible. Design D was unequivocally rated the best by the participants, suggesting that this design should form the basis for further steps. The detailed icons achieved better results than the holistic icons. From a design efficiency perspective, detailed icons are more suitable as they make better use of the available screen space to transfer relevant information. The two designs incorporating detailed icons were rated higher than the other two designs, indicating that detailed icons should be used.
Some participants expressed a preference for indicating which parts of the handover had already occurred and which were upcoming. This could be considered for inclusion, though it should be noted that doing so may compromise the design’s focus, clear indication of required actions, and effective positioning of the icons. Design D should be further developed and integrated into the KARLI HMI.
Priority should be given to redesigning the icon for eyes off the road. A suggested redesign is to use two eyes with closing eyelids. Another solution
The Rolling Robot and the Human Brain: Handover of the Driving Task 93
could be a brain with an arrow, indicating the cognitive relieve of the final step of the handover. Further studies could investigate the systematic influence of individual design parameters. However, since the KARLI project is ending in the foreseeable future, no additional studies will be conducted.
ACKNOWLEDGMENT
KARLI is a project funded by the German BMWK (Bundesministerium für Wirtschaft und Klimaschutz, Federal Ministry of Economy and Climate Protection).
REFERENCES
Andre, A., & Degani, A. (1997). Do you know what mode you’re in? An analysis of mode error in everyday things. In M. Mouloua & J. M. Koonce (Hrsg.), Human- automation interaction: Research & Practice (S. 19–28). Lawrence Erlbaum. Baehre, S., O’Dwyer, M., O’Malley, L., & Lee, N. (2022). The use of Net Promoter
Score (NPS) to predict sales growth: insights from an empirical investigation. Journal of the Academy of Marketing Science, 50:67–84. Diederichs, F., Wannemacher, C., Faller, F., Mikolajewski, M., Martin, M., Voit, M.,... & Piechnik, D. (2022). Artificial intelligence for adaptive, responsive, and level-compliant interaction in the vehicle of the future (KARLI). In: International Conference on Human-Computer Interaction (pp. 164–171). Cham: Springer International Publishing. Dönmez Özkan, Y., Mirnig, A. G., Meschtscherjakov, A., Demir, C., & Tscheligi, M.
(2021). Mode Awareness Interfaces in Automated Vehicles, Robotics, and Aviation: A Literature Review. 13th International Conference on Automotive User Interfaces and Interactive Vehicular Applications, 147–158. https://doi.or g/10.1145/3409118.3475125 Endsley, M. R. (1995). Toward a Theory of Situation Awareness in Dynamic Systems.
Human Factors: The Journal of the Human Factors and Ergonomics Society, 37(1), 32–64. https://doi.org/10.1518/001872095779049543. KARLI (2024). Website of the KARLI Project. https://karli-projekt.de/en/start. Folds, Dennis. Gardner, Douglas and Deal, Steve. (2008). Building Up to the Human Systems Integration Demonstration, INCOSE INSIGHT Volume 11, No. 2. Minge, M., Riedel, L. & Thu¨ring, M. (2013). Modulare Evaluation von Technik. Ent-wicklung und Validierung des meCUE Fragebogens zur Messung der User Experience. In: E. Brandenburg, L. Doria, A. Gross, T. Gu¨ntzler & H. Smieszek (Hrsg.): Grundlagen und Anwendungen der Mensch-Technik- Interaktion. 10. Berliner Werkstatt Mensch- Maschine-Systeme (S. 28-36). Berlin: Universitätsverlag der TU Berlin. Pagenkopf, A. (n.y.). Bedingungen fu¨r angemessenes Modus-/Situationsbewusstsein.
Internal paper KARLI Project). Rössger, P. (2024). Automated Driving. Automotive User Interface lecture at the FH Aachen. SAE (2021). Taxonomy and Definitions for Terms Related to Driving Automation
Systems for On-Road Motor Vehicles. According to https://www.sae.org/standa rds/content/j3016_202104/. Schlag, B. (2016). Automatisiertes Fahren im Straßenverkehr—Offene Fragen aus Sicht der Psychologie. Zeitschrift fu¨r Verkehrssicherheit, 2(2016), 94–98. Thüring, M. & Mahlke, S. (2007). Usability, aesthetics and emotions in human–
technology interaction. International Journal of Psychology, 2007, 42 (4), 253–264.
LISTED IN THE AHFE DIGITAL BOOKSTORE CATALOGUE
Explore the complete digital volume
Human Interaction and Emerging Technologies (IHIET 2024)
Read this individual research paper free through the original publisher, or explore the full digital proceedings book.
ISBN 978-1-964867-33-5
Explore this ISBN in the AHFE Bookstore ↗Listed in the July 2026 bookstore catalogue; search by ISBN to confirm current availability · Digital book purchase optional