Wei Chen, Meng-Cong Zheng, Li-Jen Wang (2024). Enhancing Low Basketball Experience Viewer Broadcast Experience via Data Visualization: The National Basketball Association Case Study. In: Human Factors and Systems Interaction. AHFE Open Access, vol. 154, pp. 310–320. https://doi.org/10.54941/ahfe1005379
Sports broadcasting companies have been actively advancing various information visualization technologies in recent years. The current technologies and related literature predominantly focus on the professional aspects of sports instead of the general audience. According to statistical data, as much as 49% of the population in the United States are not fans of the National Basketball Association (NBA). Therefore, this study aims to broaden the NBA audience base by exploring the preferences and understanding of individuals with low experience regarding the basketball broadcast interface and the five visualized information elements. The goal is to enhance the viewing experience and economic benefits of NBA broadcasts. This study utilizes three NBA broadcasting platforms, Bally Sports, ESPN, and TNT as experimental samples. Each sample comprises 10 participants. Through an online survey, we selected 30 participants with low basketball experience for the experiment. The assessment steps included: (1) Participants watched broadcast videos and employed the think-aloud protocols. (2) Applied comprehension quizzes to assess participants' understanding. (3) Participants will fill out scales including the Evaluation of Media Entertainment Experience, NASA-TLX, Hedonic and Utilitarian Attitudes, and Re-viewing Intention, reflecting their evaluations and experiences regarding the broadcast visuals. (4) Conduct semi-structured interviews to gather insights and suggestions regarding participants' thoughts on broadcast interfaces and the five visualized informational elements. Results revealed that: In comparing the three sports broadcasting platforms, TNT performed the best on the Evaluation of Media Entertainment Experience scale, Hedonic and Utilitarian Attitudes scale, and Re-viewing Intention scale. ESPN was rated next, followed by Bally Sports. According to the NASA-TLX scale results, Bally Sports scored the highest in workload, followed by ESPN, and TNT scored the lowest. Most participants indicated that TNT's interface is simple and easy to understand, and ESPN's interface presents information clearly. In contrast, Bally Sports' interface has an excess of visual elements, which leads to a suboptimal viewing experience and a higher viewing workload. In the five visualized information elements, participants' preferences for viewing information were ranked as follows: (1) on-court shot clock, (2) lower third-player stats, (3) player position tracking, (4) shot probability, and (5) three-point shot distance. Most participants believed that the on-court shot clock provides excitement and a sense of engagement, while the lower third-player stats allow for a better understanding of each player. The player position tracking was regarded as an essential tool for the participants' understanding of team tactics, player positioning, and basketball movements. Most participants considered shot probability less important and most expressed a reluctance to see information about three-point shot distance, deeming it challenging to understand and lacking significance. This study provides insights into the perspectives and evaluations of NBA broadcast interfaces from individuals with low basketball experience and their preferences and comprehension levels regarding visualized information. The findings can guide future designs of basketball broadcast interfaces.
Sports activities have always been an integral part of our lives, especially regarding the broadcast of sports events. With the development of infor- mation media, many sports events are broadcasted through various media
platforms. Numerous sports channels also integrate statistical data into their broadcast screens, aiming to provide both viewers and professional sports analysts with a deeper understanding of the game. According to the global consumer survey results (Richter, Sep 6, 2022), the National Basketball Asso- ciation (NBA), abbreviated as NBA, stands out as the sporting event with the highest viewership among the young demographic. Furthermore, according to a report from MANAGER today, the total revenue of the NBA in the United States has shown an upward trend from the 2021 to the 2022 season. The combined revenue of all 30 NBA teams has recently exceeded USD 10 billion, indicating the significant importance and growth of the NBA within the sports economy in the United States.
Although there are currently many sports broadcasting platforms that emphasize improving the audience experience, the information content pre- sented by each NBA broadcasting network varies significantly. It remains uncertain whether viewers will appreciate the information and presentation style featured on the current broadcasting interface. Study has indicated that when watching live sports events, viewers often express a desire for player information, team details, and other relevant data. Currently, they may need to access other platforms specifically for such details, indicating a challenge in meeting personalized needs (Lin et al., 2023). Furthermore, current literature on basketball data visualization predominantly focuses on sports analysts, with limited attention given to individuals with low experience. According to the study conducted by the statistical website Statista in 2023 (Statista, 2023), the non-fan audience, compared to fans, constitutes a larger demo- graphic and generates greater economic benefits. Literature also suggests that viewers with lower experience levels tend to focus on information beyond ball handler (Jin et al., 2023).
As Augmented Reality (AR) technology matures, an increasing number of sports studies are exploring its applications. According to the literature (Goe- bert et al., 2022), there is a growing trend of Television (TV) integrating AR as Augmented Reality Television (ARTV).This technology is being adopted not only in sports events but also in various television programs. The follow- ing analysis will delve into recent literature on Augmented Reality (AR) and traditional information presentation. In the context of visualizing Augmented Reality (AR) in rugby, a relevant case study explored the use of situational visualization to enhance the live sports viewing experience (Lo et al., 2022), aiming to improve user engagement and experience. The study utilized Aug- mented Reality (AR) technology to enhance the viewers’ watching experience. The authors incorporated data visualizations into the smartphone screen using AR technology. This study findings indicated that live information graphics received positive feedback compared to scenarios without charts or using traditional informational graphics. Furthermore, it was observed that the comprehension of the game was enhanced without increasing cogni- tive burden. In the field of basketball data visualization study, experts have explored existing Augmented Reality (AR) basketball broadcasting screens (Goebert et al., 2022). Furthermore, in the subsequent future developments, it was emphasized that the application of AR shall take into consideration the psychological aspects of a broader sports enthusiast audience. Experts have
indicated that current study on Augmented Reality (AR) sports visualization predominantly focuses on the coach and training aspects, with minimal atten- tion given to audience experience. (Lo et al., 2022). Therefore, this study aims to explore the perspectives of individuals with low experience levels regard- ing basketball game broadcasts. The goal is to comprehend users’ opinions on the existing NBA broadcasting interface, particularly their preferences and comprehension levels regarding visualized information. This information can serve as a reference for future study designs.
METHODS
A total of 258 participants completed an online questionnaire distributed on various social media platforms. From this pool, 30 individuals, consti- tuting the bottom 27%, were selected as low-experience participants for the experimental investigation. The experimental samples were drawn from the NBA and included representative broadcasting platforms: Bally Sports, ESPN, and TNT. Each broadcasting platform had 10 participants engaged in the viewing experiment, watching a 2-minute compilation video of bas- ketball goals. The experiment consisted of four steps: (1) viewing broadcast videos. (2) Undergoing comprehension assessment quizzes. (3) completing the Evaluation of Media Entertainment Experience scales (7-point Likert scale) (Rogers, 2019), NASA-TLX scale (0-10) (Dhaini et al., 2022; Mouzé- Amady et al., 2013), Hedonic and Utilitarian Attitudes scales (1-7) (Voss et al., 2003)and Re-viewing Intention scales (7-point Likert scale) (Lee et al., 2016), to reflect evaluations and feelings towards the broadcast interface. (4) Conducting semi-structured interviews to gain insights into participants’ thoughts and suggestions regarding the broadcast interface and the visual elements. The study involves participants using 16-inch screens to view three different sports broadcasts. The entire viewing process is recorded through video, capturing the participants’ viewing behaviors and interview.
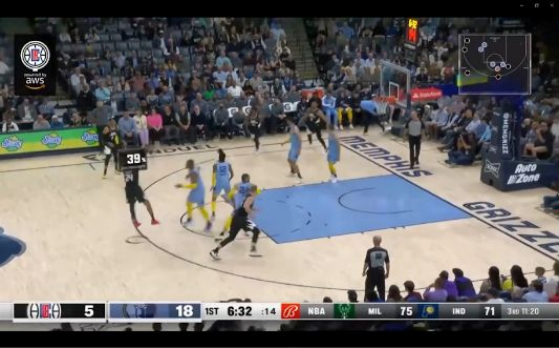
In Bally Sports, most participants demonstrated a solid comprehension of shot probability, achieving an impressive 80% accuracy rate. This indicates that the design of this information is easily comprehensible. Only 20% of participants mistakenly identified it as shot distance. Regarding the high- est shot probability question, the correct response rate was 40%. Among the 20% who answered incorrectly, they mentioned that the frequent trans- formation of shot probability data led to participants not paying specific attention to the numerical values. Regarding the player position tracking, most participants could comprehend this information. However, 70% of par- ticipants answered incorrectly for the question about corresponding colors, while 30% answered correctly (with 10% of participants guessing). Subse- quent interviews revealed that viewers do not actively memorize the colors corresponding to teams while watching. Therefore, this particular question yielded a higher error rate. Nevertheless, upon revisiting the viewing screen,
most participants could clearly identify the team information represented by the corresponding colors. For the lower third-player stats in Bally Sports, the correct response rate was only 10%, and those who answered correctly did so by guessing. Fifty percent of participants indicated that the information was presented too quickly, preventing them from capturing detailed information.
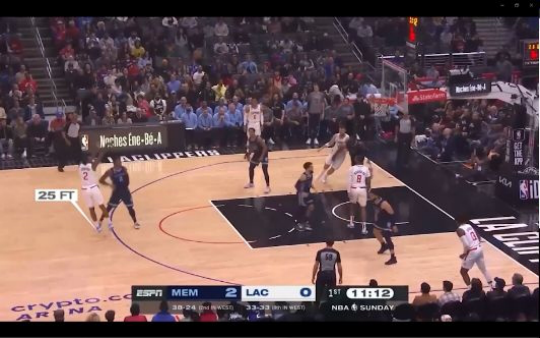
In ESPN, 50% of participants correctly identified the meaning of the three- point shot distance. Among the 50% who answered incorrectly, 20% did not specifically pay attention to this information. The remaining participants mistakenly thought it represented the shooting release position, seconds, or the distance to the three-point line. Regarding the question about the farthest three-point shot made during the entire game, the correct response rate was only 40%. Twenty percent of participants mentioned that the information displayed too many numbers and kept changing. The correct response rate for the lower third-player stats in ESPN was 0%. Among the participants who answered incorrectly, 50% mentioned that the information was displayed too quickly. Additionally, 10% of them expressed that the lower third-player stats shall not be co-located with the scoreboard.
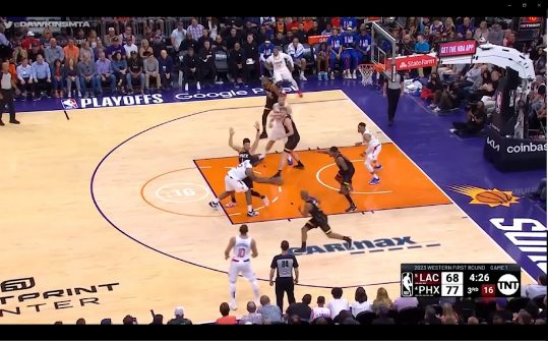
In TNT, 70% of participants could identify the location of the on-court shot clock. Among those who answered incorrectly, participants mentioned that the display method was not prominent enough and blended too seam- lessly with the floor, causing them not to notice it. Regarding the color-related question, 90% of participants correctly identified the information about the color change after the remaining 5 seconds. It was inferred as a guess among the 20% who answered correctly since they did not successfully indi- cate the on-court shot clock’s position in the previous question. For the lower third-player stats in TNT, there was only a 20% correct response rate (guessed). All participants indicated that they did not see this information, with 10% mentioning that the color of this information was too similar to the scoreboard.
Table 1. Correctness of comprehension questions.
Table available in the original PDF paper.
Comprehension Questions Accuracy
80%
Bally Sports Shot probability: What does the information above the player’s head represent?
90%
Shot probability: What is the highest shot probability in this game? 40% Player position tracking: What does the icon in the top right corner represent?
30%
Player position tracking: In the graphic, what do the respective colors correspond to for the dots?
50%
Lower third-player stats: How many points does jersey player 0 have? 10% ESPN Three-point shot distance: What does the information near the player’s feet represent?
0%
Three-point shot distance: What is the farthest shooting distance in feet? 40% Lower third-player stats: How many points does the player with jersey number 2 have?
70%
TNT On-court shot clock: Please draw the location of the countdown timer on paper.
90%
On-court shot clock: What color does the shot clock turn when there are 5 seconds left?
Lower third-player stats: How many points does jersey number 2 have? 20%
Based on the data results from the scales, a comparison among the three sports broadcasting platforms was conducted. The TNT demonstrated the highest performance on the Evaluation of Media Entertainment Experience scale, Hedonic and Utilitarian Attitudes scale, and Re-viewing Intention scale, followed by the ESPN, and lastly is the Bally Sports. According to the results of the NASA-TLX scale, the Bally Sports scored the highest in terms of work- load, followed by ESPN, and lastly is TNT. The three experimental samples exhibited no significant differences across the four different scales.
Table 2. Three broadcasters, scale score.
Table available in the original PDF paper.
ESPN M(SD) TNT M(SD) F value p value Bally Sports M(SD) 2.90(1.22) 3.68(0.48) 3.88(1.04) 2.059 .161
Preferences Ranking of Three Broadcast Platform Participants ranked their preference for the three broadcast interface. The ranking of broadcast interfaces from highest to lowest is as follows: ESPN, Bally Sports, and TNT. Most participants ranked ESPN as their top choice, and many indicated that the scoreboard was one of the primary criteria for their preference. The simplicity and appropriate size of the scoreboard in this sample make it clear for participants to comprehend the current team scores. Bally Sports is ranked second, with participants expressing a pref- erence for diverse visualized information. They particularly favored shot probability and highlighted that animated effects were among the reasons for their preference. TNT is ranked last. Most participants found that while this interface is the most minimalist, it tends to be too monotonous, espe- cially the scoreboard. The overall presentation of information is considered too limited, making it more suitable for professional viewers. Therefore, this sample received relatively lower preference.
Comprehension Ranking of Three Broadcast Platform Participants ranked their comprehension levels of the three broadcasters. The ranking from highest to lowest understanding of the broadcast interfaces is as follows: TNT, ESPN, and Bally Sports. Most participants who chose TNT expressed that they found its interface style to be the most straightforward. The scoreboard contains minimal information, and the visualized informa- tion is limited to the on-court shot clock, making it the easiest to comprehend. In the second position, ESPN’s scoreboard in this sample is easily compre- hensible, but the three-point shot distance proves excessively challenging to grasp. Ranked last is Bally Sports. In this sample, the overall information is
more abundant, and the visualized information is relatively challenging to comprehend. The advertising information on the scoreboard is particularly difficult to understand, leading to its placement at the bottom of the ranking.
Ranking of Visualized Information Preferences Participants were asked to rank their preferences of visualized information: shot probability, three-point shot distance, player position tracking, on-court shot clock, and lower third-player stats. The results indicate that the ranking of visualized information from highest to lowest is as follows: (1) on-court shot clock, (2) lower third-player stats, (3) player position tracking, (4) shot probability, and (5) three-point shot distance. 53.3% of the participants indicated that on-court shot clock is considered crucial information in bas- ketball games. Through this information, they can comprehend how much time remains for the offensive team to make a play. 63.3% of the partic- ipants expressed a desire to access the lower third-player stats, attributing the belief that this information enhanced their understanding of the players’ scoring performance on the court. Additionally, participants indicated that they would specifically focus on the information of their favorite celebrity player if featured. Regarding player position tracking, 63.3% of participants indicated that this information allows for a better understanding of the tac- tical positions of players. A few individuals indicated that this information is more suitable for professional viewers, aiding in statistical analysis. Ranked second to last is the shot probability, with 56.6% of participants expressing that this information is not important, stating that displaying the shot proba- bility does not hold significance when the key focus shall be whether the shot is successful or not. Ranked last is the three-point shot distance, with 46.6% of participants expressing a disinterest in this information. They argue that knowing the shot distance of players is unnecessary for watching basketball games.
Ranking of Visualized Information Comprehension Because the lower third-player stats has one version for each of the three broadcast interface, and the other four visualized information each have only one version. In order to avoid the impact of different lower third-player stats on the comprehension ranking, they are not included in the compre- hension ranking together with other information. The participants ranked their comprehension levels of visualized information: shot probability, three- point shot distance, player position tracking, and on-court shot clock. The results reveal that the information is ranked from easiest to comprehend to most challenging as follows: (1) player position tracking, (2) on-court shot clock, (3) three-point shot distance, and (4) shot probability. 86.6% of par- ticipants found that player position tracking were the easiest to comprehend. The use of corresponding colors for each team allowed for a clear understand- ing of the players’ real-time positions and team tactics. The on-court shot clock was also widely understood, with a majority of participants express- ing that the on-court shot clock was easily grasped at a glance, providing a clear indication of the 24-second shot clock. However, 50% of participants
noted that the display position of the on-court shot clock was not promi- nent and could be easily overlooked. The three-point shot distance ranked as the second most challenging information to comprehend. 73.3% of partici- pants found it difficult to comprehend, primarily because most of them were beginners and did not grasp the meaning of “FT.” In addition to this, a few participants misinterpreted the information, perceiving it as shot probability instead. Regarding shot probability, more than half of the participants could not comprehend this information. 30% of participants did not comprehend why this information kept changing data and expressed that understanding the meaning behind the numerical values was necessary for comprehending this information. Regarding the lower third-player stats, overall, 66.6% of the participants indicated that they found it challenging to comprehend. They do not comprehend the text abbreviations within the player stats. Overall, 83.3% of the participants did not see the lower third-player stats, indicating that they found the information display too rapid. The lower third-player stats and scoreboard overlap in the ESPN and TNT samples, making them easily overlooked.
Preferences for Data Content and Type 56.6% of the participants expressed a desire to be informed about the team scores. They considered this information to be fundamental in the context of basketball games, emphasizing its necessity for presentation on the broadcast screen.56.6% of the participants wanted to access additional player-related information, including historical data, details about star players, and foul statistics. As most participants are beginners, they expressed the expectation that such information would help them better comprehend the players’ situa- tions on the court. A minority of participants contends that the presentation of game time and team information is deemed essential on the broadcast interface.
Personalization Preferences Regarding the personalized selection feature, 93.3% of the participants considered having such functionalities extremely beneficial. They support introducing this feature as it allows them to choose the information they want displayed on the broadcast screen, enhancing comprehension.
CONCLUSION
Based on the consolidation and analysis, we can summarize the perspectives and thoughts of low-experience individuals regarding the existing basketball. Broadcast interface and visualized information as follows: The Importance of Basketball Knowledge and Information Presentation Methods on the Comprehension of Sports Events
Currently, the information provided by the three NBA broadcast interfaces seems more suitable for fans and viewers with a certain level of basketball knowledge. During the experiment, many participants found it challenging
to comprehend basketball information primarily due to insufficient knowl- edge, especially the lower third-player stats and the three-point shot distance. For example, 66.6% of the respondents said that the lower third-player stats were challenging to comprehend, especially the abbreviations and 23.3% sug- gested that player photos could be placed on the information board. In the case of three-point shot distance, participants did not comprehend the mean- ing of “FT.” Shot probability, participants may not comprehend the meaning of percentage displays, and an unclear presentation format can also affect comprehension, leading to potential misunderstandings. In the comprehen- sion ranking, neither three-point shot distance nor did shot probability score high positions. Conversely, regarding the on-court shot clock and player posi- tion tracking, the information design was simple and easy to comprehend. As a result, participants could quickly comprehend the information. Concerning the scoreboard, 30% of the participants find it difficult to comprehend the small text below the ESPN scoreboard. 26.6% of the participants feel that the advertising information on the right side of the Bally Sports scoreboard is very distracting. This also increases their viewing burden. On the contrary, simpli- fying the presentation to include only basic information such as score, time, and team names reduces their viewing burden. Therefore, simplifying infor- mation can help low-experience viewers immerse themselves more effectively in the game’s atmosphere.
An Excess of Information Elements and Excessively Brief Presentation Time Can Impact the Viewing Experience Based on this study results, it can be inferred that an excess of information elements and a presentation time that is too short affect the viewing expe- rience. This conclusion aligns with previous study findings (Zheng & Chen, 2022). This study results show that the NASA-TLX scores for Bally Sports are the highest, indicating the highest perceived workload. The excessive infor- mation on Bally Sports’ interface causes stress for low-experience viewers, 33.3% of the participants mentioning the cluttered information on this inter- face. Furthermore, the presentation time is crucial; information transitioning too quickly may cause participants to overlook it, leading to a lack of under- standing of the conveyed message. From the comprehension assessment, it can be inferred that the lower third-player stats on the three broadcast inter- faces have a display time that is too short, resulting in unread information and, consequently, a low accuracy rate.
Participants’ Preference for Personalized Features Based on the interview results, it can be concluded that 93.3% of low-experience individuals express the expectation of having personalized choices, allowing them the freedom to select the information they want to view. This conclusion aligns with previous study findings (Lin et al., 2023). Apart from basic information, each participant has unique prefer- ences regarding the data they want to see. Therefore, personalized features are crucial in basketball game broadcasts to cater to individual viewer preferences. How to effectively present pertinent information through data
visualization is a crucial aspect. Optimizing the basketball broadcasting inter- face for the future involves ensuring that individuals with lower experience can easily comprehend the broadcast, attracting a greater audience of low- experienced viewers to basketball events. The future broadcasting interface are recommended to prioritize personalized functions and more intuitive information displays to expand the viewership of basketball events. Accord- ing to interview feedback, 56.6% of the participants wanted to learn more about players’ information and team scores during the broadcast. There- fore, it can be inferred that approximately half of the low-experience viewers express a desire to comprehend basic basketball information. They expressed that, when watching basketball games, excessive presentation of information would have a counterproductive effect. They prefer to focus on fundamental information. Furthermore, from the ranking results of preferences and com- prehension, it is evident that three-point shot distance and shot probability did not capture the participants’ favor. The understanding of these two pieces of information was also relatively low. It can be inferred that there is ample room for improvement in these two aspects of information.
Subsequent experiments will retain fundamental basketball information, including shot probability and three-point shot distance. Despite partici- pants generally did not prefer these two pieces of information and were also challenged to comprehend them. These information enhance the audience’s understanding of the game and meet the demands of high-experienced view- ers. Therefore, future experiments will optimize these metrics to create a more engaging viewing experience.
REFERENCES
Dhaini, S. R., Abed Al Ahad, M., Simon, M., Ausserhofer, D., Abu-Saad Huijer, H., & Elbejjani, M. (2022). Repeated assessments and predictors of nurses’ shift-specific perceived workload. Nursing Forum, 57(6), 1026–1033. doi: https://doi.org/10. 1111/nuf.12776. Goebert, C., Greenhalgh, G., & Dwyer, B. (2022). A whole new ball game: Fan per-
ceptions of augmented reality enhanced sport broadcasts. Computers in Human Behavior, 137, 107388. doi: https://doi.org/10.1016/j.chb.2022.107388. Jin, P., Ge, Z., & Fan, T. (2023). Research on visual search behaviors of basketball players at different levels of sports expertise. Scientific Reports, 13(1). doi: 10.1038/s41598-023-28754-2. Lee, M., Kim, D., Williams, A. S., & Pedersen, P. M. (2016). Investigating the
role of sports commentary: an analysis of media-consumption behavior and programmatic quality and satisfaction. Journal of Sports Media, 11(1), 145–167. Lin, T., Chen, Z., Yang, Y., Chiappalupi, D., Beyer, J., & Pfister, H. (2023). The Quest for : Embedded Visualization for Augmenting Basketball Game Viewing Experiences. IEEE Transactions on Visualization and Computer Graphics, 29(1), 962–971. doi: 10.1109/TVCG.2022.3209353. Lo, W. H., Zollmann, S., & Regenbrecht, H. (2022). Stats on-site — Sports spectator
experience through situated visualizations. Computers and Graphics (Pergamon), 102, 99–111. doi: 10.1016/j.cag.2021.12.009. Mouzé-Amady, M., Raufaste, E., Prade, H., & Meyer, J.-P. (2013). Fuzzy-TLX: using fuzzy integrals for evaluating human mental workload with NASA-Task Load indeX in laboratory and field studies. Ergonomics, 56(5), 752–763. doi: 10.1080/00140139.2013.776702.
Richter, F. (Sep 6, 2022). Americans Love the NFL, But Change Is Looming. Retrieved from https://www.statista.com/chart/15869/favrotie-sports-league/. Rogers, R. (2019). The Impact of Presenting Physiological Data During Sporting
Events on Audiences’ Entertainment. Journal of Sports Media, 14(1), 155–170. Statista. (2023). Level of interest in the National Basketball Association in the United States as of March 2023. Retrieved from https://www.statista.com/stati stics/1098355/interest-level-nba/ Voss, K. E., Spangenberg, E. R., & Grohmann, B. (2003). Measuring the hedonic and
utilitarian dimensions of consumer attitude. Journal of marketing research, 40(3), 310–320. Zheng, M. C., & Chen, C. Y. (2022). Types of Major League Baseball Broadcast Information and Their Impacts on Audience Experience. Informatics, 9(4). doi: 10.3390/informatics9040082.
LISTED IN THE AHFE DIGITAL BOOKSTORE CATALOGUE
Explore the complete digital volume
Human Factors and Systems Interaction
Read this individual research paper free through the original publisher, or explore the full digital proceedings book.
ISBN 978-1-964867-30-4
Explore this ISBN in the AHFE Bookstore ↗Listed in the July 2026 bookstore catalogue; search by ISBN to confirm current availability · Digital book purchase optional