Michael Schneeberger, Belén Carballo Leyenda, Jose A Rodríguez-marroyo, Lucas Paletta (2024). Validation of Wearable Biosignal Sensor-based Estimation of the Physiological Strain Index Using Gaussian Process Regression. In: Cognitive Computing and Internet of Things. AHFE Open Access, vol. 124, pp. 53–63. https://doi.org/10.54941/ahfe1004703
At physiologically intensive work or during acute exercises, early alert functions are highly required to prevent physiological damage to human health. Wearable sensor-based monitoring of vital parameters can provide real-time measures for the quantification of a worker’s individual psychophysiological and thermal strain to define risk levels for appropriate decision support. One of the most well-recognized indices suitable for use in the workplace so far is the Physiological Strain Index (PSI; Moran et al., 1998) based on sensor data about (i) the core body temperature (CBT) as well as (ii) the heart rate (HR). Until recently, the ground truth information about CBT was particularly measured by cumbersome swallowing expensive gastrointestinal temperature pills. A more comfortable strategy is to attach bioelectrical temperature sensors to the human skin and from these data provide an estimate about the CBT. Dolson et al. (2022) provided a systematic review on distinct algorithms to predict the core body temperature using wearable technology. Most of these algorithms deployed Kalman filters for the prediction. Only a few algorithms incorporated individual and environmental data into their core body temperature prediction, despite the known impact of individual health and situational and environmental factors on the CBT. The presented Machine Learning (ML) framework provides a comparison between a large set of Artificial Intelligence (AI) methods. The Gaussian Process Regression method (GPR; Rasmussen and Williams, 2006) has determined the minimum root mean square error (RMSE) on data from a highly challenging exercise profile applied by a wildland firefighter group. The results are highly competitive with the methods reported in Dolson et al. (2022).
The monitoring of vital parameters can provide real-time measures to deter- mine the worker’s individual physiological and thermal strain level. This measure has been suggested to provide risk levels for decision support for a personalized protection from either heat or cold-related health dam- age. Recent technological advancements have led to rapid growth in the
development of wearable physiological monitors and subsequent research on the utility of these systems. One of the most well-recognized indices suitable for use in the workplace so far is the PSI (Moran et al., 1998) that was devel- oped to reduce incidences of heat-related health damage at an individual level in the military (Moran et al., 1998).
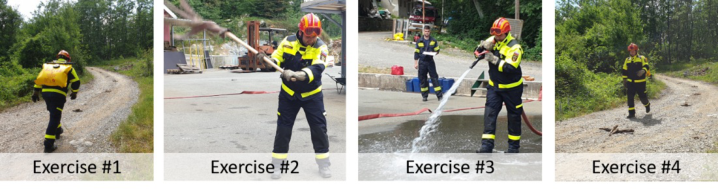
Figure 1: Wildland firefighters at the test site (Šapjane, center of firefighters Rijeka; 2021). The load profile consisted of 2 rounds each including four firefighter charac- teristic activities (left to right): marching uphill/downhill with 20 kg backpack (HC20), fire swatter exercise, hosing, and marching again, each with a duration of 5 minutes. Between the 2 rounds there was a break of 10 minutes.
The modified physiological heat strain index (PSI*; Buller et al., 2008, 2015; Seeberg et al., 2013) is usually determined from heart rate and skin temperature sensor data. PSI* is often preferred since it approximates the CBT that otherwise needs to be measured by gastrointestinal temperature pills. The precision in the measurement of the CBT being derived from the skin temperature sensor data using a mapping factor fundamentally deter- mines the precision of the estimated PSI. The error between the two quantities PSI and PSI* was described to be tolerable (Buller et al., 2018) in practice if it lies within ca. 2 standard deviations of the RMSE. However, linear, or nonlinear regression can be applied to estimate CBT from measured skin temperature and can further reduce the error. The complexity of the human thermoregulatory models suggests that the responses of CBT and physiological measures are part of a dynamical system (Buller et al., 2018). Exploiting knowledge of physiological relationships between variables has led to successful estimation of hidden variables. This type of problem can be represented as, for example, a Hidden Markov Model (discrete) or a Kalman filter (continuous; Buller et al., 2013; Buller et al., 2018). Some companies provide information about the performance figures of estimating CBT from wearable sensors that measure skin temperature data, but first optimistic data could not be reproduced so far (Düking et al., 2018; Verdel et al., 2021).
Our work intends to close therefore a gap by computing, reporting and understanding the potential to estimate CBT and PSI from wearable sen- sors and (non-)linear regression methods. For that reason, we recorded real biosignal data from a training with 12 first responders (Šapjane, Center of Firefighters Rijeka, Croatia; June 2021) with a load profile being charac- teristic for wildland firefighters (Figure 1). We used gold standard biosignal sensors for heart rate and skin temperature (measured laterally on the chest)
Validation of Wearable Biosignal Sensor-Based Estimation of the Physiological Strain Index 55
information, as well as gastrointestinal temperature pills to get the CBT ground truth. Then we set up an ML-based framework to provide a compar- ison between a large set of 26 different, mostly AI-based, methods including neural network approaches. In a next step, we rated all methods using 5-fold cross-validation and found that the Gaussian Process Regression (GPR) pro- vided the minimum RMSE of 0.279
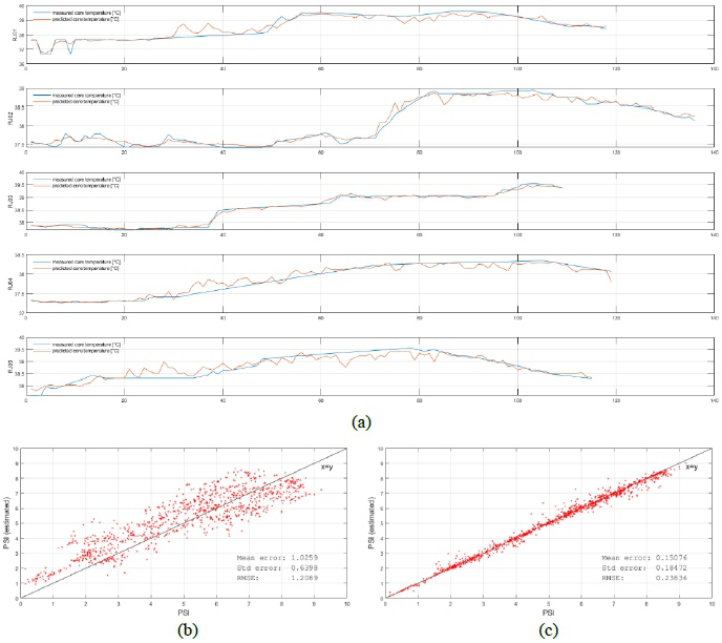
Celsius compared to our measured ground truth core body temperature. Finally, the GPR-based method was used to estimate PSI and attained absolute error values of M = 0.151, SD = 0.185 (RMSE M = 0.238) related to the ground truth PSI value, which is in contrary to the linear fitted model that achieved absolute error values of M = 1.026, SD = 0.640 (RMSE: M = 1.209) points. This finally repre- sents a substantial improvement for a decision support system that should provide the most appropriate warnings and alerts in the case of high risk of physiological strain.
RELATED WORK
The complexity of the human thermoregulatory models suggests that the responses of CBT and other physiological measures are part of a dynamical system (Buller et al., 2018). With the use of current physiological monitor- ing techniques, certain variables, such as, heart rate and skin temperature, can be readily observed, whereas others, the CBT, in particular, can only be readily observed directly in a laboratory setting. Exploiting knowledge of physiological relationships between variables has led to successful esti- mation of hidden variables. This type of problem can be represented as a Hidden Markov Model (discrete) or as a Kalman filter (continuous; Buller et al., 2013; Buller et al., 2018). Both models accommodate the complex time- based relationships of the human thermoregulatory system, and both take the form of recursive algorithms based on Bayesian inference, estimating the state of the system and repeatedly updating that state from the next observation. A Kalman filter is used when the data can be modeled as continuous linear Gaussian distributions. A Hidden Markov Model is used when the data are modeled as discrete states, each with its own likelihood of occurring. Belval (2016) presented several different Machine Learning methods that can be uti- lized in the development of prediction models for internal body temperature during exercise in the heat. For a regression model, he found a multivariate adaptive regression splines model performed best. Dolson et al. (2022) pro- vided a systematic review and identified 20 studies representing a total of 25 distinct algorithms to predict the core body temperature using wearable technology. Most of these algorithms provided Kalman filters for the predic- tion. Only few algorithms incorporated individual and environmental data into their core body temperature prediction, despite the known impact of the individual health status as well as situational and environmental factors on the CBT. The RMSE error was found to be on average (wearable on chest, 322 subjects) 0.29
C ± 0.14
C, a single, best one (wearable at the wrist, 15 subjects) reported an RMSE of 0.13
Celsius (Nazarian et al., 2021). Some companies provide information about the performance figures of estimating CBT from wearable skin temperature sensors. For example, the CORE sensor
(greenTEG AG, Rümlang, Switzerland) has been made commercially avail- able. It computes CBT based on heat flux and published an error threshold of 0.3
Celsius. Some researchers could not yet reproduce this in documented trials (Düking et al., 2018; Verdel et al., 2021). Daanen et al., (2023) pro- vides an overview with detailed insight on the performance of relevant heat flux-based temperature sensors.
In our work, we present an ML-based framework with a comparison between a large set of AI methods, including neural network approaches, and finally determined the minimum RMSE of 0.279
Celsius to be found by the GPR method.
PHYSIOLOGICAL STRAIN INDEX AND RISK LEVELS The proposal for the physiological strain modelling, in line with Buller et al. (2008), consists of using PSI (Moran et al., 1998) using the CBT as a start- ing point in the physiological strain assessment. PSI* uses the raw skin temperature instead of the CBT by
PSI∗= 5 ∗ (T −T0) (Tmax −T0) + 5 ∗ (HR −HR0) (HRmax −HR0), where HR0 and T0 denote heart rate (HR) and skin temperature (T) at baseline before exercise; Tmax is the critical skin temperature established at 39.5
C; and HRmax is considered the maximum heart rate (bpm) pre- determined during a performance test or calculated based on the subject’s age according to Tanaka et al. (2001).
We assigned classification labels for alerting of a concrete risk for physi- ological collapse upon PSI* ≥7.5 (“at-risk”), and PSI* < 7.5 “not-at-risk”. However, taking experimental data into concern (Carballo-Leyenda et al., 2023), PSI* ≥6 appeared to be a good threshold for assessing physiological risk. Once an “at risk” classification has been made, additional physiological parameters could act as a second step validation of the physiological state of the first responder (i.e. heart rate thresholds, skin temperature thresholds). Yokota et al. (2005) established that, when using heart rate and skin temper- ature to assess physiological strain risk, a reasonable classification boundary would deal effectively with three conditions:
1. high heart rate and high skin temperature indicate “at-risk”, 2. high heart rate and lower skin temperature indicate “not-at-risk”, 3. high skin temperature, regardless of heart rate, indicates “at-risk” unless contextual information suggests otherwise.
Keeping in mind that the study of Yokota et al. (2005) focused on heat strain, it should be considered to add another boundary to account for exposure to cold environment that would be the expected scenario for Mountain Rescuers. For this reason, the boundary condition for cold exposure would be: 4. very low skin temperature, regardless of heart rate, indicates “at-risk”.
Validation of Wearable Biosignal Sensor-Based Estimation of the Physiological Strain Index 57
RATIONALE OF METHODOLOGY The gold standard method for measuring the CBT requires the test person swallowing a temperature measuring capsule. The pills must be swallowed at least 6–8 hours prior to testing to minimize the confounding influence of food or fluid on the pill measurements (Wilkinson et al., 2008). The quality of the measurement depends on where the pill resides in the body during the measurements and the method is very cost intensive. In contrast, the PSI* indicator is based on the skin temperature instead of the CBT since the skin temperature values can be measured much more easily at the chest of a subject.
We firstly developed a linear model that best fits PSI* to PSI (Carballo- Leyenda et al., 2023). This model is a good starting point, but still approx- imates PSI with relatively large deviations. To increase the accuracy of the PSI estimation model, we applied several nonlinear approximation methods and also extended the input parameter set: skin temperature [
C], heart rate [bpm], age [years], weight [kg] and height [m]. The output variable represents the objective of the estimation, the core body temperature [
C]. It’s associated ground truth for the supervised machine learning was the capsule-based gold standard CBT measurement.
The category sex was currently also included in the models but only for possible future use. At present, the parameter has no influence, since only training data from male firefighters were available for training the models.
GAUSSIAN PROCESS REGRESSION AND EXPLAINABLE AI Gaussian Processes (GP) are a nonparametric supervised learning method used to solve regression and probabilistic classification problems. The are many advantages of Gaussian Processes. First, the prediction interpolates the observations (at least for regular kernels) and it is probabilistic (Gaussian) so that one can compute empirical confidence intervals and decide based on those if one should refit the prediction in some region of interest. GP are also very versatile in terms of the kernels that can be used: common kernels are provided, but also custom kernels may be specified. Gaussian processes have also disadvantages. The implementation is not sparse, i.e., they use the whole samples/features information to perform the prediction. Furthermore, they lose efficiency in high dimensional spaces – namely when the number of features exceeds a few dozens.
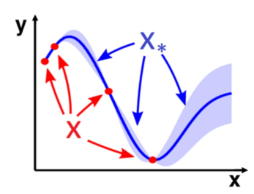
GPR implements Gaussian Processes for regression purposes. For this, the prior of the GP needs to be specified and combined with the likelihood func- tion that is based on training samples. It enables a probabilistic approach to prediction by providing the mean and standard deviation as output when pre- dicting1. A GPR model can make predictions incorporating prior knowledge (kernels) and provide uncertainty measures over predictions. Figure 2 depicts a schematic sketch of the concept of GPR. Data points (red) are distributed in n-dimensional data space. The GP model X* (blue) describes then a prob- ability distribution over possible functions that fit a set of points. GPR is a fundamental model used in machine learning. Owing to its accurate predic- tion with uncertainty and versatility in handling various data structures via 1https://scikit-learn.org/stable/modules/gaussian_process.html
kernels, GPR has been successfully used in various applications. With GPR, however, it is not possible to interpret how the features of an input contribute to its prediction.
Figure 2: Schematic sketch of the concept of GPR. Data points (red) are distributed in n-dimensional data space and estimated to represent the final GP model X* (blue).
Yoshikawa and Iwata (2020) proposed GPR within a framework of eXplainable AI (XAI; Mueller et al., 2019), i.e., with local explanation. It reveals the feature contributions to the prediction of each sample, while maintaining the predictive performance of GPR. Experimental results in Yoshikawa and Iwata (2020) verified that the proposed model can achieve predictive performance comparable to those of GPR and superior to that of existing interpretable models, and can achieve higher interpretability, both quantitatively and qualitatively.
EXPERIMENTAL RESULTS Study protocol. Wildland firefighters (N = 13; RJ01 to RJ13) performed a pre-planned exercise field test at the test site Šapjane (Center of Firefight- ers Rijeka; June 2021) in Croatia. The exercise field test was arranged in 2 rounds and intended to mimic the activities and the physiological strain of wildland firefighters (Rodríguez-Marroyo et al., 2012). Each round was divided into 4 sections with characteristic activities (see Figure 1): marching uphill and downhill with a 20 kg backpack (HC20), hitting the fire swatter, hosing, and marching uphill/downhill (HC20) again, each with a duration of 5 minutes. After completion the first round and having a break of 10 min- utes, the second round was carried out. On average, ambient temperature and relative humidity were 32.2 ± 2.1
C and 41.7 ± 5.2 (%). The duration of the overall test session (i.e., including the psychological pretest and post-test assessment) was 96.5 ± 42.8 min. Considering the field test protocol itself, the duration was 54.9 ± 2.7 min for those who completed the two rounds of the test. For those who performed only a shortened version of the field test (i.e., RJ07, RJ08 and RJ09), the duration was 26.0 ± 4.3 min. As intended, the participants experienced high to very high levels of cardiovascular and thermoregulatory strain. The mean gastrointestinal temperature (Tgi) was M ≥38
C, which is considered the threshold of hyperthermia (e.g., mild hyper- thermia) in occupational settings (NIOSH, 2016). In the current study, chest skin temperatures ranged from 34.0 to 37.7
C (i.e., moderate to high skin temperature), being the upper value of the skin temperature range close to maximal skin blood flow perfusion level (Nybo et al., 2014). In line with the
Validation of Wearable Biosignal Sensor-Based Estimation of the Physiological Strain Index 59
behavior of Tgi, the average HR values assume a moderate effort intensity of around 78% of each participant maximal heart rate (i.e., HRmax).
Data collection. We used 12 out of the 13 available data sets from the wildland firefighters that were recorded during the field tests in Rijeka. One dataset (subject RJ11) was discarded due to many artefacts in the heart rate (HR) signal. In addition, from the available datasets, only the time intervals covered by all necessary bio-signals were used. In some cases, artefacts or non-valid intervals of values were also excluded from the ML training. For the training of the non-linear model, we used gold standard data recorded by the Universidad de León in Croatia. After data cleaning, 971 of the original 1736 data sample vectors of the 12 subjects remained to train the non-linear models.
Results of regression estimation. We trained and validated several linear and non-linear models on the Rijeka data. These models included Linear Regressions, Multilayer Perceptron Networks, Gaussian Progress Regression (Rasmussen and Williams, 2006), Support Vector Regression, Kernel Regres- sions and Regression Trees. For the training and validation, we resampled the data on a basis of 1-minute time intervals and applied 5-fold cross-validation. We used the MATLAB2 implementation of all models that are mentioned in Table 1 and found the minimum RMSE by the GPR method. The GPR model is based on a nonparametric kernel-based probabilistic attempt; the best per- forming kernel on the clean data was the exponential one (SigmaL = 2.404, SigmaF = 0.724). We used a constant basis function, an “exact” fitting method and a “random” active set method. The remaining model parameters are Beta = 38.017, Sigma: 0.195 and LogLikelihood = −242.504. The vali- dation using 5-fold cross-validation on the data resulted in RMSE = 0.279
C and a mean squared error (MSE) of 0.078
C (see Table 1). Note that we learned the core body temperature and used the predicted value for the subsequent PSI calculation.
Table 1. Performance of various machine learning-based linear and nonlinear function approximations for the estimation of CBT, characterized by RMSE based validation error. GPR is marked yellow and performed best.
The course of data presented in Figure 3a provides insight into the differ- ence between the gold standard CBT measure (in blue) – taken as ground truth – and the predicted CBT (in red). Figure 3b and Figure 3c show the scatter plots of PSI and fitted/estimated PSI comparing the solution between the linear model (left) with the GPR model (right) on artefact-adjusted data when using fixed, pre-determined min/max heart rate and skin temperature values. The x=y diagonal represents a theoretically perfect match. Table 2 provides the results for a performance comparison between PSI and estimated PSI using fixed min/max values for the input parameters heart rate and skin temperature. The first line shows results for taking the raw skin temperature for the PSI*, the second line for estimating PSI by a linear model and the third line for estimating PSI by GPR model on the whole (left) and valid data (right).
Figure 3: Performance of predicting CBT using GPR. (a) Course of data showing the dif- ference between the gold standard CBT measure (in blue) - taken as ground truth - and the predicted CBT (in red). (b, c) Scatter plots of PSI and fitted/estimated PSI* com- paring linear model (left) with GPR model (right) on artefact-adjusted data. The error measures denote absolute errors (M, SD) as well as RMSE.
Validation of Wearable Biosignal Sensor-Based Estimation of the Physiological Strain Index 61
Table 2. Performance comparison in terms of absolute errors (M, SD) as well as RMSE between PSI and estimated PSI using fixed min/max values for the input parameters heart rate and skin temperature.
Table available in the original PDF paper.
Method Error on whole data Error on valid data
M SD RMSE M SD RMSE PSI vs. estimated PSI (using PSI*) 1.764 2.303 2.900 0.883 0.575 1.054 PSI vs. estimated PSI (linear model) 1.587 1.476 2.167 1.026 0.640 1.209 PSI vs. estimated PSI (GPR model) 0.525 0.755 0.920 0.151 0.185 0.238
Equation reproduced from the original PDF.
CONCLUSION AND FUTURE WORK This work presented an attempt to develop and validate AI-based function approximators for a precise estimation of CBT and, finally, of the PSI, to enable accurate early alerts for physiological collapse. First results using GPR as a model for the estimation of CBT and PSI on field trial data of first responders, i.e., wildland firefighters, demonstrate that GPR appears to be a valuable ML design for this objective. In a future work, we will use heart rate variability (HRV), ambient temperature as well as humidity as additional input feature dimensions and validate if this could improve the results.
In the context of applying PSI for appropriate thresholding at the work- place, Davey et al. (2021) highlighted the relevance of hyperthermia-induced fatigue (HIF) as well as heat-related illnesses, both of which can be consid- ered to cause an individual to reach a thermal tolerance limit. These issues are of a major concern to the industry as they can lead to accidents and absen- teeism and can negatively affect the health and safety of workers (Flouris et al., 2018; Seppänen and Fisk, 2005). In this context, Davey et al. (2021) proposed to consider in addition a perception-based version of the PSI, i.e., PeSI by Tikuisis et al. (2002), replacing heart rate and core temperature with temperature sensation and RPE and using the upper limits of the perceptual scales (13 = intolerably hot and 10 = maximal exertion) as critical values.
The model for the development of the new AI-based estimator for phys- iological strain indexing was based on the knowledge about human physi- ology, in particular, physiological strain provided by Universidad de León, and the expertise on digital technologies including the development of the AI-based methodology was contributed by the JOANNEUM RESEARCH Forschungsgesellschaft mbH.
ACKNOWLEDGMENT
This work was funded from the project SIXTHSENSE (grant No 883315) of the Horizon 2020 research and innovation program of the European Com- mission as well as by the project FAIRWork (grant No 101069499) of the Horizon Europe research and innovation program of the European Com- mission. We are cordially thankful for the great support of the wildland firefighters of Rijeka (Croatia), Postojna (Slovenia) and Gumpoldskirchen (Austria).
REFERENCES
Belval, L. N. (2016). Prediction of Internal Body Temperature using Machine Learning Models, Master’s Thesis, 902, University of Connecticut, 2016. https://digita lcommons.lib.uconn.edu/gs_theses/902 Buller, M. J., Latzka, W. A., Yokota, M., Tharion, W. J., and Moran, D. S. (2008). A
real-time heat strain risk classifier using heart rate and skin temperature. Physiol. Meas. 29. doi: 10.1088/0967-3334/29/12/N01. Buller, M. J., Tharion, W. J., et al. (2013). Estimation of human core temperature from sequential heart rate observations. Physiol. Meas. 34: 781–798, 2013. doi: 10.1088/0967-3334/34/7/781. Buller, M. J, Welles, A. P., and Friedl, K. E. (2018). Wearable physiological monitoring
for human thermal-work strain optimization, Appl. Physiol. 124: 432–441, 2018. doi: 10.1152/japplphysiol.00353.2017. Carballo-Leyenda, B; Villa, J. G., Collado, P., Suárez-Iglesia, D., and Rodríguez- Marroyo, J. A. (2023). A new model to predict wildland firefighters’ thermophys- iological strain: the approach of the Sixthsense Project. Proc. 8th International Wildland Fire Conference, Porto, (Portugal), May 16–19, 2023. Daanen, H. A. M., Kohlen, V., and Teunissen, L. P. J. (2023). Heat flux systems
for body core temperature assessment during exercise. J. Therm. Biol., 112. doi: 10.1016/j.jtherbio.2023.103480. Davey, S. L., Downie, V., Griggs, K., and Havenith, G. (2021). The physiological strain index does not reliably identify individuals at risk of reaching a thermal tolerance limit. Eur. J. Appl. Physiol. 121(6):1701–1713. doi: 10.1007/s00421- 021-04642-3. Dolson, C. M., et al. (2022). Wearable Sensor Technology to Predict Core Body Tem-
perature: A Systematic Review. Sensors 2022, 22, 7639. doi: 10.3390/s22197639. Düking, P., Fuss, F. K., Holmberg, and H.-C., Sperlich, B. (2018). Recommendations for Assessment of the Reliability, Sensitivity, and Validity of Data Provided by Wearable Sensors Designed for Monitoring Physical Activity. JMIR Mhealth Uhealth, 6, e9341. Flouris, A. D., et al. (2018). Workers’ health and productivity under occupational
heat strain: A systematic review and meta-analysis. Lancet Planet Health 2(12): e521–e531. doi: 10.1016/S2542-5296(18)30237-7. Moran, D. S, Shitzer, A., and Pandolf, K. B. (1998). A physiological strain index to evaluate heat stress. Am. J. Physiol. 275, R129–34. doi: 10.1152/ajpregu.1998.275.1. R129. Mueller, S. T., Hoffmann, R. R., Clancey, W., Emrey, A., and Klein, G. (2019). Explanation in Human-AI Systems: A Literature Meta-Review, Synopsis of Key Ideas and Publications, and Bibliography for Explainable AI. arXiv, 1902.01876. doi: 10.48550/arXiv.1902.01876. National Institute for Occupational Safety and Health (2016). Occupational expo-
sure to heat and hot environments: revised criteria 2016. DHHS Publ. 2016–106, 1–159. Nazarian, N., et al. (2021). Project Coolbit: Can Your Watch Predict Heat Stress and Thermal Comfort Sensation? Environ. Res. Lett. 2021, 16, 034031. Nybo, L., et al. (2014). Performance in the heat-physiological factors of importance
for hyperthermia-induced fatigue. Compr. Physiol. doi: 10.1002/cphy.c130012. Rasmussen, C. E., and Williams, K. I. (2006). Gaussian Processes for Machine Learning. MIT Press, 2006, ISBN 026218253X. Rodríguez-Marroyo, J. A., López-Satue, J., Pernía, R., Carballo, B., García-López, J.,
Foster, C., and Villa, J.G.(2012). Physiological work demands of Spanish wildland firefighters during wildfire suppression. International Archives of Occupational and Environmental Health 85, 221–228. doi: 10.1007/s00420-011-0661-4.
Validation of Wearable Biosignal Sensor-Based Estimation of the Physiological Strain Index 63
Seeberg, T. M., et al. (2013). Decision Support for Subjects Exposed to Heat Stress. IEEE J. Biomed. Heal. Informatics 17, 402–410. doi: 10.1109/JBHI.2013.2245141. Seppänen, O., and Fisk, W. J. (2005). Control of temperature for health and productivity in offices. ASHRAE Trans. 111, 680–686, Report Number: LBNL-55448. Tanaka, H., Monahan, K. D., and Seals, D. R. (2001). Age-Predicted Maximal
Heart Rate Revisited. J. Am. Coll. Card., 37(1), 153–156. doi: 10.1016/S0735- 1097(00)01054-8. Tikuisis, P., et al. (2002). Perceptual versus physiological heat strain during exercise-heat stress. Med. Sci. Sports Exerc., 34:1454–1461. doi: 10.1016/s1440- 2440(00)80080-8. Verdel, N., Podlogar, T., Ciuha, U., Holmberg, H.-C., Debevec, T., and Supej, M.
(2021). Reliability and Validity of the CORE Sensor to Assess Core Body Temper- ature during Cycling Exercise. Sensors 2021, 21, 5932. doi: 10.3390/s21175932. Wilkinson, D. M., Carter, J. M., Richmond, V. L., Blacker, S. D., Rayson, M. P. (2008).
The effect of cool water ingestion on gastrointestinal pill temperature. Med. Sci. Sports Exerc., 40:523–528. doi: 10.1249/MSS.0b013e31815cc43e. Yoshikawa, Y., and Iwata, T. (2020). Gaussian Process Regression with Interpretable Sample-Wise Feature Weights. IEEE Trans. Neural Networks & Learning Systems, 34(9), 5789–5803. doi: 10.1109/TNNLS.2021.3131234.
LISTED IN THE AHFE DIGITAL BOOKSTORE CATALOGUE
Explore the complete digital volume
Cognitive Computing and Internet of Things
Read this individual research paper free through the original publisher, or explore the full digital proceedings book.
ISBN 978-1-964867-00-7
Explore this ISBN in the AHFE Bookstore ↗Listed in the July 2026 bookstore catalogue; search by ISBN to confirm current availability · Digital book purchase optional