Peng Liu, Yi Wang (2023). Analysis of Agglomeration Characteristics of Public Service Facilities in Mountainous Villages and Towns Based on POI Data. In: Application of Emerging Technologies. AHFE Open Access, vol. 115, pp. 284–293. https://doi.org/10.54941/ahfe1004325
This paper obtains the population data and GDP data of 13 counties in the Aba Tibetan and Qiang Autonomous Prefecture of Sichuan Province, China based on the government statistical data set, obtains the POI data based on the Gaode map, and uses Average Nearest Neigh Index, Kernel Density Analysis, Standard Deviation Ellipse, Pearson Correlation Analysis method to analyze the agglomeration characteristics of public service facilities in each county and its correlation with the level of economic development. The results show that: the public service facilities in the study area as a whole show a spatial pattern of "more in the southeast and less in the northwest"; the spatial agglomeration of various public service facilities is significant, and the degree of agglomeration of tourism-related public service facilities such as catering and shopping is the highest , financial insurance, science, education and other life-related public service facilities have the lowest degree of agglomeration; all kinds of public service facilities are in the direction of "southwest-northeast" as a whole, and public service facilities related to outdoor activities such as sports, leisure and accommodation have the strongest directionality; the research area The spatial agglomeration of public service facilities is affected by factors such as nature and economic development.keywords:POI, mountain villages and towns, public service facilities, agglomeration characteristics
Public service facilities refer to spaces that provide various public services for urban and rural residents, including basic service facilities such as educa- tion, culture, sports, healthcare, commerce, finance, and community services (Kiminami et al., 2006). The spatial layout of public service facilities directly affects the quality of production and life of urban and rural residents. Its dis- tribution and configuration issues have attracted attention from fields such as geography, planning, management, and economics, including the configura- tion mechanism of public service facilities (Greenhut and Mai, 1980), public satisfaction (Michalos and Zumbo, 1999), location distribution (Langford et al., 2008), and plot characteristics (Liu and Long, 2016).
POI data is widely distributed and easy to obtain (Yang et al., 2019), and has been used for research on the layout of urban and rural public service
Analysis of Agglomeration Characteristics of Public Service Facilities 285
facility elements at multiple scales. The research mainly focuses on the charac- teristics of facility spatial layout (Zhai et al., 2017), equalization and fairness issues (Zhao and Zhang, 2020), and the correlation between other spatial elements and facility distribution (Zhao et al., 2018). The analysis meth- ods include facility clustering analysis based on the average nearest neighbor method (Luo and Zhang, 2021), distribution feature analysis based on kernel density analysis (Ning et al., 2020), spatial development direction predic- tion based on standard deviation ellipse analysis (Guo and Liu, 2021), and influencing factor analysis based on Pearson correlation analysis (Pei et al., 2018). This article is based on the national population census data, per capita GDP data, and POI data of Aba Tibetan and Qiang Autonomous Prefecture. Using nearest neighbor index, kernel density analysis, standard deviation ellipse, and Pearson correlation analysis methods to present the spatial agglomeration characteristics of facilities in each county and explore the rela- tionship between economic development level, population migration rate, and the distribution of various service facilities.
METHODOLOGY
Study Area The location of Aba Tibetan and Qiang Autonomous Prefecture (hereinafter referred to as Aba Prefecture) is 30
5′N-34
9′N, 100
0′E-104
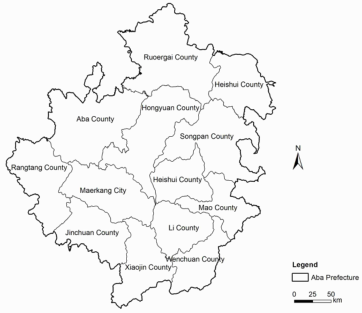
7′E. It is sit- uated on the southeastern edge of the Qinghai-Tibet Plateau and belongs to the northwest mountainous area of Sichuan Province, China. It governs 1 county-level city and 12 counties (Figure 1), with a total area of 84242 square kilometers. Aba Prefecture is located in a remote area, with frequent disasters and underdeveloped economy, making it highly representative and unique among mountainous villages and towns. On the other hand, Aba Prefecture has magnificent natural scenery and profound cultural heritage. Under the leadership of the comprehensive tourism strategy, Aba Prefecture has gradually formed an industrial structure mainly consisting of agricul- ture, animal husbandry, tourism, and hydropower. The distribution of public service facilities in the region is of great significance for regional development.
Figure 1: County level administrative division map of Aba Prefecture.
286 Liu and Wang
Data Collection The population data is sourced from the sixth national population census data of Aba Prefecture in 2011 and the seventh population census data of Aba Prefecture in 2021; The per capita GDP data used to characterize the level of economic development is sourced from the 2019 government work report of Aba Prefecture. This paper calculates the population migration rate based on population data, and the expression is as follows:
R = 1 −M0/M1 (1) In the formula: R is the population migration rate, M0 represents the data of the sixth national population census, M1 is the data from the seventh national population census.
The POI point data used to characterize the richness of facilities is sourced from the Gaode Map API,which screened 23 types of POI.This paper selected 12 types of POI point data that represent regional vitality levels and public services for research, including catering services, shopping services, living ser- vices, accommodation services, sports and leisure services, cultural services, transportation services, healthcare services, financial services, scenic spots, administrative agencies, and companies facilities.
The source of administrative division data is the 1:1 million national basic geographic database provided by the National Catalogue Service For Geographic Information (http://www.webmap.cn). The research adopts the CGCS2000 3 Degree GK CM 102E Projected Coordinate System.
Data Analysis Average Nearest Neigh Index. The average nearest neighbor index is a spatial econometric method that quantitatively describes the proximity of spatial point like elements and judges their spatial pattern characteristics (Huang et al., 2021). The calculation formula is:
Equations and mathematical formulas are available in the original paper PDF.
In the formula: ANN represents the average nearest neighbor index; D0 represents the average observation distance between each element and the nearest element; DE represents the expected average distance between ele- ments in a random pattern; n is the quantity of elements; A is the area of the study area. The study adopts the average nearest neighbor index analysis method to study the agglomeration of various public service facilities. When ANN<1, the trend of factor distribution is agglomeration, and the smaller the ANN value, the higher the degree of agglomeration; When ANN = 1, the trend of factor distribution follows the model; When ANN>1, the trend of factor distribution is discrete, and the larger the ANN value, the higher the degree of dispersion.
Analysis of Agglomeration Characteristics of Public Service Facilities 287
Kernel density analysis. The kernel density analysis method calculates the data aggregation status within the research scope through input, reflecting the spatial relative concentration degree of point element distribution. The calculation formula is:
In the formula, f(x) is the kernel density calculation function of spatial position x; n is the number of elements whose distance from the spatial posi- tion x is less than or equal to r; k is the spatial weight function; r is the distance attenuation threshold. Its geometric significance in space is that the kernel density value reaches its maximum at each core element xi, and contin- uously decreases as it moves away from the core element xi. Until the distance from xi reaches the threshold r, the kernel density value drops to 0.
Standard deviation ellipse analysis. The standard deviation ellipse analysis method quantitatively describes the spatial distribution trend and evolution characteristics of the research object by using spatial distribution ellipses with center point, azimuth, major half axis, and minor half axis as basic parame- ters. The center point of the ellipse represents the center position of the entire data, the long half axis represents the direction of data distribution, and the short half axis represents the range of data distribution (Huang et al., 2021). The calculation formula is: Average center:
Pn
Pn
n X
i (8)
ωiey2
n X
n X
n X
i − i
i (9)
v u u t
ωiex2
ey2
ωi2ex2
ωiexi cos θ−ωieyi sin θ
v u u t
2 Pn
288 Liu and Wang
Y-axis standard deviation: Pn
ωiexi sin θ−ωieyi cos θ
v u u t
2 Pn
i = 1 ωi2 (12) In the equation: (Xω, Yω) is the central coordinate of the ellipse; (xi, yi) is the coordinate of i; ωi is the weight; θ is the azimuth angle; exi, eyi is the deviation between the coordinates of i and the center of the ellipse; ρx, ρy rep- resents the standard deviation along the major and minor axes, respectively, and represents the values of the major and minor axes of the ellipse.
Pearson correlation analysis. Use Pearson correlation analysis to examine the correlation between population migration rate, GDP, and service facility distribution.
RESULTS
Distribution Results of Various Service Facilities The overall spatial agglomeration of various service facilities is significant, with different spatial agglomerations. According to the calculation results of the nearest neighbor index (Table 1), it can be seen that: (1) The nearest neighbor index ANN of various service facilities is less than 1, showing a clear spatial clustering feature. The spatial agglomeration of various service facilities varies. Firstly, the nearest neighbor index of tourism related public service facilities such as catering services, shopping services, and accom- modation services is the smallest (0.09-0.10), exhibiting extremely strong clustering characteristics. (2) The nearest neighbor index of public service facilities related to daily life, such as life services, financial services, sports and leisure services, transportation services, administrative agencies, cultural services, and healthcare services, is relatively high (0.19-0.27), showing a strong clustering feature. (3) The nearest neighbor index of companies and scenic spots is the highest (0.29-0.41), showing a strong clustering feature.
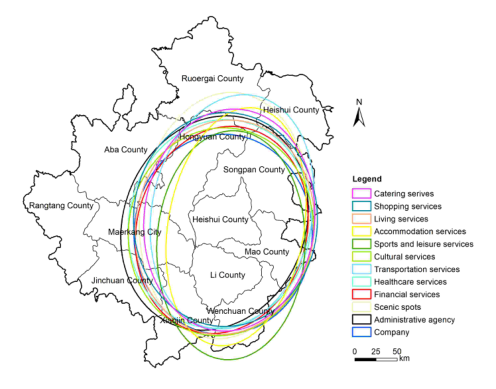
The distribution trend of various public service facilities is generally sim- ilar, with similar distribution among different types. From the standard deviation ellipse analysis results (Figure 2), it can be seen that: (1) From the shape of the standard deviation ellipse, the distribution direction of various service facilities is generally southwest northeast, which basically conforms to the three-point growth pole layout in the prefecture, namely, Maerkang City, Jiuzhaigou County, Wenchuan County and Mao County. (2) From the long axis of the standard deviation ellipse of various facilities, the long axis of scenic spots and transportation service facilities is in the direction of Jiuzhaigou County. (3) From the elliptical shape of the standard deviation of various facilities, accommodation services and sports and leisure services have the strongest directionality.
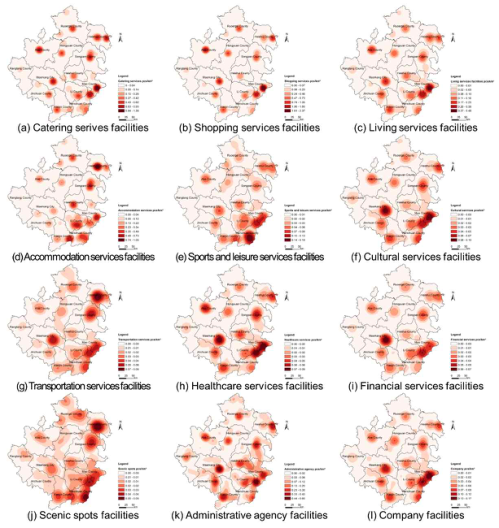
The spatial distribution of various public service facilities varies. Accord- ing to the results of kernel density analysis (Figure 3), it can be seen that: (1) The high-density areas of various service facilities are generally concentrated in the centers of each county, and the overall density presents a pattern of
Analysis of Agglomeration Characteristics of Public Service Facilities 289
“high in the southeast and low in the northwest”. (2) The aggregation of four types of facilities, namely catering, shopping, living services, and health- care services, that serve basic daily needs, is relatively balanced in the centers of each county. (3) The balance of accommodation services, sports and leisure services, cultural services that serve spiritual and cultural needs is poor, show- ing a trend of high in the east and low in the west. (4) The scenic spots and transportation service facilities that support tourism development are densely distributed in the east and middle. The high-density belt is concentrated in Wenchuan County, Mao County and Jiuzhaigou County on the east edge of Aba Prefecture, and the high-density belt connects Markang City and Ruoergai County. (5) Companies, financial services that support economic development have shown two growth poles: Maerkang City, Wenchuan County, and Mao County.
Table 1. POI facility nearest neighbor index calculation results.
Table available in the original PDF paper.
Sports and leisure services facilities
Accomm-odation services facilities
Category Catering serives facilities
Shopping services facilities
Living services facilities
Cultural services facilities
0.22 0.19 0.74 1.04 0.25 1.57
ANN 0.09 0.09 0.19 0.21 0.10 0.26 Average observation distance/km
ANN 0.21 0.41 0.24 Average observation distance/km
5.77 6.17 7.14 6.60 2.59 4.99
Expected average distance/km Score -38.52 -38.17 -31.51 -28.41 -94.00 -43.30
Figure 2: Ellipse of standard deviation for various service facilities in Aba Prefecture.
290 Liu and Wang
Figure 3: Analysis of kernel density of various service facilities in Aba Prefecture.
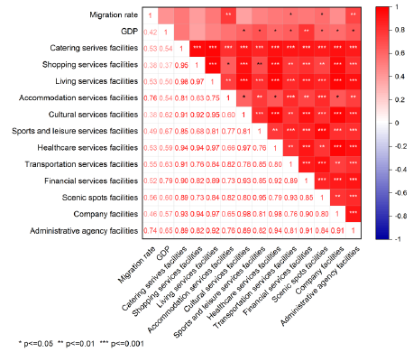
Correlation Analysis Results of the Distribution of Various Service Facilities Pearson correlation analysis was conducted on the population migration rate, GDP, and density of various facilities in each county. The results (Figure 4) show that the population migration rate is significantly positively correlated with the density of accommodation services, administrative agencies, trans- portation services, and scenic spots facilities; GDP is significantly positively correlated with culture, sports, health, transportation, finance, scenic spots, administrative agencies, company facilities.
Figure 4: Correlation analysis results of density of various service facilities with population migration rate and GDP.
Analysis of Agglomeration Characteristics of Public Service Facilities 291
DISCUSSION
Differences in Facility Density Due to Geographical Advantages In mountainous villages and towns in Aba Prefecture, various public service facilities tilt towards the areas near Chengdu Plain, administrative centers, and popular tourist attractions. Firstly, the convenient transportation in Wenchuan County, Mao County, and other areas near the Chengdu Plain is the foothold of the concept of “high mountains towards dams, small cities towards big cities” in the northwest counties. Adjacent to the Chengdu Plain, it has a rich range of business formats, corresponding to a variety of pub- lic service facilities with high density. Secondly, as the administrative center of Aba Prefecture, Maerkang City has a significant resource agglomeration effect brought about by regional level, and various public service facili- ties gather here; Correspondingly, the administrative centers of each county gather over half of the public service facilities at the community level. Finally, as one of the oldest and most important natural resources in Aba Prefec- ture, Jiuzhaigou Valley Scenic and Historic Interest Area Scenic Area has rich public service facilities around it.
Differences in Facility Distribution Caused by Different Industrial Structures Under the guidance of the government’s comprehensive tourism develop- ment strategy, the agglomeration of tourism related public service facilities such as accommodation and catering is the strongest. In order to attract tourists, tourism facilities are distributed around important cultural scenic spots, resulting in a strong agglomeration of tourism service facilities. Public service facilities for cultural, healthcare and other daily needs are distributed in various mountainous villages and towns. Secondly, the long axis of scenic spots and traffic service facilities is towards Jiuzhaigou County, which is in line with the objective reality that Jiuzhaigou Valley Scenic and Historic Interest Area County is a strong tourist hotspot. Finally, tourism related accommodation service facilities have the strongest directionality, with obvi- ous clusters in the southeastern part of Aba Prefecture, Maerkang City, and east of Hongyuan County. This is because tourism is the main industry in the southeast of Aba Prefecture, while agriculture and animal husbandry are the main industries in the northwest.
Differences in the Number of Facilities Caused by the Level of Economic Development With the process of urbanization development, the indicators for measuring the economic development level of mountainous villages and towns include not only the commonly used GDP, but also the population migration rate. Mountain villages and towns with high levels of economic development have higher levels of personnel mobility and population migration. Based on the correlation analysis results, it can be concluded that mountainous villages and towns with higher levels of economic development have a higher density of public service facilities. At the same time, regions with high levels of economic
292 Liu and Wang
development have high levels of development in cultural, sports, financial, corporate and other service facilities, thus forming a spatial pattern of “more in the southeast and less in the northwest” for public service facilities.
CONCLUSION
The results indicate that the overall public service facilities in the study area exhibit a spatial pattern of “more in the southeast and less in the northwest”; Various types of public service facilities are highly concentrated around administrative centers, with tourism related public service facilities such as catering and shopping having the highest concentration, while life related public service facilities such as finance, culture have the low concentration; All kinds of public service facilities are in the direction of “southwest north- east”, covering the administrative center of Aba Prefecture, Maerkang City, the famous natural resources Jiuzhaigou County, Wenchuan County and Mao County near the Chengdu Plain. Among them, public service facilities related to tourism activities such as sports and accommodation are the most direc- tional. The spatial agglomeration of public service facilities in the research area is jointly influenced by factors such as nature, industrial structure, and economic development.
Based on this, research recommendations: Firstly, strengthen the allocation of various public service facilities in the northwest of the region and increase the number of various public service facilities in the region. Secondly, promote the balanced distribution of public service facilities in mountainous villages and towns, with a focus on developing the allocation of facilities in township centers to promote fair resource allocation; Finally, pay attention to the living needs of residents and further improve the configuration of public service facilities for daily life such as culture, healthcare, and finance.
ACKNOWLEDGMENT
This study is the result of the revised paper on Big Data and Urban Planning course at the School of Architecture, Tsinghua University. We would like to express our gratitude to Professor Long Ying and teaching assistants Zhang Enjia, Hou Jingxuan, and Li Weijian for their valuable opinions on the paper.
REFERENCES
Greenhut, M. L., Mai, C. C. (1980). Towards a general theory of public and private facility location. Ann Reg Sci 14, 1–11. Guo, Y., Liu, M. (2021). Classification and Spatial Distribution Characteristics of
Tourist Attractions in Shanxi Province Based on POI Data. Scientia Geographica Sinica 41, 1246–1255. Kiminami, L., Button, K., Nijkamp, P. (Eds.) (2006). Public Facilities Planning.
Edward Elgar Publishing Ltd, Cheltenham. Langford, M., Higgs, G., Radcliffe, J., White, S. (2008). Urban population distribution models and service accessibility estimation. Computers, Environment and Urban Systems 32, 66–80. Liu, X., Long, Y. (2016). Automated identification and characterization of parcels
with OpenStreetMap and points of interest. Environ. Plan. B-Plan. Des. 43, 341–360.
Analysis of Agglomeration Characteristics of Public Service Facilities 293
Luo, Z., Zhang, Y. (2021). Analysis on the Distribution of Vitality Spaces in Main Urban Areas of Chengdu City Based on POI Big Data. Industrial Construction 51, 53–61. Michalos, A. C., Zumbo, B. D. (1999). Public Services and the Quality of Life. Social
Indicators Research 48, 125–156. Ning, Z., Wang, T., Yang, C. (2020). Spatio-temporal Evolution of Tourist Attractions and Formation of Their Clusters in China since 2001. Geographical Research 39, 1654–1666. Pei, Y., Wu, Q., Tang, Y., Li, T., Long, Y. (2018). Analysis on Night of Streets and
Its Impact Factors within the 2ND-ring Road of Beijing Based on Spatial Data. Urbanism and Architecture 111–116. Yang, Z., He, X., Sui, X., Zhang, J. (2019). Analysis of the Evolution of Urban Center Space Based on POI: A Case Study of Main Area in Kunming. Urban Development Studies 26, 31–35. Zhai, X., Sun, X., Sun, Z. (2017). Research on the Quantity and Distribution Char-
acteristics of Public Cutural Facilities in Central Area of Zibo City Based on POI Data. Journal of Shandong Normal University (Natural Science) 32, 73–79. Zhao, H., Yu, D., Miao, C., Li, G., Feng, Y., Bie, Q. (2018). The Location Distribution Characteristics and Influencing Factors of Cultural Facilities in Zhengzhou Baesd on POI Data. Scientia Geographica Sinica 38, 1525–1534. Zhao, S., Zhang, W. (2020). Characteristics of Spatial-Temporal Evolution and
Accessibility of public Cultural Facilities in Beijing. Urban Development Studies 27, 7–12.
LISTED IN THE AHFE DIGITAL BOOKSTORE CATALOGUE
Explore the complete digital volume
Application of Emerging Technologies
Read this individual research paper free through the original publisher, or explore the full digital proceedings book.
ISBN 978-1-958651-91-9
Explore this ISBN in the AHFE Bookstore ↗Listed in the July 2026 bookstore catalogue; search by ISBN to confirm current availability · Digital book purchase optional