Our motivation is to apply the principles of Slow Design to the research on calculating carbon footprints, specifically by creating more “conscious” and “visible” interactive ways to inspire users to actively engage in the formation of their carbon footprint and gain more positive experiences from it. With the United Nations promoting the Sustainable Development Goals (SDGs), there is an increasing number of carbon footprint calculation applications available. However, users need to accumulate long-term usage to provide estimates of their impact on both personal and environmental aspects and further receive recommendations for sustainable living. In the book "User Friendly," Kuang and Fabricant (2020) reveal that climate change can be a feedback problem. They state, "We don't know how much carbon we emit daily, and the target timelines are set too far in the future, making the effects invisible. Imagine if the effects of carbon emissions were exactly the same as they are now, but the accumulation of carbon turned blue into green. In such a world, it's hard to believe that anyone would still talk about whether human activities have any impact on the climate...." Therefore, we hope to leverage Slow Design to foster an emotional connection to this interactive behavior, enhance the cognitive model of actions, and bring about sustainable benefits. To achieve the application of Slow Design principles in the research on calculating carbon footprints, we employ creative ideation and design research methods, including (1) studying relevant literature and cases, (2) interacting with potential users and conducting interviews, (3) creating and testing low-fidelity prototypes, and discussing recommendations and strategies for carbon footprint calculation. These research findings can serve as references for future studies on Sustainable Development Goals.■ Slow Design and Carbon FootprintWe apply the principles of Slow Design to the research on calculating carbon footprints. Slow Design is a design philosophy inspired by the Slow Living movement in 1986, advocating for slowing down the pace of life and countering the fast-paced lifestyle and culture of mass consumption. It contrasts with the culture of fast consumption and immediate gratification, emphasizing sustainability and respecting human needs and the environment. Slow Design focuses on quality, details, and experiences to provide more meaningful and sustainable design solutions. On the other hand, Slow Design Computing is a concept that combines the principles of Slow Design with computer science. It adopts the values and principles of Slow Design and applies them to the field of computer science and digital technology.■ Calculation and Case EvaluationThe carbon footprint calculation method is a way to assess the greenhouse gas emissions produced by an individual, household, organization, or product. These emissions are typically expressed in terms of carbon dioxide equivalent (CO2e). The methods for calculating carbon footprints can vary depending on the subject of calculation and the data used. Relevant literature (Batmunkh, 2022) and accounting software and platforms available on the market, such as MOZE 3.0 (2021), can be utilized for this purpose.■ References[1]C. Kuang and R. Fabricant, User Friendly: How the Hidden Rules of Design Are Changing the Way We Live, Work, and Play. USA: Picador, 2020.[2]L. MOZE Co., "MOZE 3.0," ed. Taiwan, 2021.[3]A. Batmunkh, "Carbon Footprint of The Most Popular Social Media Platforms," Sustainability, vol. 14, no. 4, p. 2195, 2022, doi: 10.3390/su14042195.
In human-computer interaction, the focus on ‘user behavior change’ grows, targeting greener, more sustainable products. The United Nations’ Sustain- able Development Goals (SDGs) have been a global call to action since 2016 (United Nations, 2015). These goals stress the interdependence of poverty eradication and strategies like economic growth, education, health, and environmental protection.
The pursuit of this goal has sparked the creation and use of numerous plat- forms and apps for calculating carbon footprints. These tools allow users to gauge their impact on the environment and receive suggestions for sustain- able living based on long-term data. In the realm of sustainable design, the concept of ‘slow design’ also plays a role. Coined by Fuad-Luke (2005), it advocates a decelerated approach in contrast to the fast-paced consumption culture. Slow Design prioritizes quality, details, and experiences for mean- ingful and sustainable solutions, standing against instant gratification and excessive consumption.
However, obtaining a carbon footprint differs from acquiring information like daily caloric intake or daily expenses. Our recording habits for calo- ries consumed from food or expenses incurred while purchasing items have
Carbon Footprint Interaction Through Slow Design Computing and Visual Design 447
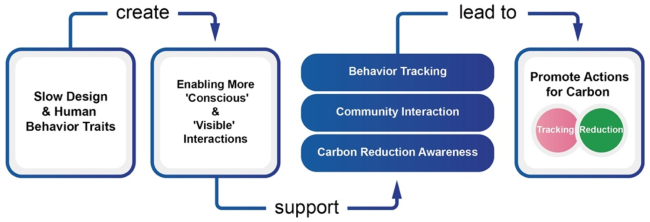
been established for years. What sets these apart even more is that we can physically interact with calories – through food – and money when buy- ing products, whereas carbon emissions remain beyond the foreseeability of the naked eye. As a result, we endeavor to apply the principles of slow design to the design research of calculating carbon footprints. Specifically, our aim is to create more “conscious” and “visible” forms of interaction, motivating users to actively engage in carbon auditing and derive more pos- itive experiences from it. Through the application of slow design, we aspire to enhance users’ emotional connection to this interactive behavior, thereby yielding sustainable benefits (see Figure 1).
Figure 1: The design problem and design objectives.
BACKGROUND
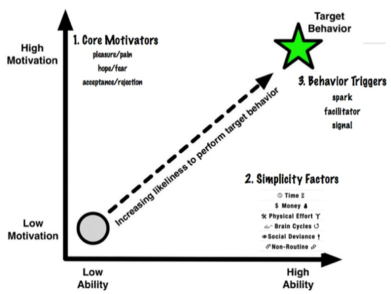
Three Distinct Factors Fogg, a professor of Human Behavior at Stanford University, introduced a pioneering model known as the FBM, offering a fresh perspective on com- prehending human behavior (Fogg, 2009a). Within this model, behavior is conceived as a convergence of three distinct factors: motivation, ability, and triggers. Each of these factors encompasses a range of subcomponents (see Figure 2). The FBM framework asserts that, for an individual to engage in a desired behavior, they must possess (1) adequate motivation, (2) the requisite ability to perform the behavior, and (3) a triggering event that propels the behavior into action. Importantly, all three factors must align concurrently, or the behavior will remain unrealized. This framework provides a shared platform for considering and conceptualizing patterns of behavior change, making it a valuable asset in the context of research and discussions.
After reviewing design works from students and companies, he identified one prevalent reason for the failure of certain designs—overambition. For instance, design teams might opt for a challenging behavior, like quitting smoking, as their design goal. While the idea of aiding people in quit- ting smoking might seem noble, the reality is that for long-term smokers, designing behavior without enduring impact, coupled with a lack of rele- vant design expertise on the part of the team, inevitably leads to failure. Fogg recommends a strategy of achieving success by building upon numerous small, measurable victories before tackling larger endeavors (Fogg, 2009b). This approach ensures a solid foundation of achievements and aligns with practical, attainable goals.
Figure 2: All three factors in the Fogg behaviour model have subcomponents (Fogg, 2009a).
Slow Technology Design Hallnäs and Redström (2001) propose that as technology becomes increas- ingly integrated into our lives, its role transcends mere efficiency enhance- ment. They advocate for a shift in designers’ perspectives towards creating “technology that surrounds us and becomes part of our lives for an extended period of time.” They introduce the concept of “Slow Technology,” which aims to evoke a heightened sense of the passing of time in everyday life, emphasizing gradual and subtle moments of the present. Their work empha- sizes the potential for reflective experiences when this gradual approach is applied within the framework of slow design. Consequently, slow technol- ogy exhibits an accumulative nature that emerges not solely from isolated interactions but from the continuous accumulation of experiences.
While the visionary concept of slow design holds promise, its abstract nature poses challenges for practical implementation by designers and researchers. To address this, Odom et al. (2021) merged slow technology with tool analysis to propose a structured framework. Odom and his team initially (1) formulated a working definition of slow technology by drawing from early research and literature. Subsequently, (2) they selected a specific group of physical objects for analysis and (3) meticulously examined their potential attributes related to “slowness.” The objects included Slow Doorbell, Pho- tobox, Olly, Slow Game, CrescendoMessage, Olo Radio, and Chronoscope. (4) The team connected these attributes with the initial definition, and (5) iterated through steps 3–4 until each analysis became more aligned with the concept of slowness. Finally, (6) they critically reviewed the initial theory, expanding it based on their findings.
Slow Design Computing Chang and Wu propose integrating slow design with computational meth- ods, utilizing its principles and values in the realm of computer sci- ence and digital technology (Chang et al., 2020). This approach seeks to explore individuals’ life trajectories and shed light on unseen issues.
Carbon Footprint Interaction Through Slow Design Computing and Visual Design 449
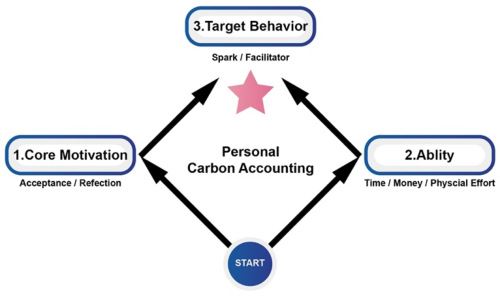
Inspired by Kuang and Fabricant’s work (2020), in “User Friendly”, they reveal that climate change can be a feedback problem due to its incon- spicuous nature. They state, “We don’t know how much carbon we emit every day... which makes the effects invisible. Imagine, for instance, that the effects of carbon emissions were exactly the same as they are now, except that the accumulation of carbon turned blue into green. In a world like that, it’s hard to imagine anyone discussing whether human activ- ity has any impact on the climate...” We endeavor to visualize carbon footprint data and amalgamate theories and methodologies from figures like Hallnäs and Odom. Through the application of slow design compu- tation, we aim to investigate the matter of personal carbon accounting (see Figure 3).
Figure 3: Three factors in personal carbon accounting of this study.
RELATED WORK
We reviewed relevant literature and cases, offering insights for future sus- tainable development research. Carbon footprint assessment methods vary, from spreadsheets to mobile apps. Existing global calculators like Global Footprint Network (2021) and United Nations (2015) cater to wide audi- ences. Nation-specific tools like Finland’s lifestyle test (Sitra, 2021) exist. In Taiwan, we have platforms like Carbon Footprint Information Platform (Environmental Protection Administration, 2023). Enterprise-focused tools are exclusive. Our study enhances user engagement and awareness in carbon auditing.
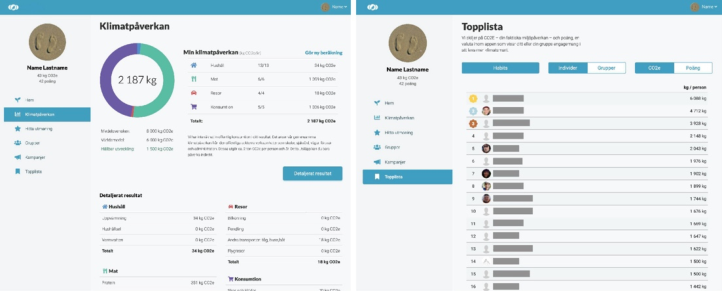
We applied the principles of slow design to carbon footprint calculation using a method that blends creative ideation and semantic analysis, influ- enced by Odom et al. This approach involves integrating gamification into the design, creating two behavior modes to enhance user interaction. We explored how gamification can bridge the awareness-behavior gap in carbon footprint calculators, as demonstrated by Biørn-Hansen et al. (2022). This combination fosters meaningful user engagement and promotes sustainable behavior change (see Figure 4).
Figure 4: Carbon footprint calculators with gamification (Biørn-Hansen et al., 2022).
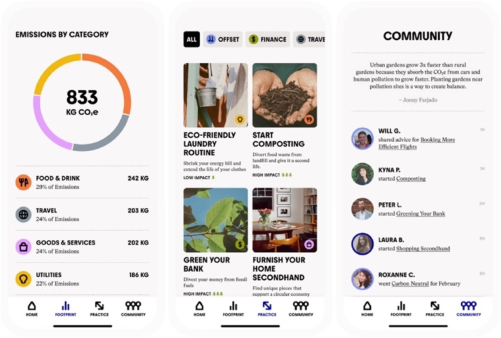
JORO (COMMONS, 2019) engages users post-login with questions regarding their daily carbon footprint elements, such as meat consumption frequency, household size, and air travel habits. Based on user responses, the platform offers tailored carbon reduction strategies, like shifting from daily to 4–5 times weekly meat consumption. Beyond offering concrete advice through consumption behaviour surveys and habit tracking, JORO recommends relevant carbon reduction courses and articles to enhance users’ strategies effectively. Moreover, JORO integrates with users’ credit cards to estimate carbon footprints per transaction. For instance, a $100 expendi- ture at Whole Foods or a prior survey indicating 3–4 times weekly meat consumption enables JORO to calculate user-specific carbon emissions (see Figure 5).
Figure 5: The user interface of JORO (COMMONS, 2019).
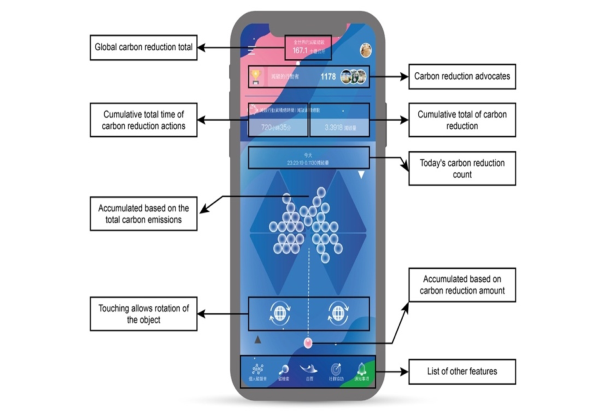
CARBON FOOTPRINT INTERACTION We introduce the Carbon Bubble Calculator (CBC), which visually links car- bon emissions to bubble imagery, symbolizing their generation, attachment, and release. This approach fosters a more ‘conscious’ and ‘visible’ interaction,
Carbon Footprint Interaction Through Slow Design Computing and Visual Design 451
enabling users to see their accumulated carbon footprint. This encourages ongoing engagement and positive experiences, extending beyond one-time calculator use. Next, we present our research extrapolation.
Persona We initially recruited 6 participants from diverse fields to gain insight into their awareness of carbon emissions. Through surveys, users were prompted to record aspects of their daily lives, encompassing: (1) time allocation, (2) behaviors related to food, transportation, accommodation, leisure, educa- tion, and other categories, and (3) duration of these activities. The participant profiles and recorded activities are detailed in Table 1 as follows:
Table 1. Participant’s activity records.
Table available in the original PDF paper.
Name DAVID (male, 30 years old) Description David is a computer engineer residing in Taipei City. He typically commutes to work in the morning by riding his motorcycle or taking the subway. He buys breakfast on his way. For lunch, he dines at restaurants near his workplace. In the afternoon, he walks home after work and buys a drink on the way.
Time Behavior Describe Remark
no use of disposable utensils
00:48-07:50 Sleep used air conditioning, electric fan - 08:10-08:25 Work subway commute 2 stops 08:30-08:33 Breakfast takeaway sandwich, large iced latte sandwich comes with packaging, personal reusable cup used for coffee 12:20-12:50 Lunch dine-in Hainanese chicken rice given disposable chopsticks and spoon set, plus four tissue paper sheets 18:20-18:50 Dinner dine-in minced pork noodles, blanched greens, deep-fried braised pork fresh milk tea, low sugar, light ice used a personal reusable cup 19:36-19:39 Beverage Purchase
1 hour and 18 minutes
19:45-20:05 Bicycle Ride Ubike (shared bicycle) approximately 1 kilometer 08:00-20:00 Walking accumulated walking from08:00-20:00
3 hours
20:30-00:48 Rest used computer, air conditioning, electric fan 20:30-00:48 Showering Showered, blow-dried hair 42 minutes 00:48- Sleep - -
During our attempt to collect questionnaire responses, we identified some noteworthy issues. Initially, participants seemed to associate carbon emis- sions mainly with transportation. To address this, we explained various carbon-producing factors early in the questionnaire collection, enabling a more comprehensive grasp of carbon emissions and facilitating broader data collection. Additionally, due to Taiwan’s “plastic reduction policies,” pro- moting reusable cups for beverages, participants often brought their own cups. However, this behavior wasn’t consistently reflected in their recorded actions. Lastly, participants’ lack of training in creative or concise thinking
led them to describe daily behaviors in complete sentences rather than break- ing them down into smaller actions, limiting the use of succinct vocabulary for recording purposes.
Data Cleaning Based on the collected data, we analyzed participants’ questionnaire logic, calculated emissions using the carbon footprint formula, and generated a preliminary.txt file. The data formats adhered to different standards (Corpo- ration, 2023; Environmental Protection Administration, 2023). Our research found that walking has a carbon emission factor of around 0, indicating it doesn’t directly emit carbon. We focused on its indirect impact: reducing the use of other transportation modes. The reduction in emissions depends on the activities participants chose while walking, like avoiding cars or other vehicles. After data organization, we compiled the following list:
Table 2. Participant’s activity records.
Table available in the original PDF paper.
No Time Describe Duration Unit Carbon Emissions(kg)
0.69
1 00:48-07:50 air conditioning 7.2 hour 2.3166 2 00:48-07:50 electric fan 7.2 hour 0.171072 3 08:10-08:25 subway commute 2.4 kilometer 0.096 4 08:30-08:33 sandwich 1 disposable packaging (0.0032) (0.00533)
5 08:30-08:33 iced latte 1 Eco-friendly cup Eco-friendly straw
(0.0032) (0.00533)
6 12:20-12:50 disposable chopsticks 1 pair of 0.05 7 12:20-12:50 disposable spoon 1 a 0.00603 8 12:20-12:50 tissue paper 4 sheets of 0.015 9 19:36-19:39 fresh milk tea 1 Eco-friendly cup Eco-friendly straw 10 19:45-20:05 Ubike 1 kilometer (0.096) 11 08:00-20:00 walking 78 minute 12 20:30-00:48 air conditioning 3.2 hour 1.0296 13 20:30-00:48 electric fan 3.2 hour 0.076032 14 20:30-00:48 showering 30 minute 0.0483 15 20:30-00:48 blow-dried hair 0.2 hour 0.099
Total 4.484574
Carbon Bubble Calculator (CBC) Based on the recorded behaviors in participants’ questionnaire responses, this study designs three behavior patterns and one interactive visualization using (1) behavior tracking, (2) social interaction, and (3) increasing awareness of reducing carbon emissions. Expanding on Fogg’s FBM model, we establish three sets of behavior models and a single interactive visual model.
Carbon Footprint Interaction Through Slow Design Computing and Visual Design 453
Record Mode The aim is to establish a “Carbon Ledger”and database that facilitates a thorough and accessible process for carbon auditing. The recording pages consist of three methods. The first involves entering carbon emissions data retrieval, presenting five selectable options, such as food, trans- portation, accommodation, entertainment, and education. The second method entails scanning carbon emission barcodes, while the third method involves rapid addition.
(1) Method 1: Carbon Emission Retrieval. This records previously scanned carbon emission barcodes and swiftly adds carbon information. As we observed participants’ routines, this method is designed to facilitate the quick addition of past records, enhancing user motivation and fostering the incorporation of recording into daily habits. (2) Method 2: Barcode Scanning. Users can quickly import carbon data by scanning barcodes with their mobile phones. Inspired by Taiwan’s established “invoice consolidation” practice and future postal plans for carbon data recording, this approach utilizes mail barcodes to enhance data recording, including factors like mail weight and delivery distance. (3) Method 3: Quick Addition. If carbon data is not yet available in the carbon emission retrieval or barcode scanning options, users can create carbon data through the quick addition feature.
Figure 6: Domains of human systems integration.
Bubble Mode This mode creates bubbles from users’ carbon emission records, which accumulate in a pentagon representing five lifestyle categories (food, transportation, accommodation, entertainment, education), with bubble quantity determined by daily cumulative carbon emissions (see Figure 6).
(1) Carbon Attachment. Using Participant ‘s activity records as an example, with a cumulative carbon emission of 4.484574, Participant generates 4 carbon bubbles on that day. These 4 carbon bubbles will be positioned within the pentagon, attached to the most frequent carbon-emitting behaviors, such as food and accommodation. (2) Carbon Reduction Burst. Users’ carbon reduction actions, like using reusable cups or walking, are calculated to generate burst orbs based on accumulated reduction values. CBC’s carbon reduction design encour- ages users to adopt small changes, building reduction capabilities, accumulating values, and fostering a sense of achievement that becomes habitual.
Using Participant A’s records, they accumulate around 0.11306 units of daily carbon reduction, significantly lower than their carbon emis- sions. To address this, we accelerated burst orb accumulation by 10 times. When a burst orb forms, users can opt to break a carbon bubble within the pentagon.
Community Mode When any of the triangles is filled with bubbles, the accumulated bub- bles within that triangle are cleared. The system then registers a failure and affects the ranking in the Community Mode.
(1) Friend Burst. We recognize that while some individuals might be pas- sively reducing carbon, others are doing so actively. For instance, if any triangle in User B’s profile is nearly full, CBC sends User B’s friends a notification. If User A generates a carbon bubble that day, they can place it in their own pentagon or in User B”s to help them out. (2) Exploration Capability. In this mode, we encourage users to discover minor lifestyle changes. The rule is to project carbon bubbles into the corresponding triangle fields. For instance, if User A’s carbon bubble comes from reducing food and transportation emissions, it can only be projected onto those fields in the Community Mode.
CONCLUSION
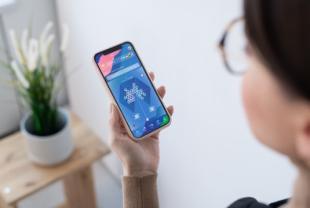
This study explores the potential for carbon auditing by examining behav- ior records of six participants through the lens of slow design and human behavioral characteristics. The findings serve as reference for future sustain- able development goal studies. The introduced Carbon Bubble Calculator (CBC) is designed with (1) behavior tracking, (2) social interaction, and (3) increasing awareness of reducing carbon emissions, linking the genera- tion, attachment, and burst of bubbles through carbon emission increments and reductions. This visualization enhances “conscious” and “visible” inter- action. The model was further refined through low-fidelity prototypes and task testing with the same six participants (see Figure 7).
Participants found that the CBC effectively helps them assess their car- bon footprint, making carbon tracking seem easy while carbon reduction challenging. While linking emissions to bubbles and community interac- tion sustains the habit, forming a personal carbon auditing habit requires
Carbon Footprint Interaction Through Slow Design Computing and Visual Design 455
longer-term efforts. Nonetheless, applying slow design principles in carbon footprint design creates conscious and visible interactions that motivate users to actively engage and derive positive experiences from carbon auditing.
Figure 7: Simulated usage scenario of CBC by user.
REFERENCES
Biørn-Hansen, A., Katzeff, C., & Eriksson, E. (2022). Exploring the Use of a Carbon Footprint Calculator Challenging Everyday Habits Nordic Human-Computer Interaction Conference, Aarhus, Denmark. Chang, T.-W., Wu, Y.-S., Datta, S., & Mao, W.-L. (2020). Developing Slow Sensor for
Slow Design. Sensors and Materials, 32(7), 2425–2432. https://doi.org/10.18494/ SAM.2020.2811 COMMONS. (2019). JORO. https://www.thecommons.earth/ Corporation, T. W. (2023). The Equivalent Carbon Dioxide (CO2) Emission per Unit of Water Consumption. Retrieved from https://www.water.gov.tw/ch/Subject /Detail/2269?nodeId=813. Environmental Protection Administration, E. Y. (2023). Carbon Footprint Informa-
tion Platform. https://cfp-calculate.tw/cfpc/WebPage/LoginPage.aspx Fogg, B. J. (2009a). A behavior model for persuasive design Proceedings of the 4th International Conference on Persuasive Technology, Claremont, California, USA. Fogg, B. J. (2009b). Creating persuasive technologies: an eight-step design process.
International Conference on Persuasive Technology. Fuad-Luke, A. (2005). Slow Theory; A paradigm for living sustainably? Global Footprint Network. (2021). Footprint Calculator. Retrieved August 19 from https://www.footprintcalculator.org. Hallnäs, L., & Redström, J. (2001). Slow Technology - Designing For Reflection.
Personal and Ubiquitous Computing, 5(3), 201–212. https://doi.org/10.1007/PL 00000019 Kuang, C., & Fabricant, R. (2020). “User Friendly: How the Hidden Rules of Design Are Changing the Way We Live, Work, and Play”, Picador pp. 42–44. Odom, W., Stolterman, E., & Chen, A. Y. S. (2021). Extending a Theory of Slow
Technology for Design through Artifact Analysis. Human–Computer Interaction, 150–179. https://doi.org/10.1080/07370024.2021.1913 Sitra. (2021). Sitra Lifestyle Test. Retrieved August 19 from https://lifestyletest.sitra.fi/. United Nations. (2015). Sustainable Development Goals. Retrieved August 19 from https://sdgs.un.org/goals.
LISTED IN THE AHFE DIGITAL BOOKSTORE CATALOGUE
Explore the complete digital volume
Human-Centered Design and User Experience
Read this individual research paper free through the original publisher, or explore the full digital proceedings book.
ISBN 978-1-958651-90-2
Explore this ISBN in the AHFE Bookstore ↗Listed in the July 2026 bookstore catalogue; search by ISBN to confirm current availability · Digital book purchase optional