Shane Toyohara, Kim-Phuong L. Vu (2023). Image-Based Icons: Effects of Object Recognition, Feature Recognition, and Visual Field for the Design of Learning Management Systems. In: Human-Centered Design and User Experience. AHFE Open Access, vol. 114, pp. 410–418. https://doi.org/10.54941/ahfe1004259
Schools and universities are increasing incorporating digital technology with their curriculum implementation through use of Learning Management Systems (LMS) like Desire2Learn (Blackboard), Canvas, and Schoolloop, just to name a few. With the rise of instructor-side customization options in the LMS, educators may not be experienced in designing features, such as button design. Yet, buttons are the most common point of interaction between a user and the interface, and buttons direct students to information on a specified page. Thus, research on effective and usable options for button design in an educational framework is needed to ensure that LMS interfaces are designed with the user’s performance and ease of use in mind. The present study examined visual search performance using a 3 (button type: image, text, image+text), x 2 (border style: rounded or squared), x 2 (screen size: laptop size or mobile size) within-subjects design. In general, results showed longer search times for text only buttons compared to image and image+text buttons, rounded square borders compared to square borders, and larger than smaller screen sizes. However, these overall effects were qualified by two-way interactions between button type x border style, and button type x screen size, where text buttons paired with square borders and large screen sizes resulted in worse performance. Although image+text buttons yielded similar performance to image only buttons, users preferred image+text buttons. Implications of these findings for design are discussed.
The digitization of education in western countries has grown exponentially in the past few decades, starting with simple computer lab classes to the full integration of computer software at almost all academic levels (Haleem et al., 2021). The current educational experience is heavily tied to the use of learn- ing management systems (LMS) that act as the students‘ window into their courses. These LMS contain assignments, quizzes, papers, tools for commu- nication with educators, school news, and even exams, making the entire course available through the platform that the institution utilizes. With the rise of instructor-side customization options in a LMS, educators may not be
Effects of Object Recognition, Feature Recognition, and Visual Field 411
experienced in designing features, such as buttons that direct the student to a specified page. In other words, instructors may not know how to design the button using effective methods to catch students’ attention or how to com- municate the function of the button itself. The goal of the present study was to determine how different types of icons or images, text, and image + text combinations, border styles, and screen size layouts influence visual search performance to pinpoint the most effective design combinations for buttons in an LMS.
Prior studies (e.g., Wiedenbeck, 1999) have led to recommendations for the implementation of icon buttons in general user interfaces, including:
Icons should depict concrete objects instead of abstract concepts (Blanken- berger & Hahn, 1991; Rogers, 1989). For example, an icon showing a printer to represent a print button is more effective than a sheet of paper representing a text file.
Physically, the overall layout of the icons should include both visual variety and simplicity (Bewley et al., 1983). In other words, the iconology on the buttons should depict easily distinguishable objects with simplistic designs to maximize performance in a visual search.
In terms of the layout, positional consistency is a key factor (Green & Barnard, 1996). Consistency will reduce confusion to the user and allow the user to perform better due to having the design match the expecta- tion. Consistency is also known to increase usability (Mehlenbacher et al., 2005).
Buttons should include both icons and labels (text). Wiedenbeck (1999) found that buttons with both icons and labels were perceived to be easier to use than icon-only buttons and text-only buttons. In addition, icon- only buttons led to the worst performance of the three conditions, with icon-text and text-only buttons not showing a significant difference in performance.
More recently, Liu et al. (2021) found that the use of varied colors and rounded square borders were most effective in improving user experience. It is possible that these two features are registered earlier than other features of the object during a visual search (Treisman & Gelade, 1980). In addition, contextual factors like previous search history, perceived feature value, and feature salience (Wolfe & Horowitz, 2017) can guide the users’ attention toward a target stimulus.
The advent of LMS’s in modern-day education has also led to the embrace- ment of mobile phone usage in schools, especially in undergraduate education (Pew Research Center, 2021). Thus, it is likely that people in those age ranges, and even younger, may start to utilize a mobile phone to access online aca- demic material. Developers have provided support tools such as mobile apps for LMS. These mobile apps provide easier access to the content via mobile devices for students, teachers, and parents alike. However, designing inter- faces for mobile phone software means designing smaller interfaces, and giving the user a smaller visual field to search through. It is possible that a smaller visual field can lower the amount of eye movement before finding
412 Toyohara and Vu
a target, but it may also result in clutter due to a lack of white space. Clut- ter can possibly lead to more errors (Gustafson et al., 2008). Additionally, graphics may lose impact and text may lose readability on a smaller display because of the loss of white space (Zong et al., 2008). To gauge the impact of mobile phone usage on visual search of images in an LMS, two screen sizes were examined in the present study to determine differences in performance and usability of buttons that are intended to be displayed on larger versus smaller screens.
The goal of the present study was to determine how different types of images, text, and image/text combinations influence visual search perfor- mance. Results from this study can help designers pinpoint the most effective design combinations for buttons for an LMS. Another aim of this study was to recontextualize past research into an educational design framework and gain new data specific to students’ search performance with image+text but- tons compared to image-only and text-only buttons. As such, this study will also provide designers with information about the effects of the features of a button design, specifically the border, as well as the size of the button in relation to the overall search field.
METHODS
The methods used in the current study were reviewed and approved by the Institutional Review Board (IRB) at California State University, Long Beach (CSULB).
Participants Sixteen participants were recruited from the introductory PSY 100 subject pool at CSULB. The sample included 4 male and 12 female participants. Half of the participants reported to be Asian, and the other half reported to be Latino or Hispanic. Nine of the participants reported the device used to access the experiment was a laptop, six a desktop, and one a tablet. Fifteen of the participants reported taking online courses previously.
Materials
PSYToolkit (Stoet, 2010; Stoet, 2017) was used to design the visual search task. Participants completed the study online, and thus were able to use any device to access the task materials.
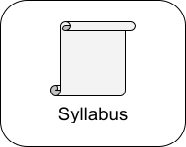
Design A 3 (Button Type: Image Only, Text Only, or Image+Text) x 2 (Border Style: Squared Border or Rounded Square Border) x 2 (Screen Size: Laptop-Size Screen or Mobile-Size Screen) within-subjects design was employed. Figure 1 shows the image+text icon with the round square (left) and square (right) border.
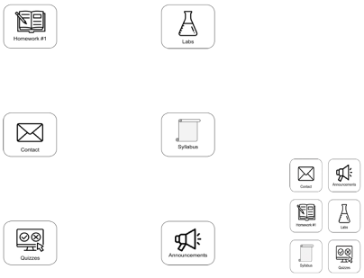
Two screen sizes, consisting of a laptop-size screen and a mobile-size screen (see Figure 2 for a depiction), were examined. The laptop-size screen utilized the entirety of the screen the subject used with buttons placed roughly 7.5 inches across the screen and 9.5 inches down the screen. On the other hand,
Effects of Object Recognition, Feature Recognition, and Visual Field 413
the mobile screen compacted the stimuli together to roughly 4 inches across the screen and 5.5 inches down the screen. This relates to the visual field of the user when interacting with the user interface, and how a smaller or larger field can give the user a more concise look at their options or a greater sense of freedom and a lack of confinement, respectively.
Figure 1: An example of (a) stimulus in the image + text condition with round borders and (b) squared border stimulus, showing a button also in the image + text condition.Figure 2: A depiction of the difference between laptop-sized (left) and the mobile-sized (right) screen conditions. NOTE: drawing is not to scale.
Performance. Performance was measured via two metrics, visual search time, recorded in milliseconds, and accuracy, recorded as the percentage of correct responses. Average visual search times were computed for correct responses by condition.
Questionnaires For each condition, subjects were asked three survey questions to gauge the usability of the buttons being tested. These questions were answered on a Likert scale from 1 “strongly disagree” to 5 “strongly agree”.
I understood what each button represented.
I found these buttons to be aesthetically pleasing.
I would like these buttons to be used in an LMS.
After the twelve blocks of trials were completed, participants were also asked to rank each button design from best to worst to gauge the user’s pref- erence among the six button combinations (Image+Text Round, Image+Text
414 Toyohara and Vu
Square, Image Only Round, Image Only Square, Text Only Round, Text Only Square). After that, the final task involved the participant’s being presented with pictures of the two layout sizes, laptop-size and mobile-size, and asked to pick their preferred layout.
A System Usability Scale (SUS) (Brooke, 1995) was also administered to the participant to evaluate the effectiveness of the layout on the small versus large screen setting. The SUS presents ten statements where the users rate their level of agreement on a five-point Likert-scale ranging from 1, “strongly disagree”, to 5, “strongly agree”. A composite SUS score was computed.
Procedure Participants signed up for the experiment using the SONA system. After selecting the study from a list, participants were directed to a URL with the study. The first screen was the informed consent page, where participants had to agree to participate, followed by a brief demographic questionnaire. Then, participants were presented with the instructions for the block of tri- als, where they were instructed about which button will be the target for the entire block of trials. Participant then ran through a block of 24 trials searching for the target button. Participants were instructed to click on the target button as fast as possible. A single trial showed six education themed buttons to the user laid out in consistent positions on the screen. Participants were provided feedback on their accuracy after each trial. After the partic- ipant completed the first block, an instruction screen for the second block was presented directing the participant to click on the next target item. This was followed by the 24 search trials, and this procedure continued until par- ticipants performed 6 blocks, representing the button type (3) x border type (2) combinations for the small (or large) screen size.
Participants then filled out the 10-item SUS and the custom a three-item questionnaire described earlier. Afterwards, participants performed the 6 remaining blocks (3 button type x 2 border style) for the alternative screen size. After the second set of 6 blocks, participants were given the SUS and customized questionnaire. Finally, they were also asked a ranking question and a final preference question. Overall completion time was expected to take thirty minutes. At the end of the study, participants were thanked for their time and given credit for their participation.
RESULTS
Performance: Time A three-way within-subjects analysis of variance (ANOVA) was conducted to compare the effects of button type (3: Image-Only, Text-Only, Image+Text), border style (2: Squared Border or Rounded Square Border) and screen size (2: Laptop-Size Screen or Mobile-Size Screen), on search time. The analysis revealed that there was a significant main effect of button type, F(2, 14) = 24.92, p <.001, border style, F(1, 15) = 12.13, p = .003, and screen size, F(1, 15) = 141.11, p <.001. For button type, search time was longer for text buttons (M = 1353.19 ms, SE = 50.59) than for image (M = 1131.12 ms,
Effects of Object Recognition, Feature Recognition, and Visual Field 415
SE = 62.84) and image + text (M = 1198.62 ms, SE = 48.27) buttons, which did not differ significantly from each other. For border type, the square bor- ders (M = 1203.06 ms, SE = 51.07) led to significantly quicker search times than the round borders (M = 1252.24 ms, SE = 53.31). For screen size, the mobile screen size (M = 1365.94 ms, SE = 53.88) led to significantly quicker search times than the laptop screen size (M = 1089.35 ms, SE = 52.14). This latter finding is most likely due to the decreased area needed to scan for objects in the visual field.
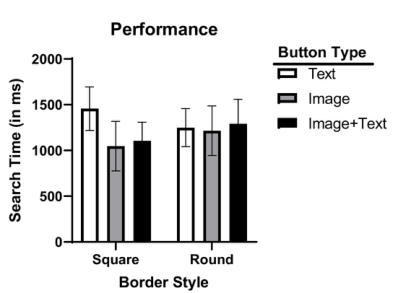
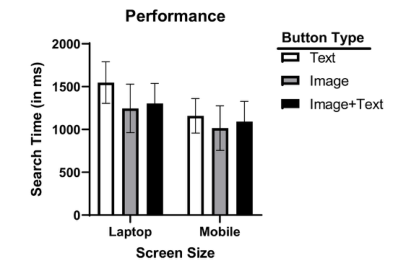
These main effects were qualified by two significant 2-way interactions. There was a significant interaction between button type and border style on search time, F (2, 14) = 66.66, p <.001. As shown in Figure 3, there was a larger effect of button type for square than rounded square borders. For both the image and image+text conditions, search times for square borders were shorter than for round borders. However, when the button type is text only, search time for square borders were significantly longer than rounded square borders. There was also a significant interaction between button type and screen size on search time, F (2, 14) = 8.79, p = .003, see Figure 4. Although the text only button yielded longer search time than the image and image+text buttons, this difference is much greater with the larger, laptop screen size. No other effects were significant.
Figure 3: Mean response time by button type and border style.Figure 4: Mean response time by button type and screen size.
416 Toyohara and Vu
Performance: Accuracy A three-way within-subjects ANOVA was performed on percentage of cor- rect responses as a function of button type (3: Image-Only, Text-Only, Image+Text), border style (2: Squared Border or Rounded Square Border) and screen size (2: Laptop-Size Screen or Mobile-Size Screen). Overall, accu- racy was high (Ms > 92% for all conditions), and there were no significant main effects or interactions.
Usability Ratings and Preferences Participants’ ratings to the usability questions were submitted to separate 3 (Button type: Image-Only, Text-Only, Image+Text), x 2 (Border style: Squared Border or Rounded Square Border) x 2 (Screen size: Laptop-Size Screen or Mobile-Size Screen) ANOVAs. There were no significant main effects or interactions for any of the three questions.
A paired-samples t-test was run to compare the SUS scores obtained for the mobile size condition (M = 70.47, SD = 18.69) versus the laptop size condi- tion (M = 72.5, SD = 20.51). The difference in the scores were not significant, t (15) = .381, p = .057. Both scores above 68 and thus are considered within the “above average” usability range (Brooke, 2013).
All 16 of the participants indicated that they preferred the mobile screen size. For the button ranking question, only 6 users reported scores due to technical error in recording of the responses, with users preferring the image + text icons regardless of border style.
DISCUSSION
Image+text buttons were expected to result in the best performance, as this button type addresses the problems associated with abstraction for the image buttons and reading delay with the text buttons. Consistent with this expec- tation, search performance for image+text buttons outperformed text only buttons; however, image+text buttons resulted in similar performance to image only buttons. The usability metrics showed that image+text buttons were preferable than the other two button types. In addition, more users ranked the image+text buttons higher than the other buttons. Thus, these data suggest designers and instructors should use image+text buttons within a LMS.
Rounded borders were expected to be better than square borders (Liu et al., 2021). However, data from the present study showed that square borders led to significantly faster search times. This overall effect was primarily due to image+text and image only buttons yielding short search times when paired with the square borders. The rounded borders only led to significantly faster times than square borders with the text only buttons. The results, overall, did not support the recommendation for use of rounded borders over square ones. Instead, the interaction of border style with button type seems to suggest that designers look at specific combinations. That is, LMS interface design- ers or instructors customizing their course pages may want to use rounded borders for text only buttons and square borders for buttons that use images.
Effects of Object Recognition, Feature Recognition, and Visual Field 417
This recommendation is preliminary, though, and a future study could inves- tigate other possible interactions that border type may share with features such as button color or button size.
It was also hypothesized that search times for buttons on the mobile size screen would lead to faster performance than the laptop size screen, as there would be less eye movement necessary to find the target stimuli in smaller dis- play sizes (Young & Hulleman, 2013). This hypothesis was supported by the main effect of screen size and the interaction between button type and screen size. For all three button types, laptop size screens led to slower search times than mobile size screens. This difference in search times was significantly larger for the text only buttons. This is possibly due to the participants need- ing to scan a larger area and then read the label on the button. Moreover, every participant reported that they preferred the mobile size screen. How- ever, this finding is most likely due to the design of the screen used in the present study, where only buttons were presented and the main objective was to click the correct stimuli as fast as possible. A future study could be designed similar to a user test, guiding the user through different tasks to perform in an interface and recording answers to interview questions, participant state- ments, etc. With the environment less focused on time-based performance, the user could reflect and speak on their engagement with the interface and how the display size affects their ability to complete a task.
Limitations The current study was based on a small sample, so care must be taken when generalizing onto a larger population. Also, future studies could con- sider running their experiments in a laboratory facility instead of allowing the participant to take the study at home, which could help eliminate dis- tractions and the advent of non-responses in open-ended questions, which was observed in the present study for the ranking question. Also, prior research has found that online studies yield lower response rates (i.e., com- plete responses of the survey) than traditional lab settings (Manfreda et al., 2008). A future study could also create their interfaces within an LMS that allows for customization, like Canvas, which would give the new research high ecological validity that this study lacked.
REFERENCES
Bewley, W. L., Roberts, J. L., Schroit, D. and Verplank, W. L., (1983), Human factors testing in the design of Xerox’s 8010 ‘Star’ office workstation. CHI ‘83 Conference Proceedings. (NY: ACM), 72–77. Blankenberger, S. and Hahn, K. (1991), Effects of icon design on human-computer
interaction. International Journal of Man-Machine Studies, 35, 363–377. Brooke, J. (1995). SUS: A quick and dirty usability scale. Usability Eval. Ind. 189. Brooke, J. (2013). SUS: a retrospective. J. Usability Studies 8, 2 (February 2013), 29–40. Dandurand, F., Shultz, T. R. & Onishi, K. H. (2008). Comparing online and lab meth-
ods in a problem-solving experiment. Behavior Research Methods 40, 428–434.
418 Toyohara and Vu
Green, A. J. K. and Barnard, P. J. (1990), Icon in interfacing: the role of icon distinctiveness and fixed or variable screen location. INTERACT ‘90 Proceedings. (Amsterdam: Netherlands), 457–462. Gustafson, S., Baudisch, P., Gutwin, C., & Irani, P. (2008). Wedge: clutter-free visual-
ization of off-screen locations. Proceedings of the SIGCHI Conference on Human Factors in Computing Systems. https://doi.org/10.1145/1357054.1357179 Haleem, A., Javaid, M., Qadri, M. A., & Suman, R. (2022). Understanding the role of digital technologies in education: A Review. Sustainable Operations and Computers, 3, 275–285. Huang, K. C., Chang, W. T., & Wei, W. L. (2010). Effects of visual field, exposure
time, and set size on icon search with varied delays using an LCD monitor. Journal of the Society for Information Display, 18(6), 427. Liu, W., Cao, Y., & Proctor, R. W. (2021). How do app icon color and border shape influence visual search efficiency and user experience? evidence from an eye-tracking study. International Journal of Industrial Ergonomics, 84, 103160. Mehlenbacher, B., Bennett, L., Bird, T., Ivey, M., Lucas, J., Morton, J., &
Whitman, L. (2005). Usable E-Learning: A Conceptual Model for Evaluation and Design. Proceedings of HCI International 2005: 11th International Conference on Human-Computer Interaction, Volume 4 — Theories, Models, and Processes in HCI. Las Vegas, NV: Mira Digital P, 1-10. Nielsen, J., & Levy, J. (1994). Measuring usability: preference vs. performance.
Communications of the ACM, 37(4), 66–75. Pew Research Center. (2021, April 7). Mobile Fact Sheet. Washington, D. C., MD. Rogers, Y. (1989), Icons at the interface: their usefulness. Interacting With Computers, 1, 105–117. Stoet, G. (2010). PsyToolkit - A software package for programming psychological experiments using Linux. Behavior Research Methods, 42(4), 1096–1104. Stoet, G. (2017). PsyToolkit: A novel web-based method for running online ques-
tionnaires and reaction-time experiments. Teaching of Psychology, 44(1), 24–31. Treisman, A. M., & Gelade, G. (1980). A feature-integration theory of attention.
Cognitive Psychology, 12(1), 97–136. Wiedenbeck, S. (1999). The use of icons and labels in an end user application program: An empirical study of learning and retention. Behaviour & Information Technology, 18(2), 68–82. Young, A. H., & Hulleman, J. (2013). Eye movements reveal how task difficulty
moulds visual search. Journal of Experimental Psychology: Human Perception and Performance, 39(1), 168–190. Zong, S., Wang, Y., & Zong, S. (2008). White space design and its application for website interface. 2008 9th International Conference on Computer-Aided Industrial Design and Conceptual Design.
LISTED IN THE AHFE DIGITAL BOOKSTORE CATALOGUE
Explore the complete digital volume
Human-Centered Design and User Experience
Read this individual research paper free through the original publisher, or explore the full digital proceedings book.
ISBN 978-1-958651-90-2
Explore this ISBN in the AHFE Bookstore ↗Listed in the July 2026 bookstore catalogue; search by ISBN to confirm current availability · Digital book purchase optional