Jeehwan Lee, Sanghyun Lee (2023). IEQ Visual Data to Building Occupants for Personal Control of Indoor Environmental Quality. In: Human-Centered Design and User Experience. AHFE Open Access, vol. 114, pp. 306–312. https://doi.org/10.54941/ahfe1004248
Indoor Environmental Quality (IEQ) profoundly influences occupants' health, productivity, and comfort in built environments. Effective interaction with occupants to comprehend and control IEQ conditions is crucial in human-centered design for IEQ optimization. This paper presents a preliminary study that leverages three-dimensional (3D) virtual space to deliver IEQ data to occupants, enabling them to understand indoor conditions better and exercise personal control of IEQ. A survey was conducted with participants in a virtually simulated educational environment. For a comparative study, participants experienced 3D virtual space with and without IEQ data information on IEQ variables such as temperature, humidity, air quality, lighting, and noise levels. The proposed framework addresses the effectiveness of IEQ visual data on occupants' responses to ways of indoor environmental controls. Regarding the effectiveness of IEQ visual data for occupants' engagement in IEQ controls, the percentage of positive tendency, that responses strongly agree and agree, ranges from 86 to 88% for thermal comfort, from 84 to 92% for visual comfort, from 71 to 81% for acoustic comfort, and 85% for indoor air quality. Findings also show that specific directions on pictograms would help participants take active engagement to improve comfort levels rather than visual data solely. In conclusion, this paper indicates a preliminary approach utilizing 3D virtual space to determine how participants respond to IEQ visual data for personal control of IEQ. By merging immersive visualization with interactive control, our framework bridges human factors and indoor design for occupants' comfort and productivity. The demand for human-centered design continues to expand to IEQ management with emerging technologies such as electroencephalography, resulting in the design of optimized, healthier, productive, and energy-efficient indoor spaces.
Research Goal The effective communication of Indoor Environmental Quality (IEQ) data is crucial for informing design, policy, and decision-making processes that impact occupants’ health, comfort, and productivity. Data visualization, as a dynamic means of representation, has emerged as an indispensable tool for
IEQ Visual Data to Building Occupants for Personal Control 307
translating intricate datasets into comprehensible visual forms that facilitate more meaningful interpretations. These visual formats encompass the inte- gration of augmented reality, virtual reality, immersive 3D visualization, and interactive dashboards.
The primary objective of this preliminary research is to investigate the effectiveness of indoor data visualization in enhancing occupants’ under- standing and facilitating informed decisions to improve Indoor Environmen- tal Quality (IEQ). The study is designed to assess how occupants comprehend and interpret IEQ data in three-dimensional visual formats. It will exam- ine whether immersive visualization improves occupants’ ability to grasp the IEQ parameters for their personal control of IEQ. By evaluating the impact of data visualization on occupant engagement, this study aims to contribute to advancing human-centered design strategies that empower indi- viduals to take proactive control over IEQ parameters (Parkinson et al., 2019; Shah et al., 2020).
Human-Centered Design for IEQ Human-centered design (HCD) in architecture places human needs, behav- iors, and experiences at the forefront of the design process, result- ing in optimized spaces to accommodate user preferences, comfort, and well-being. Its emphasis on understanding and responding to human behav- iors and preferences ensures that architectural environments align seam- lessly with their occupants’ physiological and psychological requirements. HCD also introduces a holistic approach to IEQ control, acknowledg- ing that diverse users have varying requirements for thermal comfort, lighting, acoustics, and indoor air quality. Incorporating HCD princi- ples allows building occupants to engage with environments that opti- mize IEQ parameters, leading to increased occupant satisfaction, reduced stress, and improved cognitive performance. This realization has led to a growing focus on enhancing IEQ through various strategies, ranging from technological interventions to informed decision-making. A pivotal aspect of this evolution lies in empowering individuals to control IEQ vari- ables, aided by effectively delivering indoor data to building occupants (Magnavita, 2014; Geng et al., 2018).
RESEARCH METHODOLOGY Preliminary Study Set
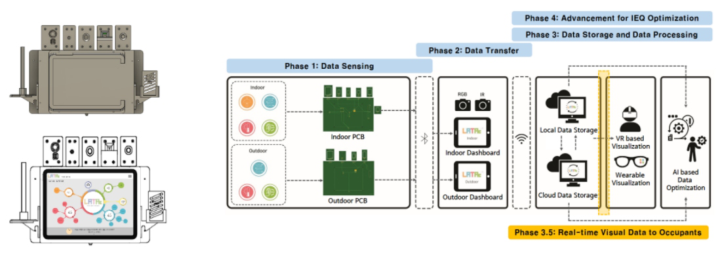
The research will focus on assessing occupants’ recognition of indoor data visualization. The study will consider various IEQ parameters, including temperature, humidity, illuminance, sound pressure level, and indoor pol- lutants embedded in a 3-dimensional virtual model. The research methodol- ogy includes quantitative data analysis, such as measuring occupant com- prehension and decision-making effectiveness. Figure 1 shows the entire research procedure, and this paper highlights the component of Phase 3.5: real-time visual data to occupants as a fragment of the structure as a whole.
308 Lee and Lee
Figure 1: Data sensing, transfer, and visualization.
For the advancement of real-time IEQ data delivery to occupants’ com- fort, integrating advanced technologies, such as data sensing, storage, and real-time data transfer, is pivotal. Besides, the multifaceted benefits of com- prehensive data collection are in delivering accurate, holistic, and actionable insights into the complex interactions between various IEQ parameters and occupants’ experiences. Extensive data collection simultaneously measures multiple IEQ parameters and captures their temporal and spatial variations. As the existing LATAC+ as an extended IEQ data collector in Figure 1, the confluence of data sensing, storage, and real-time data transfer holds immense potential in advancing IEQ control and enhancing occupants’ comfort and well-being.
Indoor Data to Building Occupant In conveying complex IEQ data visualization in a three-dimensional virtual model, pictograms, as graphic symbols representing complex information, are examined for their efficacy in describing thermal, visual, acoustic, and indoor comfort parameters as in Tabe 1. Pictograms are intuitive, enabling rapid comprehension without extensive data interpretation to capture the essence of various IEQ parameters, fostering a quick and efficient under- standing of environmental conditions, as in Figure 2 (Ludwigsdorff et al., 2016; Yin et al., 2020). Table 1 shows target IEQ parameters to be tested in a virtual space, as in Figure 2.
Table 1. IEQ parameters and data visualization.
Table available in the original PDF paper.
IEQ Categories IEQ Parameters Contents Thermal Comfort Temperature (
C)
Colored pictograms on IEQ parameters
Concentration level on each parameter
Warning Levels
Humidity (%) Visual Comfort Illuminance (lux) Acoustic Comfort Sound Pressure Level (dB) Indoor Air Comfort Particulate Matters (mg) CO2 (ppm)
Directions for improvements
IEQ Visual Data to Building Occupants for Personal Control 309
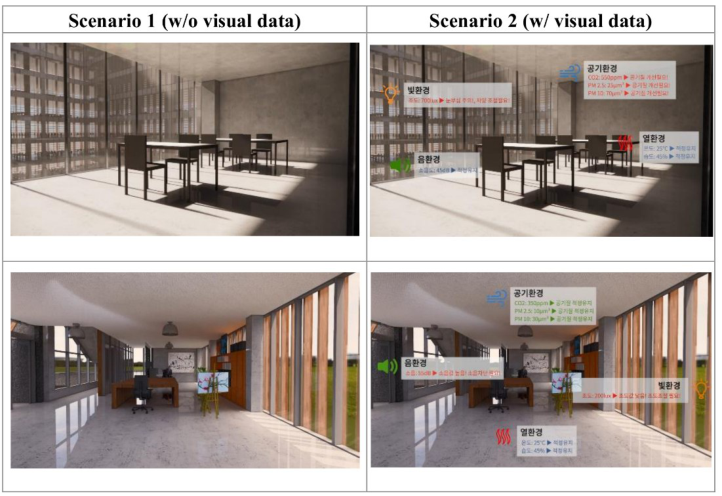
Experimental Design Pictograms are applied to augment occupant spatial experience and percep- tions within 3D virtual environments. The efficacy of integrating pictograms into virtual spaces is examined to communicate information, guide interac- tions, and shape occupant perceptions, ultimately enriching the user expe- rience. Strategically placing visual cues helps occupants perceive, interact, and enhance their overall experiences of IEQ conditions. In virtual environ- ments, each participant experienced each virtual scenario without visual cues and with visual cues, including illuminance (lux) level for visual comfort, noise level (dB) for acoustic comfort, indoor pollutant concentrations (CO2, Pm2.5, PM10) for air quality, and temperature (
C)/relative humidity (%) for thermal comfort in Figure 2. Participants responded to the survey after watching 3 minutes of virtually-modeled office conference rooms in Figure 2.
Figure 2: Example of IEQ visual data in pictograms in a 3D virtual space.
Survey Design The survey design for this research involves a structured approach to gather valuable insights from student participants. The aim is to assess their percep- tions and preferences regarding the effectiveness of IEQ visual information in a three-dimensional virtual model and its potential impact on occu- pants’ engagement for IEQ improvement. The survey design encompasses participant selection, survey size determination, Likert scale implementa- tion, and question formulation. The Likert scale will consist of a range of response options, typically ranging from “Strongly Disagree” to “Strongly Agree.”
310 Lee and Lee
Table 2. IEQ parameters and data visualization.
Table available in the original PDF paper.
IEQ Categories Questions Thermal Comfort 1. Visual data on temperature (
C) and humidity (%) levels has helped me understand the indoor thermal environment. 2. Visual data on temperature (
C) and humidity (%) levels has helped me engage in controlling the indoor thermal environment. 3. More specific directions on pictograms would help me take active engagement to improve thermal comfort than visual data solely. Visual Comfort 4. Visual data on illuminance (lux) has helped me understand the indoor visual environment. 5. Visual data on illuminance (lux) has helped me engage in controlling the indoor visual environment. 6. More specific directions on pictograms would help me take active engagement to improve visual comfort rather than visual data solely. Acoustic Comfort 7. Visual data on sound pressure levels (dB) has helped me understand the indoor acoustical environment. 8. Visual data on sound pressure levels (dB) has helped me engage in controlling the indoor acoustical environment. 9. More specific directions on pictograms would help me take active engagement to improve acoustic comfort rather than visual data solely. Indoor Air Quality 10. Visual data on indoor air quality has helped me understand the indoor air environment. 11. Visual data on indoor air quality has helped me engage in controlling the indoor air environment. 12. More specific directions on pictograms would help me take active engagement to improve indoor air quality than visual data. Misc. 13. Other comments
RESULT AND CONCLUSION The study aimed to investigate the efficacy of utilizing IEQ visual data presented through 3-dimensional virtual models in enabling building occu- pants to exercise personal control over their indoor environment. Through a systematic empirical exploration, the study sought to discern whether the immersive 3D visualizations fostered a heightened sense of understanding, engagement, and empowerment among occupants, consequently leading to informed decisions for IEQ enhancement. Regarding the effectiveness of IEQ visual data for occupants’ engagement in IEQ control, the percentage of positive tendency, that responses strongly agree and agree, ranges from 86 to 88% for thermal comfort, from 84 to 92% for visual comfort, from 71 to 81% for acoustic comfort, and 85% for indoor air quality. Findings also show that specific directions on pictograms would help participants take active engagement to improve comfort levels rather than visual data solely.
IEQ Visual Data to Building Occupants for Personal Control 311
Table 3. Survey responses for positive tendency.
Table available in the original PDF paper.
Equation reproduced from the original PDF.
1. How much do you agree that visual data on temperature (
C) and humidity (%) levels helped me understand the indoor thermal environment?
% of Positive Tendency: 86.2 (Strongly Agree and Agree)
2. How much do you agree that visual data on temperature (
C) and humidity (%) levels helped me engage in controlling the indoor thermal environment?
% of Positive Tendency: 88.5 (Strongly Agree and Agree)
3. How much do you agree that more specific directions on pictograms would help me take active engagement to improve thermal comfort than visual data solely?
% of Positive Tendency: 81.6 (Strongly Agree and Agree)
4. How much do you agree that visual data on illuminance (lux) has helped me understand the indoor visual environment?
% of Positive Tendency: 83.9 (Strongly Agree and Agree)
5. How much do you agree that visual data on illuminance (lux) has helped me engage in controlling the indoor visual environment?
% of Positive Tendency: 91.9 (Strongly Agree and Agree)
6. How much do you agree that more specific directions on pictograms would help me take active engagement to improve visual comfort rather than visual data solely?
% of Positive Tendency: 59.7 (Strongly Agree and Agree)
7. How much do you agree that visual data on sound pressure levels (dB) has helped me understand the indoor acoustical environment?
% of Positive Tendency: 71.2 (Strongly Agree and Agree)
8. How much do you agree that visual data on sound pressure levels (dB) has helped me engage in controlling the indoor acoustical environment?
% of Positive Tendency: 80.5 (Strongly Agree and Agree)
9. How much do you agree that more specific directions on pictograms would help me take active engagement to improve acoustic comfort rather than visual data solely?
% of Positive Tendency: 77.0 (Strongly Agree and Agree)
10. How much do you agree that visual data on indoor air quality (CO2, PM2.5, PM10) has helped me understand the indoor air environment?
% of Positive Tendency: 85.1 (Strongly Agree and Agree)
11. How much do you agree that visual data on indoor air quality has helped me engage in controlling the indoor air environment?
% of Positive Tendency: 85.0 (Strongly Agree and Agree)
12. How much do you agree that more specific directions on pictograms would help me take active engagement to improve indoor air quality than visual data solely?
13. Other comments - Needs better design of visual information - Needs effective ways of info- graphics
312 Lee and Lee
The study’s findings affirm the positive impact of IEQ data visualiza- tion on building occupants’ responses to IEQ controls in 3D virtual models. The heightened understanding, engagement, and empowerment experienced by occupants provide a compelling rationale for integrating such tech- nologies into architectural design and building management practices. This research contributes to the discourse on human-centered design strategies that empower occupants to actively shape their indoor environment, thereby fostering enhanced comfort, health, and well-being.
ACKNOWLEDGMENT
This work was supported by the National Research Foundation of Korea(NRF) grant funded by the Korean government(MSIT) (No. NRF- 2021R1G1A1008000).
REFERENCES
Geng, Y.; Ji, W.; Wang, Z.; Lin, B.; Zhu, Y. (2018) A review of operating performance in green buildings: Energy use, indoor environmental quality and occupant satisfaction. Energy and Building. 2018, 183, 500–514. Ludwigsdorff, N. F.; Peters, S.; Brugge, B.; Loftness, V.; Aziz, A. (2016) Effective
Visualization and Control of the Indoor Environmental Quality in Smart Build- ings. Effective Visualization and Control of the Indoor Environmental Quality in Smart Buildings. 125–129. [Retrieved August 10, 2023, from https://ceur-ws.org/ Vol-1559/paper13.pdf] Magnavita, N. (2014) Work-related symptoms in indoor environments: A puzzling problem for the occupational physician. International Archives of Occupational and Environmental Health 2014, 88, 185–196. Parkinson, T.; Parkinson, A.; Dear R. D. (2019) Continuous IEQ monitoring system:
Context and development. Building and Environment, 149, 15–25. Shah, S. K.; Tariq Z.; Lee, J. H.; Lee, Y. (2020) Real-Time Machine Learning for Air Quality and Environmental Noise Detection. 2020 IEEE International Conference on Big Data. Yin, M.; Wu, Z.; Wen Y.; Tang, L. (2020) Visualize GIS, BIM, and IOT Data For
Comprehensive Green Building Paraments Monitoring. [Retrieved August 15, 2023, from https://www.researchgate.net/].
LISTED IN THE AHFE DIGITAL BOOKSTORE CATALOGUE
Explore the complete digital volume
Human-Centered Design and User Experience
Read this individual research paper free through the original publisher, or explore the full digital proceedings book.
ISBN 978-1-958651-90-2
Explore this ISBN in the AHFE Bookstore ↗Listed in the July 2026 bookstore catalogue; search by ISBN to confirm current availability · Digital book purchase optional