Catalina Astudillo-Rodriguez, Emilio Guzman, Patricia Margarita Ortega Chasi (2023). A controlled experiment using eye-tracking to evaluate the usability of the UDA-ERP system. In: Usability and User Experience. AHFE Open Access, vol. 110, pp. 358–367. https://doi.org/10.54941/ahfe1003209
The size and complexity of ERP systems demand investigating the ease-of-use characteristics required by business users. Usability testing provides essential information to determine errors and specific problems within a software product. This paper presents the results of a usability experiment using non-invasive tools to collect eye-tracking data to analyse and understand human behaviour. A controlled experiment for usability tests was carried out with the aid of an eye-tracking device and the application of the System Usability Scale (SUS) survey. The experiment involved expert teachers in the accounting area and students who are about to complete their studies in accounting. The methodology applied was the experimental process proposed by Wohlin. This methodology includes five tasks: scope definition, planning, execution, data analysis and interpretation, and presentation and dissemination. The experiment was guided by the descriptions of the specific tasks to be completed by the participants. The eye-tracking device GP3 collected participants' eye-gaze data while executing the task. Finally, participants completed the System Usability Scale (SUS) survey. The results show the feasibility of using eye-tracking devices jointly with the SUS survey to identify usability problems related to the graphic interface in the UDA-ERP system. The results suggest that the UDA-ERP system usability is functional, and the usability experiment methodology used in this study provides a practical approach for evaluating future ERP systems' usability.
Currently, SMEs implement business management systems to support the management of processes within their businesses. Among these systems are the so-called enterprise resource planning (ERP) systems, characterised by their size and complexity. Therefore, evaluating the usability of this type of software using various tools and techniques is essential for research. Accor- ding to Nawaz and Channakeshavalu (2013), ERP systems integrate various functions of the company within a single computer system to coordinate and synchronise various business processes, improve the use of resources and the adequate management of information and company activities. Parhizkar and Comuzzi (2016) define an ERP system as a set of business applications
that can generate automated procedures, possibly integrating new systems for business data management. ERP systems allow companies to adapt to different situations for purposes such as (i) cost reduction; (ii) reduction of information management; (iii) customer satisfaction; and (iv) maintaining the management of data generated by daily operations (Astudillo-Rodríguez, Crespo-Martínez and Andrade-Dueñas, 2018).
The UDA-ERP system has been developed to serve small companies as part of the research and linkage program of the Universidad de Azuay; its implementation began in 2015 (Astudillo-Rodríguez, Crespo-Martínez and Andrade-Dueñas, 2018).
Systems must meet usability standards to meet user needs. All user intera- ction with the system can face different obstacles, testing various cognitive processes that generate distractions of all kinds when performing any task within the system.
Usability is a quality attribute whose objective is to improve the ease of use of a product or service. (Nielsen, 2012) suggests checking it during the design and prototyping processes and defines five usability quality components: i) learning, ii) efficiency, iii) memorability, iv) efficacy, and v) satisfaction. The ISO 9241–11 standard defines usability as “The extent to which a system, product or service can be used by specific users to achieve specific objecti- ves with effectiveness, efficiency and satisfaction in a specific context of use” (ISO 9241-11: 2018 (en), Ergonomics of human-system interaction, 2022, p. 92). (Hertzum, 2020) incorporates three fundamental qualities into these definitions: (i) effectiveness, such as the precision of achieving objectives; (ii) efficiency, how many resources are going to be consumed; and (iii) sati- sfaction when carrying out tasks without presenting inconveniences on the part of the product.
Several usability evaluation methods can be applied to software, for exam- ple, user tests, heuristic evaluation, acceptance tests, task tests, and expert reviews. However, these usability evaluation techniques do not consider the psychological and biological aspects of the user, such as stress levels or eye movements (Costa, 2010; Hertzum, 2020). This research uses three usability evaluation techniques to obtain a complete view of the results from different user perspectives. These techniques include the SUS survey, think-aloud, and eye tracking.
Using non-invasive techniques, such as eye tracking, allows data collection related to human-computer interaction to analyse and understand human behaviour. The Eye-tracking technique allows for obtaining data about what a user is looking at, how they perform various eye movements and how pupil size is affected in different tasks (Bojko, 2013). Depending on the objective of the study, several measures can be acquired, including i) fixation (fixa- tion of the user in a specific area while performing a task), ii) saccade (rapid movements as opposed to fixations, where ocular concentration is not keeps fixed in a specific area), iii) gaze (they are important since they involve the relationship between the eye and the position of the head), iv) ScanPath (the exploration path that the eye performs when performing the tasks, either search or something similar), v) the size of the pupil and the blinking speed
(to assess cognitive load and to obtain information on the mental load and fatigue generated by the task) (Sharma and Dubey, 2014).
This study aims to perform usability tests on the UDA-ERP software using an Eye-tracker device on two groups of users identified as teachers and stu- dents. The experiment examines the differences in the groups’ interaction with the interface, including the execution times of the tasks.
The organisation of the document is as follows: the second section presents the related works; the third section details the design of the experiment based on Wohlin’s methodology; and finally, the results obtained in each group identified for the experiment are reported.
RELATED WORKS The literature is scarce on usability in ERP systems with eye tracking. For this reason, this section includes studies that evaluate similar systems with eye- tracking devices aid. Several studies examine the use of eye-tracking devices for assessing the usability of software products focusing on examining navi- gation mechanisms, graphical interfaces, and creating guidelines to design new software interfaces. For example, in the study conducted by (Fu, 2016), the authors apply the ISO 9241–11 standards to evaluate the efficiency, effe- ctiveness and satisfaction of an application store using the Eye Tracking technique. The results provide a guide for the design of the navigation inter- face and serve as a theoretical basis to determine the appropriate navigation mechanism according to each specific need.
In the educational software area, the study conducted by Kaysi and Topaloglu (2017) evaluates the student information system of a university by combining the Eye Tracking technique with the competitive usability testing method. This last method compares similar systems and evaluates the ease of use of the graphical interface. The Eye Tracking device collected data on usa- bility issues related to the graphical interface. The data collected included the number of fixations and the duration of each of them. The results obtained allowed the design of a new development interface.
The studies by Calitz, Bosire and Lane (2012), and Beelders and Kotzé (2020) show that eye-tracking devices provide precise data on user behaviour and user interactions with the software interfaces. Calitz, Bosire and Lane (2012) examined BI boards implemented within an ERP system of African origin. In their experiment, participants met specific criteria: (i) being between 21 and 60 years old; (ii) having experience in using computers and ERP systems; and (iii) most importantly, not having had any contact with the BI dashboards that were developed in the ERP environment. The Eye- tracking device Tobii T60 was used for data collecting. The users had to use all the implemented boards while the device captured the eye movements and the fixations. The authors conclude that these devices still have limitations due to their cost; however, the combination of usability evaluation techni- ques with Eye-tracking provides more precise data and allows for examining the participant’s behaviour.
The study by Beelders and Kotzé (2020) reports the use of eye-tracking devices as a complement to identify usability problems within a Business
A Controlled Experiment Using Eye-Tracking 361
Intelligence (BI) tool. The study analyses heat maps, eye travel and simple descriptive statistics. They highlight that the eye-tracking technique is a tool that can offer detailed results of user behaviour in the interaction with a gra- phical interface. Hence its use in conjunction with simple statistical analysis allows for identifying usability problems.
DESIGN OF THE EXPERIMENT This study applies the experimental methodology proposed by Wohlin et al. (2012). This methodology includes five main activities: 1) definition of the scope; 2) planning; 3) operation; 4) analysis and interpretation; and 5) presentation and dissemination of results.
Defining the Scope of the Experiment The scope definition follows the GQM template (Goal - Question - Metric) (Rombach and Basili, 1988). According to this template, the experiment’s scope is as follows: Analyze the usability in the aspects of efficiency and effe- ctiveness of the UDA-ERP system by applying the method of Eye-tracking, thinking aloud, and surveys to identify possible difficulties regarding the graphic user interface of processes called critical from the point of view of potential users in the context of teachers and students of the Universidad del Azuay. This article reports the findings from applying the Eye-tracking method.
Planification Context Selection The definition of study context followed the four dimensions presented by (Wohlin et al., 2012): 1) Online Context: the software is deployed in a real situation in SMEs in the city of Cuenca, Ecuador; 2) the participants were professors with a degree in Accounting who work at the University of Azuay, and students of the Accounting and Auditing program from Universidad del Azuay; 3) the experiment was applied to the UDA-ERP software; therefore, it is a real-world project; and 4) in a specific context since the experiment eva- luates the UDA-ERP software usability by applying the Eye-tracking method, thinking aloud, and surveys.
Table 1 shows the nine tasks the participants needed to accomplish during the experiment.
Selection of Participants and Experiment Design Convenience sampling was used to select two groups of participants: four experts and ten novices. The experiment’s participants in both groups did not have experience with the UDA-ERP software.
Group 1: Students (N = 10) enrolled in the seventh semester of the Accoun- ting undergraduate program at the University of Azuay. Selection criteria included students who are carrying out pre-professional practices in real set- tings. This group is considered as novices in the business processes involved in the experiment.
Table 1. Tareas del sistema UDA-ERP.
Table available in the original PDF paper.
Module Task Finance & Accounting 1. Create a new financial account 2. Record a new financial transaction Inventory Management 3. Create a new inventory product 4. Record a new inventory transaction Procurement 5. Create a new supplier 6. Record a new purchase invoice Order Management & Sales 7. Create a new customer 8. Create a new sales invoice Manufacturing 9. Create a new product structure
Group 2: Instructors (N = 4) with a post-secondary degree in Accounting who works in the Business Administration Department at the University of Azuay. This group is considered experts in the business processes involved in the experiment.
Instrumentation The three planned phases for the execution of this experiment are:
1) Participants’ demographic information collection: An initial pre- experiment questionnaire collected participants’ demographic informa- tion. 2) Execution of the experiment’s tasks: (a) participants followed the written instructions in the technical sheet in printed format delivered to each subject with detailed step-by-step instructions to follow for each task. (b) Usability assessment: the Gazepoint GP3 Eye tracking Device was used to collect participants’ interaction eye-tracking data with the software. c) Data analysis was performed through the Gazepoint Analysis software. 3) Post-experiment questionnaire: the Usability Scale System (SUS) (Bangor, 2009; Nafianto, Puspitasari and Saputra, 2019) was applied to evaluate the experience in terms of usability.
Hypothesis Formulation H0: The tasks’ execution fixation time and number of fixations are the same between participants in Group 1 and participants in Group 2.
H1: The tasks’ execution fixation time and number of fixations are different between participants in Group 1 and participants in Group 2.
RESULTS
The findings from the pre-experimental survey are presented below:
92.3% of the participants reported using technological applications.
69.2% of the participants reported using technology for educational purposes.
61.5% of the participants reported using applications as work tools for 1 to 4 hours per day.
A Controlled Experiment Using Eye-Tracking 363
61.5% of participants reported having used a business software or similar tool.
76.9% of the participants reported using a business software system or a similar tool for 0 to 4 hours per day.
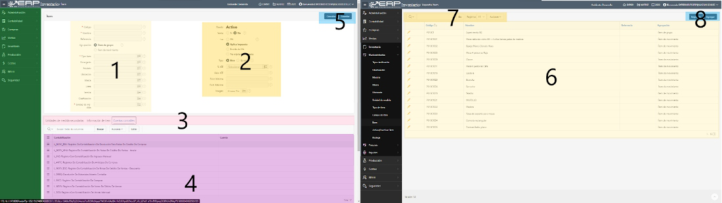
For the data analysis collected through the eye-tracking device, areas of interest were identified in the interfaces of the nine tasks of the experiment (Figure 1).
The normality of the data was assessed using the Shapiro-Wilk test. Since the assumption of normality was violated for three of the nine tasks, parametric and non-parametric tests were used accordingly.
Mann-Whitney U test was used to compare the medians of the variable task’s execution total time between Group 1 and Group 2 for tasks 2, 5 and 8, while the independent samples t-test was used to compare the means of the variable between Group 1 and Group 2 for the remaining tasks.
The results indicate that the Create a new inventory product task presents a statistically significant difference in the task’s total execution time between the two groups, as shown in Table 2.
The AOIs defined allow for a close look at the difference in the total execution task time variable between the two groups in Create a new inven- tory product task. The number of fixations and the average fixation time in seconds variables for each defined area of interest were analysed. Normality tests and T-Test or Mann-Whitney U tests were applied accordingly. These results are shown in Table 3.
Figure 1: Interest areas in the create an inventory item process.Table 2. T test and Wilcox test results.
Table available in the original PDF paper.
Task id Instructors Students P-value Satisfied test
M MDN SD IQR M MDN SD IQR 1 64.00 64.00 13.00 13.00 75.90 65.00 40.10 17.75 0.4336 Wilcox test 2 241.00 196.00 107.79 100.50 304.10 273.00 107.79 143.50 0.4394 T Test 3 175.67 172.00 10.02 9.50 233.30 237.00 34.37 54.00 0.0006" T Test 4 96.00 37.00 13.25 16.50 123.50 96.50 39.54 40.50 0.3322 Wilcox test 5 257.00 246.00 20.31 13.50 237.70 233.00 29.12 34.75 0.2534 T Test 6 453.33 335.00 171.21 159.00 546.60 524.50 124.26 162.50 0.4675 T Test 7 263.33 253.00 12.36 12.00 269.40 252.00 52.22 39.50 0.7439 Wilcox test 3 305.67 367.00 143.30 139.00 300.20 239.50 32.73 121.75 0.9570 T Test 9 120.00 123.00 13.36 17.00 140.50 127.00 34.36 60.00 0.2219 T Test
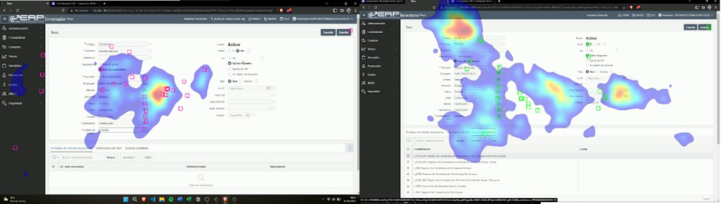
The results of the AOIs analysis for the task do not evidence a statisti- cally significant difference among AOIs in the groups. However, the heat map shows the dispersion of fixation for participants in Group 1 in contrast with those in Group 2 as shown in the following figure 2.
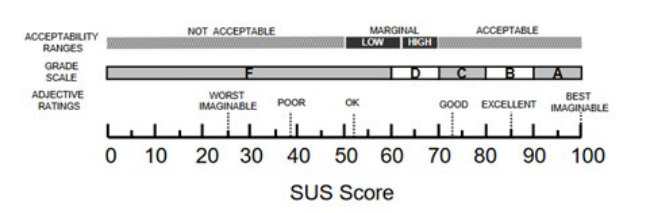
The statistical analysis shows that despite the difference in the specialised knowledge levels of each participating group, the times used by each group to complete the tasks mostly do not show a statistically significant differe- nce, except for the Create New Product task. These results suggest that the interfaces examined in this experiment have a level of usability independent of specialised knowledge in the area so that experts and novices can com- plete the tasks at similar times. These results are congruent with the results of the SUS survey applied in the post-experiment (76.15%), a percentage that, according to the analysis presented by (Bangor, 2009), would have an Adje- ctive rating: Good; Grade scale: C; and an Acceptability range: Acceptable.
Figure 2: Heatmap create a product.Figure 3: SUS score (Bangor, 2009).
CONCLUSION
In conclusion, the results of the usability experiment indicate that the UDA- ERP system has a good level of usability, as shown by the high score on the System Usability Scale (SUS) survey. The use of eye-tracking data and thought-aloud capture provided valuable insights into the cognitive proces- ses involved in completing tasks in the system and identified specific usability
problems related to the graphic interface. The experiment also demonstrated that the level of specialised knowledge in the accounting area did not signifi- cantly affect the usability of the system, as experts and novices were able to complete tasks at similar times.
Overall, the findings suggest that the UDA-ERP system usability is effe- ctive, and the usability experiment methodology used in this study provides a useful approach for evaluating the usability of ERP systems in the future.
REFERENCES
Astudillo-Rodríguez, C., Crespo-Martínez, E. and Andrade-Dueñas, I. (2018) ‘UDA
- ERP: Emprendimiento y Gestión de recursos empresariales. La llave para la vinculación empresarial’, p. 15. Bangor, A. (2009) ‘Determining What Individual SUS Scores Mean: Adding an Adjective Rating Scale’, 4(3). Beelders, T. R. and Kotzé, J. E. (2020) ‘Augmenting the Business Intelligence Lifecycle
Model with Usability: Using eye-Tracking to Discover the why of Usability Pro- blems’, Electronic Journal of Information Systems Evaluation, 23(1). Available at: https://doi.org/10.34190/EJISE.20.23.1.007. Bojko, A. (2013) Eye Tracking the User Experience: A Practical Guide to Research.
Rosenfeld Media. Calitz, A. P., Bosire, S. and Lane, E. (2012) ‘Usability Evaluations of ERP Business Intelligence Dashboards’, p. 25. Costa, C. J. (2010) ‘Testing usability of ERP open source systems’, in ACM
SIGDOC European Chapter/ Eurosigdoc Workshop on Open Source and Design of Communication - OSDOC ‘10. ACM SIGDOC European Chapter/ Eurosigdoc Workshop, Lisbon, Portugal: ACM Press, p. 25. Available at: https://doi.org/10.1145/1936755.1936763. Fu, J. (2016) ‘Usability evaluation of software store based on eye-tracking technology’, in 2016 IEEE Information Technology, Networking, Ele- ctronic and Automation Control Conference. 2016 IEEE Information Technology, Networking, Electronic and Automation Control Confere- nce (ITNEC), Chongqing, China: IEEE, pp. 1116–1119. Available at: https://doi.org/10.1109/ITNEC.2016.7560538. Hertzum, M. (2020) ‘Usability Testing: A Practitioner’s Guide to Evaluating the User Experience’, Synthesis Lectures on Human-Centered Informatics, 1(1), pp. i–105. Available at: https://doi.org/10.2200/S00987ED1V01Y202001HCI045. Kaysi, B. and Topaloglu, Y. (2017) ‘Competitive Usability Testing of Student
Information Systems with Eye Tracking Method’, in 2017 International Con- ference on Computational Science and Computational Intelligence (CSCI). 2017 International Conference on Computational Science and Computational Intelligence (CSCI), Las Vegas, NV, USA: IEEE, pp. 951–956. Available at: https://doi.org/10.1109/CSCI.2017.165. Nafianto, C., Puspitasari, W. and Saputra, M. (2019) ‘Development of Flexible Production Scheduling by Applying Gantt Charts In Manufacturing Module Open Source ERP (Case Study CV. XYZ)’, in 2019 International Conference on Sustainable Engineering and Creative Computing (ICSECC). 2019 International Conference on Sustainable Engineering and Creative Com- puting (ICSECC), Bandung, Indonesia: IEEE, pp. 182–185. Available at: https://doi.org/10.1109/ICSECC.2019.8907025.
A Controlled Experiment Using Eye-Tracking 367
Nawaz, N. and Channakeshavalu, K. (2013) ‘The Impact of Enterprise Resource Planning (ERP) Systems Implementation on Business Performance’, SSRN Electronic Journal [Preprint]. Available at: https://doi.org/10.2139/ssrn.3525298. Nielsen, J. (2012) Usability 101: Introduction to Usability, Nielsen Norman Group.
Available at: https://www.nngroup.com/articles/usability-101-introduction-to-us ability/ (Accessed: 2 May 2022). Parhizkar, M. and Comuzzi, M. (2016) ‘A framework for impact analy- sis of post-implementation enterprise resource planning modifications’, in 2016 SAI Computing Conference (SAI). 2016 SAI Computing Confere- nce (SAI), London, United Kingdom: IEEE, pp. 706–714. Available at: https://doi.org/10.1109/SAI.2016.7556059. Rombach, H. D. and Basili, V. R. (1988) ‘The TAME Project: Towards Improvement- Oriented Software Environments’. Sharma, C. and Dubey, S. K. (2014) ‘Analysis of eye tracking techni- ques in usability and HCI perspective’, in 2014 International Confere- nce on Computing for Sustainable Global Development (INDIACom). 2014 International Conference on Computing for Sustainable Global Develo- pment (INDIACom), New Delhi, India: IEEE, pp. 607–612. Available at: https://doi.org/10.1109/IndiaCom.2014.6828034. Wohlin, C. et al. (2012) Experimentation in Software Engineering. Berlin, Heidel-
berg: Springer Berlin Heidelberg. Available at: https://doi.org/10.1007/978-3-642- 29044-2.
LISTED IN THE AHFE DIGITAL BOOKSTORE CATALOGUE
Explore the complete digital volume
Usability and User Experience
Read this individual research paper free through the original publisher, or explore the full digital proceedings book.
ISBN 978-1-958651-86-5
Explore this ISBN in the AHFE Bookstore ↗Listed in the July 2026 bookstore catalogue; search by ISBN to confirm current availability · Digital book purchase optional