Alina Tran, Kim-Phuong L. Vu (2023). Evaluation of Pedometer Interfaces for Mobile Apps. In: Neuroergonomics and Cognitive Engineering. AHFE Open Access, vol. 102, pp. 214–223. https://doi.org/10.54941/ahfe1003021
The use of mobile health apps has been on the rise, as they allow people to get their health information more conveniently. Many people are using their mobile health apps to track their health status (KC et al., 2021), but there are known issues with people being unable to use their health apps effectively due to poor design. According to Wildebos et al. (2019), if users are continuously failing to get the information they need, they could develop feelings of insecurity and stop using the app. To mitigate these negative interface design impacts, Universal Design Principles (Story, 1998) and Gestalt’s Principle of Perceptual Grouping (Smith-Gratto & Fisher, 1999) could be used to improve the interfaces. In the present study, we evaluated several interfaces of pedometer apps that varied in terms of flexibility (low and high) and three levels of simplicity (simple, intermediate, complex). Ninety six participants were recruited from MTurk. The participants responded to questions on a survey that require them to extract information from a pedometer interface. After answering the comprehension questions for the specific interface, participants were asked to indicate their perceived ease of use (Brooke, 1996) and the likelihood of utilizing the pedometer app (Pasha & Indrawati, 2020). We found that participants had higher accuracy scores with the interface that was intermediate in terms of simplicity, but they preferred the simple or complex interface design. Results of this study suggest that users may not prefer designs that lead to better task performance and designers will need to balance features that enhance performance versus those that users find to be more attractive or desirable for continued use.
In the United States, 9.1% of adults have three or more of eight chronic conditions: arthritis, asthma, cancer, cardiovascular disease, chronic kidney disease, chronic obstructive pulmonary disease, depression, and diabetes (United Health Foundation, 2021). By monitoring healthy behaviors, peo- ple can decrease certain risks for these chronic diseases. For instance, people with diabetes should keep track of their blood sugar levels. In doing so, they can determine how their lifestyles (e.g., food, exercise, and other factors) would affect their diabetic condition (Krans, 2018). In addition, getting regu- lar exercise can possibly decrease the risk of cardiovascular diseases since exercise can help with weight reduction and lower blood pressure levels
Evaluation of Pedometer Interfaces for Mobile Apps 215
(Myers, 2003). Because walking is a task that people perform on a regular basis, it can be a good exercise that people can do to stay healthy. How- ever, tracking exercise and other healthy behaviors can be time-consuming and complex for some users. To simplify the process of monitoring healthy behaviors, app developers have created a variety of mobile health apps.
The use of mobile health apps has been on the rise, as they allow people to get their information more conveniently. However, when users were surve- yed about their experiences and concerns with the use of health apps, 18.5% of people reported that the health apps available were not user-friendly (KC et al., 2021). Poor usability could lead to negative effects because peo- ple are unable to effectively access and comprehend their data in health apps due to the design. According to Wildenbos et al. (2019), if users are conti- nuously failing to get the information they need, they could develop feelings of insecurity. Consequently, users may be more hesitant to explore the other functions on the app and ultimately stop using the app.
BACKGROUND
Web and app design are very similar to one another, and the design concepts are transferable (Babich, 2019). Previous research on website design showed that the site’s usability influences users’ perception of the product. In one study, Chadwick-Dias et al. (2002) had participants ranging from ages 20 to 82 interact with a prototype employee and retiree benefits website to perform typical tasks. For instance, one task was to look for the monthly payment the user would receive if they were getting it from their pension plan. Another task was to indicate how to move money from one stock to another. For the first study, Chadwick-Dias et al. investigated if the changes in text size would affect performance. The participants were asked to complete 15 tasks, where they had to find information on employee and retiree benefits when the information was displayed in various text sizes. Chadwick-Dias et al. found that the older adults did have more difficulty with using the web site compared to the younger adults, but the text size had no significant effect.
In a second study, Chadwick-Dias et al. (2002) had a new group of partici- pants perform the same task as in the first study, but they redesigned the web to address some of the usability problems identified in the first study. Speci- fically, one problem was understanding the location of where certain items on the screen were placed. Other issues were related to difficulty with win- dow management and scrolling. To resolve these issues, Chadwick-Dias et al. added titles and explanatory text, removed any false buttons, and explicitly stated when a new window would open. With the redesigned website, older users were able to click more confidently (i.e., with less hesitation) as well as complete more tasks compared to the first study. Although this study was conducted over 20 years ago, the fact that increasing the usability of a product improves user performance still holds today. In fact, many of these design principles generated for website design are applicable to mobile interface design. Babich (2019) states these usability principles are applicable to any interactive system ranging from traditional GUI environments (e.g., websites, mobile apps) to non-GUI interfaces (e.g., voice-based interactions systems).
216 Tran and Vu
Universal Design To mitigate negative interface design impacts, two different design princi- ples were explored in the present study, flexibility and simplicity, both are captured by Universal Design Principles, which Story (1998) indicates as the “design of the products and environment that can be used and experienced by all people to the greatest extent possible…” (p. 4) There are seven principles within Universal Design:
1. Equitable use: Allow people with diverse abilities to use the product 2. Flexibility in use: Accommodate a range of different preferences 3. Simple and intuitive use: Make information easy to understand 4. Perceptible information: Able to effectively convey information to the user 5. Tolerance for error: Minimizes hazards and allows recovery from errors 6. Low physical effort: Works efficiently and comfortably 7. Size and space for use: Size and space should be appropriate for specific types of interactions.
Walker et al. (2017) demonstrated how the implementation of universal design could be used for a common service. They designed a weather app from scratch and integrated principles of universal design. Specifically, they focused on making it accessible for users with visual impairments. Walker et al. (2017) completed an information needs analysis to gauge what fea- tures potential users would want in a weather app. Some of the responses they received were to add in hourly reports of the temperature and wind direction with the speed. From this analysis, Walker et al. (2017) found that they need to consider a wide range of uses and to format the information in a flexible manner. As a result, they created a multimodal weather display that had similar functions of a visual-only weather icon and implemented it in a more engaging format. One new feature that they added in terms of accessibility was sonification (i.e., non-speech audio to convey information to the user). To evaluate their app, they had users with visual impairments and those without visual impairments use the app for at least one week. Then, the participants completed a survey that had questions pertaining to the app, their satisfaction and frustration level for the various features on the app, and the text-to-speech wording. In terms of satisfaction, Walker et al. (2017) found that all the participants rated the app to be similar to or better than, the weather app they have used previously. Moreover, participants indicated that the app, with its enhanced features, was able to accommodate diverse users’ needs and was judged to be accessible.
Gestalt’s Principles of Perceptual Grouping Another design principle that can be implemented within health apps to help users group information that is being presented is Gestalt’s Princi- ples of Perceptual Grouping (Smith-Gratto & Fisher, 1999). This states how people will tend to organize visual information according to six principles:
Evaluation of Pedometer Interfaces for Mobile Apps 217
1. Figure-ground relationship: Clarity between the figure and the back- ground allows people to distinguish one as the figure and the other as the background 2. Simplicity: People will perceive complex images in its simplest form possible 3. Proximity: Items that are placed near each other will be grouped together 4. Similarity: Objects or text that are similar in appearance will be grouped together 5. Symmetry: Mirrored shapes and balanced elements tend to be grouped as an item 6. Closure: Visual connections will be perceived between the set of elements that are not directly touching to form a closed object These grouping principles have been shown to be effective in organizing elements on a screen display because they allow users to interpret and reco- gnize the material easily (Smith-Gratto & Fisher, 1990). In support of the principle of simplicity, Vaghefi and Tulu (2019) conducted a study with 17 people using a mobile app over a 2-week span. They looked at factors that influenced users’ assessment of mobile health apps through interview and diary data. Vaghefi and Tulu (2019) found that about 11% of people wrote comments about the interface design of the app in their evaluations. Users indicated that they liked a clean and simple screen. For example, one parti- cipant stated that with a simple and clean design s/he was able to navigate through the app more easily. In addition to simplicity, factors such as conve- nience and effortless data collection by the app were also rated as being important.
Investigating how the principles of flexibility (universal design) and sim- plicity (Gestalt) work together should provide information to mobile health app developers and other health professionals to produce more usable desi- gns. In addition, by having designs that are high in usability, users are more likely to continue their use of health apps. It is expected that the partici- pants would prefer interfaces that have high flexibility and are simple. With high flexibility, the participants would be able to obtain more information that suits their needs. In addition, multiple features of an app are likely to increase participants’ intention to use the app. Complex interfaces can pose difficulty in navigating and discovering information in an app, so it is expe- cted that users will favor simple designs. However, overly simple interfaces may lack the necessary information that users would like to have. As such, a pedometer interface that is intermediate in terms of simplicity may also be favored by the participants compared to the simplest design.
METHODS
Participants One hundred participants were recruited for the study, but data from four participants were excluded for failing to answer the quality control questions accurately. The analytical sample consisted of 96 participants, 49 from the survey with the low flexibility interfaces and 47 form the survey with high
218 Tran and Vu
flexibility interfaces. The participants’ ages ranged from 21 to over 61 years old, with the majority of the participants being in the age group of 26 to 35 (51.1%). The participants in this sample were familiar with health apps, with 42.7% of participants rating their experience level with health apps as being “Advance”; 50% considered themselves to be “Expert” or “Intermediate” with health apps in general, and 30.3% of participants to be “Advanced” or “Intermediate” in terms of experience with pedometers apps.
Design This study employed a 2 flexibility (low and high) x 3 simplicity (simple, intermediate, complex) mixed design. Flexibility was manipulated between subjects and simplicity was manipulated within subjects. The dependent vari- ables were the scores for accuracy of comprehension questions, ease of use ratings, and intention of use ratings.
The System Usability Scale (SUS; Brooke, 1996) was used to evaluate each of the interfaces, where participants rated 10 questions of the SUS using a scale of five responses that range from “Strongly Agree” to “Strongly Disa- gree”. A few questions from a previous study by Pasha and Indrawati (2020) was used to measure the intention of use of the pedometer apps shown. The participants were asked to rate the 4 questions (see Table 2 in the Results section) using the scale of five responses that range from “Strongly Agree” to “Strongly Disagree”.
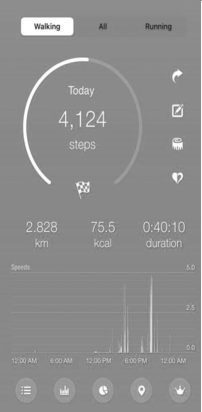
Materials: Survey Two surveys, one with interfaces that were considered to be low in flexi- bility (see Figure 1, top row for examples) and the other high in flexibility (see Figure 1, bottom row for examples), were embedded into a survey admi- nistered by Qualtrics, a survey platform. Each survey had mock-up screen shots of three pedometer apps interfaces ranging from the three levels of simplicity: simple, intermediate, complex (see Figure 1 left-to-right). The intermediate and complex interfaces had multiple screens (not shown in Figure 1). The screen shot of each of the pedometer interface in the survey were about 245 × 500 pixels. The order of the three pedometer interfaces in each survey were randomly presented. The survey contained three quality control questions, where participants are asked to select a specific response, to check for attention to survey questions. There were 8 questions for each pedometer app that require the participants to extract information from the
Table 1. Mean and standard deviations for: Accuracy, SUS, and intention of use.
Table available in the original PDF paper.
Conditions Accuracy Score Mean (sd)
SUS Mean (sd)
Intention of Use Mean (sd) Low Flexibility: Simple 59.18 (24.18) 53.67 (17.47) 3.68 (1.14) Low Flexibility: Intermediate 66.89 (21.39) 47.14 (18.96) 3.33 (1.35) Low Flexibility: Complex 65.35 (25.01) 48.93 (19.95) 3.78 (1.01) High Flexibility: Simple 60.07 (22.83) 45.21 (15.29) 3.27 (1.31) High Flexibility: Intermediate 70.70 (22.72) 44.79 (15.29) 3.32 (1.31) High Flexibility: Complex 62.55 (23.28) 47.23 (12.39) 3.52 (1.23)
Evaluation of Pedometer Interfaces for Mobile Apps 219
Table 2. Intention of Use Questions (1 = Strongly Disagree; 5 = Strongly Agree).
Table available in the original PDF paper.
Statements Low Flexibility: Simple Mean (sd)
Low Flexibility: Complex Mean (sd)
High Flexibility: Simple Mean (sd)
High Flexibility: Complex Mean (sd)
Low Flexibility: Intermedi- ate Mean (sd)
High Flexibility: Intermedi- ate Mean (sd) 4.27 (1.19) 3.84 (1.46) 4.08 (1.26) 3.87 (1.41) 3.87 (1.42) 3.62 (1.69)
1. I intend to use this pedometer app in the future
4. In the future, I will use this pedometer app significantly more often than other pedometer
interface (e.g., “What was the number of steps taken today?; “In this app, are you able to look at the total distance walked for today?” If participant answered yes, a follow up question would appear stating, “What was the total distance for today?”).
Procedure Participants from MTurk who created a worker account were able to view and access the study online. The description of the task was “Answer a series of questions based on an interface designed for a pedometer app, and provide subjective ratings on the ease of use and your intention to use the pedometer app.” When the participants selected to sign up for the study, they were presented with one of two URL links to the Qualtrics surveys. The survey began with the informed consent form. After providing infor- med consent, participants were presented with the first interface and asked to answer 8 questions that require them to extract information from that particular pedometer interface. Then participants were asked to complete the SUS questionnaire (Brooke, 1996), and evaluate their likelihood of conti- nuing to use the pedometer app (Pasha & Indrawati, 2020) based on the interface. This procedure was repeated for the remaining two pedometer interfaces.
Once the participants completed the tasks for all three pedometer apps, they were asked to answer some demographic questions and indicate their experience level with pedometer apps and mobile health apps. Upon completing the survey, the participants were thanked for their participation
220 Tran and Vu
Figure 1: Interfaces Low (top) and High (bottom) Flexibility: Simple (left), Intermediate (middle), Complex (right) Simpliticty.
in the study and provided with a code to confirm their survey completion. They used the code to receive $2 USD from MTurk. These procedures were approved by the California State University, Long Beach Institutional Review Board (IRB).
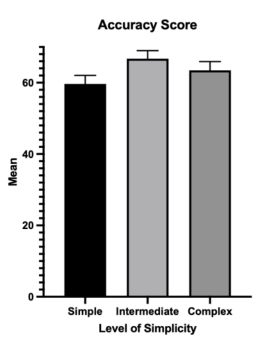
RESULTS & DISCUSSION The average completion time for the survey was 20 minutes. For each inter- face, the comprehension questions were scored for accuracy. Mean percent of correct response was submitted to a 2 (Flexibility: Low vs. High) x 3 (Simplicity: Simple, Intermediate, or Complex) ANOVA (see Table 1, second column, for means). Only the main effect of simplicity was significant, F(2,188) = 5.41, p = .005. As shown in Figure 2 (left graph), the mean accu- racy scores were 59.62%, 66.72% and 63.47% for the simple, intermediate,
Evaluation of Pedometer Interfaces for Mobile Apps 221
Figure 2: Mean of accuracy score and intention of use score.
and complex interfaces, respectively. Pairwise comparisons show that the difference between the intermediate and simple conditions were significant (p = .001), and the difference between the simple and complex conditions approached statistical significances (p = .058). Thus, participants were able to answer more of the questions correctly with the interface that was inter- mediate in terms of simplicity. No other main effects or interactions were significant.
The mean score for the System Usability Scale (SUS) are shown in the third column of Table 1 for each interface. SUS scores of 70 or higher are typically considered indicative of a usable interface. The SUS scores for all interfaces in the current study were well below 70. These low scores may reflect the fact that participants were not actively using the pedometer app in the present study. Instead, they were only looking at screen shots of the mock-up interface and searching for the information without being able to interact with the interface in real-time.
For intention of use, there was a significant main effect of simplicity, F(2,188) = 4.69, p = .010. As shown in Figure 2 (right graph), the mean intention of use scores were 3.48, 3.32, and 3.65 for the simple, interme- diate, and complex simplicity conditions, respectively. Pairwise comparisons show that only the difference between the intermediate and complex con- ditions were significant (p = .007). These findings was not in the predicted direction. Participants in the current study had higher intentions to use the complex interface compared to the intermediate and simple interfaces, and the flexibility of the interface did not matter.
CONCLUSION
The goal of this study was to examine how different levels of flexibility and simplicity would affect the ease of use and intention of use of the participants. For the mock-up interfaces used in the present study, we found that there were significant effects of simplicity on our dependent measures, but no significant
222 Tran and Vu
effects of flexibility or interactions between flexibility and simplicity. Partici- pants performed better when the interface was intermediate in simplicity, that is, not too simple or too complex. However, participants’ rating of intention to continue to use the interface did not match with their performance. That is, participants indicate that they would be more likely to use interfaces that were more simple or complex compared to the intermediate one. The results of this study shows that participants may indicate that user preferences and performance may not match (Bailey, 1993), which is consistent with prior findings that users are not necessarily good at predicting their performance with different display-control mappings without actual experience with the mappings (Vu & Proctor, 2003). Thus, designers must exert care to bala- nce their interface designs in terms of simplicity and should always test their interfaces for performance.
ACKNOWLEDGMENT
This research was supported by the National Institute of General Medi- cal Sciences of the National Institutes of Health under Award Numbers; UL1GM118979; TL4GM118980; RL5GM118978. The content is solely the responsibility of the authors and does not necessarily represent the official views of the National Institutes of Health.
REFERENCES
Babich, N. (2019, October 7). The 4 Golden Rules of Ui Design: Adobe XDideas.
Ideas. Retrieved October 4, 2022, fromhttps://xd.adobe.com/ideas/process/ui-de sign/4-golden-rules-ui-design/ Bailey, R. W. (1993) Performance vs. Preference. In: Proc. Human Factors& Ergonomics Society 37th Annual Meeting, Seattle, WA, pp. 282–286. Santa Monica, CA. Brooke, J. (1996). Sus: A ‘quick and dirty’ usability scale. UsabilityEvaluation In
Industry, 207–212.https://doi.org/10.1201/9781498710411-35 Chadwick-Dias, A., McNulty, M., & Tullis, T. (2002). Web usability andage. ACM SIGCAPH Computers and the Physically Handicapped, (73-74), 30–37. https: //doi.org/10.1145/960201.957212 KC, B., Alrasheedy, A., Goh, B. H., Blebil, A., Bangash, N. S., MohamedIbrahim,
M. I., & Rehman, I. U. (2021). The types and pattern of use ofmobile health applications among the general population: Across-sectional study from Selangor, Malaysia. Patient Preference andAdherence, Volume 15, 1755–1762. https://doi. org/10.2147/ppa.s325851 Krans, B. (2018, August 20). Blood glucose monitoring: How it works. Healthline.
Retrieved September 20, 2022, fromhttps://www.healthline.com/health/blood- glucose-monitoring Myers, J. (2003). Exercise and cardiovascular health. Circulation, 107(1).https://doi.org/10.1161/01.cir.0000048890.59383.8d Pasha, S. M., & Indrawati (2020). Measurement Tool for ContinuanceIntention towards Mobile Games Application. International Journal ofScience and Research (IJSR), 1265–1267. https://www.ijsr.net/get_abstract.php?paper_id=S R20219130247 Story, M. F. (1998). Maximizing usability: The principles of universaldesign. Assistive
Evaluation of Pedometer Interfaces for Mobile Apps 223
Smith-Gratto, K., & Fisher, M. M. (1999). Gestalt theory: A foundationfor instructional screen design. Journal of Educational TechnologySystems, 27(4), 361–371. https://doi.org/10.2190/kvve-b0el-b0cj-92km United Health Foundation. (2021). Executive brief: 2021 annual report. America’s
Health Rankings. Retrieved September 20, 2022, from https://www.americasheal thrankings.org/learn/reports/2021-annual-report/executive-brief Vaghefi, I., & Tulu, B. (2019). The continued use of mobile healthapps: Insights from a longitudinal study. JMIR MHealth and UHealth, 7(8). https://doi.org/10.2196/ 12983 Vu, K.-P. L., & Proctor, R. W. (2003). Naïve and experienced judgmentsof
stimulus-response compatibility: Implications for interface design. Ergonomics, 46,169–187. Walker, B. N., Tomlinson, B. J., & Schuett, J. H. (2017). Universaldesign of mobile apps: Making weather information accessible. UniversalAccess in Human–Computer Interaction. Design and Development Approachesand Meth- ods, 113–122. https://doi.org/10.1007/978-3-319-58706-6_9 Wildenbos, G. A., Jaspers, M. W. M., Schijven, M. P., & Dusseljee-Peute, L. W.
(2019). Mobile health for older adult patients: Using anaging barriers framew- ork to classify usability problems. InternationalJournal of Medical Informatics, 124, 68–77.https://doi.org/10.1016/j.ijmedinf.2019.01.006
LISTED IN THE AHFE DIGITAL BOOKSTORE CATALOGUE
Explore the complete digital volume
Neuroergonomics and Cognitive Engineering
Read this individual research paper free through the original publisher, or explore the full digital proceedings book.
ISBN 978-1-958651-78-0
Explore this ISBN in the AHFE Bookstore ↗Listed in the July 2026 bookstore catalogue; search by ISBN to confirm current availability · Digital book purchase optional