James Miles, Monica Rosas (2023). Change Detection in Head-Up Displays (HUDs) and Twilight Environments. In: Human Factors in Transportation. AHFE Open Access, vol. 95, pp. 521–529. https://doi.org/10.54941/ahfe1003837
In the current research, we evaluated the influence of Head-Up Display (HUD) luminance configurations on change detection in mixed luminance environments (i.e., twilight conditions - sunrises and sunsets). Such environments provide a particular challenge for determining the appropriate HUD luminance. Using the flicker paradigm, participants viewed an image of a HUD overlaid on a twilight environment and had to detect changes that could occur on the HUD display or in the environment. The HUD luminance was configured in one of three ways: bright, dim, and segmented (bright above the midline, dim below – matching the entire twilight environment). Although segmented HUDs seem to intuitively provide a compromise in twilight conditions, we found that this was not the case – detection performance was overall lower with segmented HUDs than with uniform HUDs. We discuss how the current results relate to spatial as well as object-based attention orienting when HUDs are used. Additionally, we provide potential reasons for the inferiority of segmented HUDs, including a reduced ability to separate information displayed on the HUD and in the environment from one another when scanning the display.
Head-Up Displays (HUDs) are composed of a combiner glass that superimpo- ses images of instruments and/or symbology on a projected display between the pilot and the windshield (McCann et al. 1993). HUDs provide increa- sed accessibility to important information about the aircraft’s status, which have created an increased interest from airline companies to install HUDs in commercial airliners (Ingman, 2005; Neville & Dey, 2012). However, HUDs may also lead pilots to miss unexpected events in the environment through cognitive tunneling, in which pilots fixate their attention on HUD symbology (Ververs & Wickens, 1998; Wickens, Fadden, Merwin, & Ververs, 1998). This in turn leads to reduced situational awareness for the pilot (Endsley, 1988). Cognitive tunneling appears to reflect an inability to concurrently focus attention on the HUD and environmental information (Foyle, Sanford & McCann, 1991). Several suggestions have been made to mediate the effect of cognitive tunneling. For example, placement of HUD symbology outside the flight path (usually near the top and bottom of the display) improves dete- ction of changes in the flight path, such as other aircraft (Foyle, McCann,
Sanford, & Schwirzke, 1993). Additionally, the use of conformal symbo- logy such as the “tunnel-in-the-sky” in which HUD elements synthesize with the outside environment improves overall awareness within the HUD and external environment (Ververs & Wickens, 2000).
HUD Luminance and Change Detection Several studies have also examined the role of HUD display luminance on detection of changes in information presented on the HUD versus those in the external environment (Kelly, Ketchel & Strudwick, 1965; Karar & Ghosh, 2012; Schön, 2008; Wickens & Verners, 1998). For example, Karar and Ghosh (2012) investigated the ability to detect changes on the HUD and in the environment by manipulating environment brightness, HUD/environ- ment contrast ratio, and the HUD brightness non-uniformity. They found that changes in the HUD were more difficult to identify in extremely bright environments but there was no problem in identifying changes in the envi- ronment. As the background brightness decreased, the detection rate of the stimuli in the background also decreased. Additionally, reduced background brightness improved the overall contrast ratio, which helped facilitate dete- ction of changes in the display but reduced the visibility of the background scene. In other words, there was a clear trade-off between background bri- ghtness and display brightness. Display luminance levels and the background brightness can also be a factor when a HUD is cluttered, that is, when more information needs to be displayed than usual. Such clutter on the HUD adver- sely affects the detection of the near and far domain; however, this effect was countered when the contrast of the ratio was increased (Wickens & Ver- ners, 1998). Once again, there is a clear benefit when the display levels are adjustable to match background luminance.
To mitigate cognitive tunneling and disproportionate display luminance levels due to uneven background brightness, Schön (2008) proposed that display brightness level should be divided according to the horizon line, depending on the ambient brightness. For example, if the background bri- ghtness is caused by the rising sun and is focused mainly at the top of the screen, then the display luminance should be higher above the horizon line and lower below the horizon line. Schön (2008) further suggests using a sen- sor to detect background brightness and make adjustments to the HUD to match local luminance within the environment.
Current Study In order to further investigate the role of HUD brightness in twilight condi- tions, the present study used a flicker paradigm to assess change detection within the HUD and the external environment. In the flicker paradigm, an original and modified image are presented in rapid alternation with a blank screen between them (Rensink et al., 1997). Observers respond as soon as they detect the changing object. It is generally assumed that in order to notice the modification or change, attention needs to be on the changing stimulus; otherwise, the change will go unnoticed (Rensink, 2002). Thus, success rate in
Change Detection in Head-Up Displays (HUDs) and Twilight Environments 523
change detection within the flicker task can be considered a rough proxy mea- sure of whether a particular stimulus change has captured attention (Simons & Rensink, 2005).
As mentioned previously, the contrast between HUD and environment luminance plays an important to role in the detection of changes within both the HUD and environment. Brighter HUDs improve the detection of informa- tion within the HUD at the cost of environmental change detection, and vice versa. Finding the correct balance between HUD and environment brightness is more complex in twilight conditions, in which the environment brightness is nonuniform - brighter above the display midline dimmer below. One possi- ble solution is the use of a HUD with segregated brightness, in which the HUD is brighter above the midline and dimmer below the midline, matching the non-uniform environment. In theory, a segregated brightness HUD should be the “best of both worlds,”providing increased visibility to the HUD in the bri- ght environment above the midline and visibility of the dimmer environment below the midline. However, it is possible that the nonuniform brightness of such a HUD may also interfere with change detection due to its increased visual complexity (Karar & Ghosh, 2012).
METHOD
Participants Forty-two undergraduate students from California State University, Long Beach (Age: M = 19.62, SD = 2.37; 13 male, 29 female) participated for course credit. No one reported colorblindness.
Materials
The experiment was conducted on the participants’ personal computers using Psytoolkit online experiment platform (Stoet, 2010, 2017). The program was restricted to PC Desktop computers, but due to the online nature of the expe- riment monitor display size could vary and exact luminance levels could not be determined.
Twelve images were selected from a Google Search depicting twilight con- ditions from an aerial perspective. Two modified versions of each image were created – one with a change above the midline and one with a change below the midline. The changes were contingent on the content of each image. Examples of changes include the appearance of a cloud or bird above the midline of the image and the appearance of a hill or building below the midline. Uniform bright and dim HUD overlays were then applied over the image. Although the environment brightness greatly varied, brightness con- trasts were calculated by comparing the HUD elements to an average of the largest uniform elements in the environment. The contrast ratios were appro- ximately 3:1 for the Bright HUD above the midline, and 12:1 below the midline. The Dim HUD had a contrast ratio of approximately 1:2.5 above the midline and 1.5:1 below the midline. A third segmented HUD was also used in which the brightness matched the uniform bright HUD above the midline (3:1 contrast) and the uniform dim HUD below the midline (1.5:1
524 Miles and Rosas
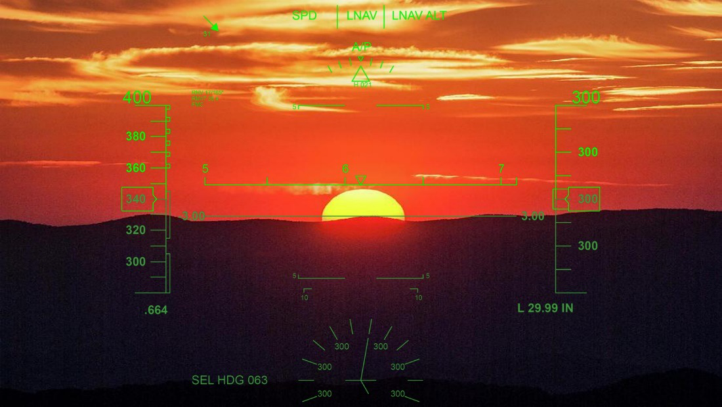
Figure 1: Example of image used in the present experiment depicting twilight conditi- ons with a segmented luminance HUD overlay. The same HUD symbology was used on all images.
contrast). An example of a twilight image with the segmented HUD overlay is illustrated in Figure 1. As with the twilight images, two different changes in the HUD were created, one above the midline and one below. These changes included alterations in the numbers or symbology, as well as the appearance or disappearance of indicator lines. HUD changes were identical in each of the different HUD types. In summary, there were 12 twilight images with 3 different HUD overlays, with changes occurring in either the HUD or envi- ronment and either above or below the midline, for a total of 144 different combinations.
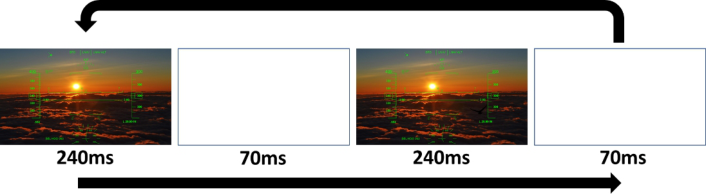
Procedure In each trial, one of the twilight environments with the HUD overlay was displayed for 240ms, then a white screen followed for 70ms, followed by the modified image with a change for 240ms, followed again by the white screen for 70 ms (see Figure 2). This sequence cycled until either a response was made (SPACE bar press) indicating that the change was noticed, or until 10 seconds passed. If after the 10 seconds there was no response, the experiment the trial ended.
Following the response indicating a detection of the change to the repe- ating images, the question “Did the change occur in the HUD or in the background?” appeared. Participants clicked on either the word “HUD” or “Background” at the center of the screen depending on the type of change they believed occurred. After selecting the type of change, the following screen displayed three rectangles separating the screen into the top third, middle third, and bottom third. Participants clicked the mouse button with the cursor over the rectangle that best matched the location of the change.
Change Detection in Head-Up Displays (HUDs) and Twilight Environments 525
Figure 2: The sequence of the flicker paradigm. The first image occurred for 240ms, followed by a blank white screen for 70ms, followed by the modified image for 240ms, and finally another blank white screen for 70ms. The sequence then repeats.
Only trials in which participants responded to the images and correctly indi- cated the type of change (i.e., HUD or background) and location of the change were considered correct detections.
At the beginning of the experiment, participants completed a training block consisting of 12 trials before the test trials began. There were 6 test blocks in total, with 24 trials in each block. Each block included 2 trials with each image, an equal number of trials with each HUD configuration, and an equal number of trials in which changes occurred in the top and bottom of the HUD and environment.
Results
A 3 (HUD Brightness: Bright, Dim, Segmented) x 2 (Change Type: HUD, Environment) x 2 (Change Location: Above, Below) within-subjects analy- sis of variance (ANOVA) on detection rates. Correct detections were trials in which the participants correctly selected the type of change (HUD or back- ground) and the location of the change (top, middle, bottom). Incorrect responses or lack of response were marked as inaccurate responses.
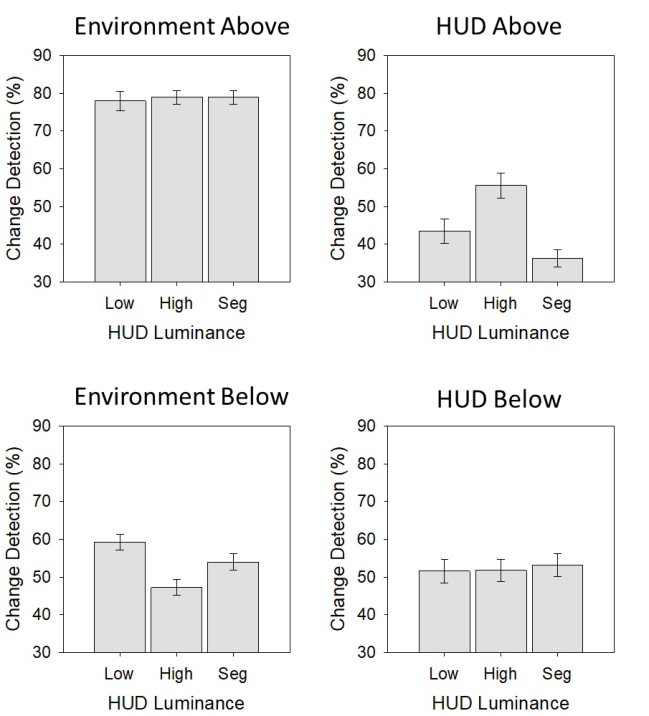
Results are shown in Figure 3. A main effect was found for Change Type, with more changes detected in the environment (M = 66%, SE = 1%) than the HUD (M = 49 %, SE = 3%), F(1,41) = 82.53, p <.001. Additionally, change detection was overall better above the midline (M = 62%, SE = 2%) than below (M = 53%, SE = 1.9%), F(1,41) = 59.86, p <.001. An inte- raction was also found between Change Type and Change Location, F(1, 41) = 151.28, p <.001. Participants had higher detection rates in the envi- ronment above the midline (M = 79%, SE = 1.7%) than below (M = 54%, SE = 1.5%). However, when the change was in the HUD, participants dete- cted more changes below the midline, (M = 52%, SE = 3.8%) than above (M = 45%, SE = 2.5%). These differences may be attributed to the stimulus changes selected by the experimenters – it is likely that changes in the envi- ronment above the midline were simply easier to detect than those selected for below the midline and vice-versa for the HUD. However, we believe the selected changes remained at a reasonably similar difficulty, ranging from 53% to 66%. A main effect of HUD type indicated slightly better change detection rates for any type of change in bright (M = 58%, SE = 2%) and dim
526 Miles and Rosas
Figure 3: Change detection rates for environment and HUD changes above and below the midline for low, high, and segmented (Seg) HUDs. Error bars represent standard error (SE).
HUDs (M = 58%, SE = 2%) compared to segmented HUDs (M = 56%, SE = 2%), F(2, 82) = 3.57 p = .033. Notably, the HUD type also influenced detection rates differently for changes in the environment versus HUD, F(2, 82) = 17.00, p <.001. For environment changes, detection rate was best with Dim HUDs, (M = 69%, SE = 2.0%), second best with a Segmented HUDs, (M = 66%, SE = 1.4%), and lowest with a bright HUDs (M = 63%, SE =1.6%). For HUD changes, detection rate was best with the bright HUD (M = 54%, SE = 2.8%), followed by the dim HUD (M = 48%, SE = 2.9%), and the lowest for the Segmented HUD, (M =45%, SE = 2.3%).
There was also a significant interaction between HUD type and change location, F (2, 82) = 16.82, p <.001. When the change was at the on top, detection rate was best when using the Bright HUD, (M = 67% SE = 2.3%), the second best was the Dim HUD (M = 61%, SE = 2.4%), and the lowest was the Segmented HUD, (M = 58%, SE = 1.6%). When the change was at the bottom, detection rate was best in the Dim HUD (M = 56%, SE = 2.2%),
Change Detection in Head-Up Displays (HUDs) and Twilight Environments 527
the second best was the Segmented HUD, (M = 54%, SE = 1.6%), and the worst with the Bright HUD, (M = 50%, SE = 2.0%).
Most importantly, the three-way interaction was also significant, F(2, 82) = 6.32, p = .003. Further Paired Samples Tests indicated that there was no effect of HUD type on environment changes above the midline or HUD changes below the midline. In other words, environment changes in a bri- ght environment and HUD changes in a dim environment are unaffected by HUD luminance configuration. However, for HUD changes above the mid- line, detection rate was best with a bright HUD, followed by a dim HUD, and worst with a segmented HUD, p’s <.05. For environment changes below the midline, detection rates were best for dim HUDs, followed by segmented HUDs and worst with bright HUDs, p’s <.05.
DISCUSSION
The current study used the flicker task to evaluate whether segmented bri- ghtness HUD displays improve overall change detection in the HUD and environment during twilight conditions compared to uniformly high and dim displays. As shown in prior research, a clear trade off in change detection was observed for uniform brightness displays (Karar & Ghosh, 2012). Bri- ght HUDS lead to the highest HUD change detection above the midline, where the environment was also bright, but lead to the lowest environ- ment change detection below the midline, where the environment was dim. Conversely, uniform dim displays improved the detection of dim environment changes below the midline, and poorer HUD change detection in the bright environment above the midline.
In theory, segmented HUDs should provide the combined benefits of uniform bright and dim HUDs without trade-offs between HUD and envi- ronment change detection. However, the results of the present study indicated that this was not the case – segmented HUDs lead lower environment change detection below the midline than uniformly dim HUDs and the worst HUD change detection above the midline. This is surprising, considering that segmented displays had the same brightness as the best performing bright HUD above the midline and best performing dim HUD below the midline. It is likely that the lower-than-expected change detection rate in the segmented HUDs is related to the non-uniformity of its brightness. Such non-uniformity may increase difficulty grouping the HUD elements together and separating them from the environment, which in turn reduces the efficiency of visual scans of the material. Future work on this topic would benefit from the inclusion of eye tracking data to verify this speculation.
LIMITATIONS Online studies provide a fast and efficient way to collect research data; howe- ver, there is a cost to experimental control and precision. Although the current results are generally consistent with prior work, it was not possible to pre- cisely control specific stimulus features such as screen size and luminance.
528 Miles and Rosas
Additionally, with less oversight, it is not clear whether participants perfor- med the experiment with undivided attention and remained on task at all points. In regard to the experimental design, there are several other limitati- ons. First, although we believe that the flicker task is a useful tool in further evaluating interface design issues such as HUD overlays, the stimuli were by necessity static rather than dynamic. Prior work has indicated movement differences between the environment and HUD in more naturalistic aircraft situations may further aid in separating HUD and environment information from one another (McCann et. al, 1993). Likewise, the current experiment used 2-dimentional overlays on images of flight environments rather than 3-dimensional overlays found in aircraft further hindering separation of the HUD from the environment. Second, the screen flicker inherent to the flicker task also does not match a pilot’s experience in an aircraft. Nonetheless, we believe that the use of tasks such as the flicker paradigm provide additional experimental control and convergent validity to the findings of research using flight simulation scenarios. Last, some changes within the task were reused across several trials, allowing participants to potentially develop expectati- ons of change location and affecting scan patterns. Although this issue is partially solved by counterbalancing the order of trial presentation between participants. Single presentations of unique changes would better address this possibility in future studies.
CONCLUSION
Segmented HUDs may ultimately provide some benefits to the pilots, but there are still some remaining concerns. Although segmented HUDS reduced issues of brightness trade-offs between the HUD and environment, they were not superior overall to uniform bright and dim HUDs in regard to change detection in twilight conditions examined in the present study.
ACKNOWLEDGMENT
The authors would like to acknowledge all of the student assistants in the Miles Action and Perception (MAP) Lab who helped with data collection as well as Kim-Phuong Vu for assistance on the maniscript.
REFERENCES
Endsley, M. R. (1988, October). Design and evaluation for situation awareness enhancement. In Proceedings of the Human Factors Society annual meeting (Vol. 32, No. 2, pp. 97–101). Sage CA: Los Angeles, CA: Sage Publications. Foyle, D. C., Sanford, B. D., & McCann, R. S. (1991, January). Attentional
issues in superimposed flight symbology. In International Symposium on Aviation Psychology. Foyle, D. C., McCann, R. S., Sanford, B. D., & Schwirzke, M. F. (1993, October). Attentional effects with superimposed symbology: Implications for head-up displays (HUD). In Proceedings of the human factors and ergonomics society annual meeting (Vol. 37, No. 19, pp. 1340–1344). Sage CA: Los Angeles, CA: SAGE Publications.
Change Detection in Head-Up Displays (HUDs) and Twilight Environments 529
Ingman, A. (2005). The Head Up Display Concept A Summary with Special Attention to the Civil Aviation Industry. School of Aviation: Lund University, 1–18. Kelly, C., Ketchel, J., & Strudwick, P. (1965). Experimental evaluation of head-
up display high brightness requirements (Brightness requirements for Head-up aircraft instrument display system). Karar, V., & Ghosh, S. (2012). Effect of varying contrast ratio and brightness nonuniformity over human attention and tunneling aspects in aviation. International Journal of Electronics and Communication Engineering & Technology (IJECET), 3(2). McCann, R. S., Lynch, J., Foyle, D. C., & Johnston, J. C. (1993). Modelling Atten-
tional Effects with Head-up Displays. Proceedings of the Human Factors and Ergonomics Society Annual Meeting, 37(19), 1345–1349. Neville, R., & Dey, M. (2012). Innovative 787 Flight Deck Designed for Efficiency, Comfort, and Commonality. Aircraft Engineering and Aerospace Technology, 11–17. Rensink, R. A. (2002). Change detection. Annual review of psychology, 53(1),
245–277. Rensink, R. A., O’regan, J. K., & Clark, J. J. (1997). To see or not to see: The need for attention to perceive changes in scenes. Psychological science, 8(5), 368–373. Schön, P. (2008). Head-up display with brightness control. European Patent Specifi-
cation, 1–17. Simons, D. J., & Rensink, R. A. (2005). Change blindness: Past, present, and future.
Trends in cognitive sciences, 9(1), 16–20. Stoet, G. (2010). PsyToolkit: A software package for programming psychological experiments using Linux. Behavior research methods, 42, 1096–1104. Stoet, G. (2017). PsyToolkit: A novel web-based method for running online questi-
onnaires and reaction-time experiments. Teaching of Psychology, 44(1), 24–31. Ververs, P. M., & Wickens, C. D. (1998). Head-up displays: effect of clutter, display intensity, and display location on pilot performance. The International Journal of Aviation Psychology, 8(4), 377–403. Ververs, P. M., & Wickens, C. D. (2000, July). Designing head-up displays (HUDs)
to support flight path guidance while minimizing effects of cognitive tunneling. In Proceedings of the Human Factors and Ergonomics Society annual meeting (Vol. 44, No. 13, pp. 45–48). Sage CA: Los Angeles, CA: SAGE Publications. Wickens, C. D., Fadden, S., Merwin, D., & Ververs, P. M. (1998, October). Cognitive factors in aviation display design. In 17th DASC. AIAA/IEEE/SAE. Digital Avio- nics Systems Conference. Proceedings (Cat. No. 98CH36267) (Vol. 1, pp. E32-1). IEEE. Wickens, C, D., & Verners, M, P. (1998). Allocation of Attention with Head-Up-
Displays. US Departmnet of Transportation, Federal Aviation Administration.
LISTED IN THE AHFE DIGITAL BOOKSTORE CATALOGUE
Explore the complete digital volume
Human Factors in Transportation
Read this individual research paper free through the original publisher, or explore the full digital proceedings book.
ISBN 978-1-958651-71-1
Explore this ISBN in the AHFE Bookstore ↗Listed in the July 2026 bookstore catalogue; search by ISBN to confirm current availability · Digital book purchase optional