Pedro Fonseca, Ricardo Vigário, Ana Teresa Videira Gabriel, Isabel L. Nunes, Carla Quintão, Cláudia Quaresma (2023). Validation of a rehabilitation platform for visuomotor perceptual and cognitive stimulation. In: Human Factors and Systems Interaction. AHFE Open Access, vol. 84, pp. 102–111. https://doi.org/10.54941/ahfe1003595
1 Physics Department, NOVA School of Science and Technology – FCT NOVA, Universidade Nova de Lisboa, 2829–516 Caparica, Portugal ↗
2 UNIDEMI, Department of Mechanical and Industrial Engineering, NOVA School of Science and Technology – FCT NOVA, Universidade Nova de Lisboa, 2829–516 Caparica, Portugal ↗
Stroke, or cerebrovascular accident, is a major global health problem and one of the leading causes of death and acquired disability worldwide. After a stroke, deficits in perceptual and cognitive functions may arise, with particular emphasis to impairments caused to visuomotor skills. In this way, its stimulation, within a therapeutic rehabilitation context, is truly relevant for the recovery of lost functions. RehabVisual, presented in earlier works, is a digital platform that allows for an objective and standardized assessment of visuomotor skills and specific clinical interventions for each patient. In the current work, new features are added to the platform, to make it more optimized and suitable for use in clinical practice, with adults who suffered a stroke. Herein the platform is also thoroughly validated with healthy subjects.Objective: This work’s goals are twofold: to assess the accuracy of the eye tracking system developed, which is integrated in the platform; and to test and validate the digital platform itself, with a population of healthy subjects.Methodology: 50 healthy subjects tested the RehabVisual digital platform in a laboratory context. In addition to testing the overall visuomotor rehabilitation functions, dynamic stimuli following was collected from both the platform’s own camera and a Tobii Pro Nano Eye Tracker, which is considered as gold standard to assess direction of gaze. The results of both systems were compared.Results: The platform’s own eye tracking apparatus revealed a good performance, in par with the gold standard, following the evolution of visual stimuli with sufficient accuracy, which ensures the suitability of its use in the context of gaze detection during rehabilitation. Conclusions: The validated gaze tracking ability, together with fact that both stimulus delivery and eye tracking is performed with the same device guarantees synchrony between both streams of data. Recorded videos of those signals allows for the design of new and personalized clinical evaluation and intervention strategies, to be applied throughout the rehabilitation program. Those may be used to complement physiotherapist’s evaluation of patients and allow for the identification of possible changes in their visuomotor skills.As an added feature, a new usability questionnaire was filled by a group of occupational therapists, which reinforced the potential use of the new version of RehabVisual, when applied to visuomotor rehabilitation of stroke patients.
Stroke, or cerebrovascular accident is a major global health condition, with a high risk of death. Around 15 million people suffer a stroke, yearly, of which one third will die and another third will be left permanently disabled (WHO EMRO, 2022). It can be estimated that one in four adults, over 25 years of age, will have a stroke in their lifetime (WSO, 2022). Even when surviving a stroke, neurological deficits may arise, with dramatic effects on the person’s motor, sensory, cognitive and/or emotional functions. The ensuing disabi- lity levels range from mild effects to complete patient’s dependence (Kasner, 2006). Rehabilitation plays a crucial role in mitigating those effects. Since
75% of all surviving patients will show significant degradation in visuomo- tor coordination, rehabilitation programs should always include stimulation of those competences (Colwell et al., 2021).
RehabVisual is a rehabilitation platform, built around a laptop, which is responsible for delivering visual stimulation and for collecting the subjects’ gazing movements, both to evaluate their condition, as well as to develop more personalized interventions. It was developed, originally, for the asses- sment of visuomotor abilities in toddlers (Machado et al., 2018), and further evolved to support rehabilitation programs for stroke patients (Rodrigues et al., 2022). Although a preliminary evaluation of RehabVisual’s usability has been done in the past, a systematic assessment of it has not been carried out in the context of stroke rehabilitation. More importantly, since the plat- form’s performance depends considerably on the ability to accurately record and exploit the dynamics of the patient’s direction of gaze, said accuracy needs to be ascertained.
The current study intends to give a proper answer to both validation requi- rements: accuracy assessment is performed through a comparison between simultaneously recorded eye tracking data from RehabVisual’s webcam and a gold-standard device, the Tobii Pro Nano; as for the usability of the propo- sed rehabilitation apparatus, a System Usability Scale (SUS) test is answered by 14 rehabilitation professionals.
MATERIALS AND METHODS
Participants The experiment was performed by 50 subjects, 26 of which female, with no known pathologies. 46% required eyesight correction through glasses or contact lenses, and 66% had right eye dominance. During the experiments, all subjects were asked to remove their glasses, yet guaranteed that stimu- lus was fully perceived. Ages ranged from 18 to 28, with mean value of 22 years for the female cohort, with a standard deviation of 2 years, whereas the male population had a mean value of 21, and a standard deviation of 1 year of age.
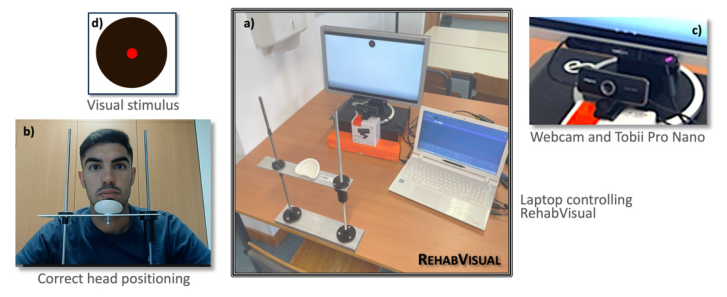
Experimental Setup RehabVisual’s overall experimental setup is shown in the centre of Fig. 1a. It comprises a chin-immobilizer, to ensure a fixed and correct relative posi- tion between the subject and the apparatus’ ensemble screen-camera. One example of its use is given on the lower-left corner, in Fig. 1b.
The laptop’s own screen and camera could have been used to deliver the visual stimulus, as well as to record the subject’s evolving direction of gaze, respectively. Yet, to reduce visual clutter for the subject, while improving the quality of both the stimulation and the recording, a dedicated screen and webcam were employed instead. A very important added value to such con- figuration is that the webcam’s data can be collected very close to where a Tobii Pro Nano is located. Hence, it is easier to compare the results propo- sed by the webcam’s own gaze estimations and those of the state or the art’s
Figure 1: RehabVisual experimental setup, displayed in the centre, a). The lower-left frame, b), contains an example of use of the chin-immobilizer, whereas the upper-right one, c), zooms in on the webcam and Tobii eye tracker. On the upper-left corner, d), is displayed the visual stimulus employed throughout the experiments.
device. A zoomed portion of the recording setup, placed beneath the screen, is shown on the upper-right corner, in Fig. 1c. A final insert to the figure, on the upper-left corner, Fig. 1d, displays the stimulus employed throughout the experiment.
The screen and both eye trackers were raised to about 25 cm, over the table, to approximate eyesight level, and secure a comfortable viewing position for the subject. Also, the distance between the screen and the subject was kept close to 65 cm, for all participants in the experiment.
The display utilized was a Samsung SyncMaster 205BW (20”), whereas the webcam was a CREATIVE Live Cam Sync 1080p, with a diagonal field of view of 77
, with full HD (1920 × 1080 pixels) recordings, at 30 frames per second. The laptop used to drive the stimuli, as well as to record and process both the web cam and the Tobii data was a TOSHIBA SATELLITE L50-B.
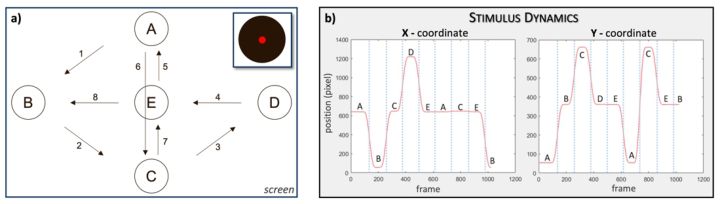
Stimulus Conditions Throughout the study, the stimulus circle moves, within the screen, as displa- yed in Fig. 2a. Each fixation point, from A to E, have a corresponding pair of pixel coordinates, which are shown in Fig. 2b, together with the evolution of the eight successive movements. Such stimulus setup was originally proposed in (Dias, 2020).
Prior to any visual movement, the stimulus was still for 3 s, in the beginning of each recording. The duration of every fixation, in each of the marked locations, was also of 1 s, for a total recording length of 34 s, as displayed in Fig. 2. To facilitate comparisons between the two trackers, data recorded via the webcam and Tobii were manually synchronized, prior to further analysis. The stimulus screen area corresponded to 1280x720 pixels.
Validation of a Rehabilitation Platform 105
Figure 2: Stimulus on-screen evolution path, a) starting in A and ending in B. The pixel coordinates, for both the horizontal, X, and vertical, Y, directions are shown in b).
Measures of Agreement Two different measures of agreement were drawn, from both eye tracking devices to confront RehabVisual’s own approach to the gold-standard. The first, inspired by Tobii’s quality assessment measures, consisted of the time spent in specific areas of interest. Within the calibration stimulus video, such areas were defined around the various fixation locations, A through E in Fig. 1. The areas themselves corresponded to regions, 30% larger than the black visual stimulus circle, centred on those fixation points. The other measure assessed consisted of the mean Euclidean distance between the esti- mated gazing locations and the actual stimulus positions, throughout the video.
Similarities and disparities between RehabVisual and Tobii eye trackers are evaluated via Bland-Altman plots (Bland and Altman, 1986). They are often used, in medical statistics, to compare a new measuring technique or method with a gold standard. It corresponds to a graph of the difference between those two measures, as a function of their average. In such a graph, a mean bias difference between the two measures can be drawn, as well as an agreement interval (AI), defined as the bias plus and minus 1.96 times the standard deviation of the difference between said measures (Myles and Cui, 2007). If both measures agree, and their distribution is normal, 95% of all observations should lie within that interval. Also, a bias closer to zero means that, in average, both measures return similar outcomes. To assess if a deviance from zero is significant, and a correction to such shift should be performed, one may define a 95 % confidence interval for the mean diffe- rence (IC95, in percentage) as IC95 = b ± t × s2/√n, where n stands for the data sample size, t is the value of the t distribution with n -1 degrees of freedom, b is the bias, and s the standard deviation of the difference betw- een measurements. If the zero line, in a Bland-Altman plot lies within the confidence interval, one may say that there is no systematic shift between measurements.
An additional measure was calculated, as a summarising one, as a differe- nce between the average distance between the true location of the stimulus, at any given time, and the estimated locations found by either method, for each eye.
RESULTS
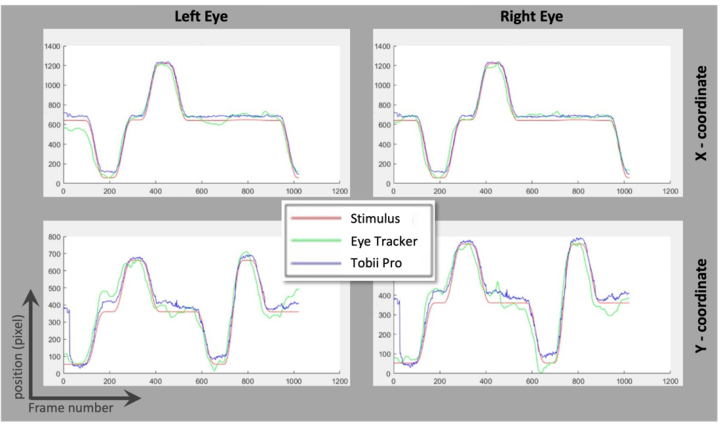
Prior to analysing the Bland-Altmann plots of agreement between the proposed eye tracking device and Tobii’s reference, one may have a quick visual inspection to the (x, y) tracking estimates of the direction of gaze, as displayed in Fig. 3, for both left and right eyes. The red line shows the true evolution of the visual stimulus coordinates, whereas the green and blue correspond to estimates by RehabVisual and Tobii, respectively.
The main perceptual information that one may draw from the figure is that both eye tracking devices follow, rather accurately, the X coordinates of the stimulus. Both left and right eye curves are noisier than the targeted output but identify correctly all transitions and fixations. Another intere- sting outcome is that the Y coordinate estimation seems a bit less accurate than the other coordinate, for both devices. Said difference may be due to variations in eyelid opening during vertical movements, which do not occur during horizontal eye displacements. Our goal is to ascertain that RehabVi- sual’s performance is sufficiently close to that of the gold standard to be used in practise. Bland-Altman analyses do not guarantee accuracy of any of the studied methods. It only evaluates how close they are from each other. The validation sought relies completely on the quality of the target comparing approach. Hence, we chose a widely accepted eye tracking device.
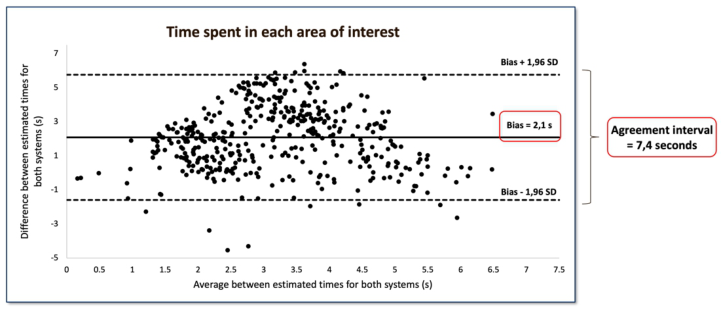
Time in Areas of Interest The Bland-Altman plot in Fig. 4 displays the overall agreement between estimated time spent in each area of interest, for both eye trackers. More
Figure 3: Eye tracking coordinates, as proposed by RehabVisual and Tobii Pro, shown as green and blue lines, respectively. True coordinates for the stimulus are shown in red. The left column corresponds to coordinates estimated for left eye movements, whereas the right column relates to the right visual tracking. X and Y coordinates are shown in the top and bottom frames of the figure, respectively.
Validation of a Rehabilitation Platform 107
Figure 4: Bland-Altman plot for the overall agreement between time spent in all the pre- defined areas of interest, for both the RehabVisual and the Tobii Pro Nano eye trackers. The bias between both models and the 1.96 standard deviations are also marked.
detailed information, focusing also on individual fixation points, is presented in Tab. 1.
Table 2 introduces additional features, specific to each eye tracker, hence not visible from the Bland-Altman plot. They were considered of interest for a more thorough exploration of the relation between both devices. One such feature is the number of missed detections, which corresponds to areas for which the tracker returned a zero-fixation time.
Two significant outcomes can be drawn from both Fig. 4 and Tab. 1. One is that the interval required to hold 95% of all differences is rather large, with 7.4 s in duration. That value is greater than the intended fixation times set for each location point. One possible justification for that may be the defini- tion of a region of interest, rather than a fixed location. The other result is the existence of a clear bias between both eye tracking methods. The bias, or mean difference is equal to 2.1 s, and the agreement intervals, for the com- plete set of areas of interest, as well as each one separately, does not contain the zero line, as clearly visible in Tab. 1. Since all values are greater than 0, one may conclude that RehabVisual’s eye tracker tends to underestimate the values found by Tobii’s.
Table 1. Detailed agreement results for the time spent in areas of interest. All stands for an average over all results obtained for each individual five areas.
Table available in the original PDF paper.
−IC95% (s) + IC95% (s)
Area Bias (s) Lower Lim AI (s)
Upper Lim AI (s)
All 2.1 −1.6 5.8 1.7 2.4 A 2.7 −1.1 6.5 2.3 3.1 B 1.5 −0.6 3.6 1.3 1.7 C 1.7 −2.1 5.5 1.3 2.1 D 0.8 −1.0 2.5 0.6 0.9 E 3.2 −0.5 7.0 2.9 3.6
Table 2. Additional eye tracking characteristics, extracted from each individual device separately.
Table available in the original PDF paper.
# Missed detection RehabVis
Area Stimulus time (s)
Bias/ time (%)
Min time Tobii (s)
Max time Tobii (s)
Min time RehabVis (s)
Max time RehabVis (s) All 23.0 9.1 7.6 23.3 0.3 21.2 75 A 6.5 41.5 2.5 6.8 0.1 6.2 11 B 3.2 46.8 1.8 4.1 0.1 4.4 19 C 5.2 32.7 0.2 5.9 0.1 7.3 4 D 2.4 33.3 0.1 3.2 0.2 2.8 35 E 5.9 54.2 0.6 8.2 0.1 6.4 6
A more thorough analysis of Tab. 1 tells us that the vertical line of stimulus evolution, corresponding to areas A, C and E, results in the poorest agree- ments between the two trackers, whereas the horizontal line, with B, D and, to some extent also C correspond to the highest agreements. Interestingly, B and D are also the areas that led to the highest rates of missed detections, as shown in Tab. 2. That may be explained by the fact that, around those areas, displacements are more vertical, which we have already established are less well estimated than horizontal ones, in part because of the longer trajectories of the latter.
One very important finding was that, although the chin support helped limit vertical head movement from the subject, it did not preclude head tilt, when following vertical stimulus displacements. This limitation may have been responsible for the discrepancy between eye tracking accuracies in in the horizontal and vertical directions.
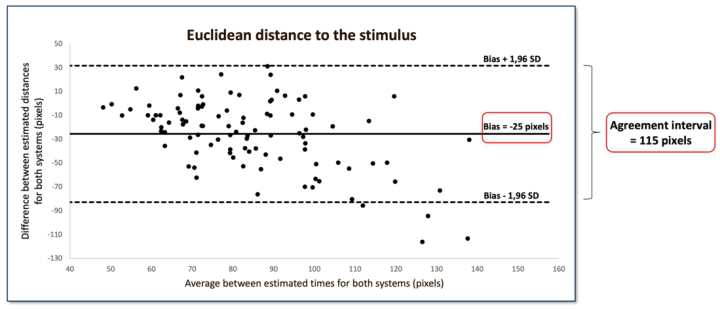
Mean Euclidean Distances The Euclidean distance between all estimated coordinates of the direction of eye gaze and the corresponding stimulus points was analysed also via a Bland- Altman plot, as displayed in Fig. 5, as well as some additional information that is gathered in Tab. 3. Note that data from both eyes is shown, leading to a total of 100 points, i.e., twice the number of subjects in the study.
In line with the previous results, the proposed eye tracker somewhat ove- restimated this error measure. Also, the zero line is not comprised within the confidence interval, rendering the bias less consistent. Yet, if we keep in mind that the diameter of the stimulus, illustrated in Fig. 1, is of 88 pixels, a bias of 25 pixels represents only about 28 % of that size. Hence, the bias can be considered as rather small. The dimension of the agreement interval, 115 pixels, only about 1/3 greater than the stimulus dimension, in a 1280×720 screen, may be considered small.
With the results above one may defend the use of RehabVisual’s appara- tus to assess a patient’s ability to follow visuomotor rehabilitation stimuli. Keeping in mind the maximum distance values for Tobii and RehabVisual, it
Validation of a Rehabilitation Platform 109
Figure 5: Bland-Altman plot for the overall agreement between Euclidean distances to the stimulus coordinates, between both eye trackers.Table 3. Additional data for the comparison between mean Euclidean distances of the estimates.
Table available in the original PDF paper.
- IC95% (pixels)
+ IC95% (pixels)
Bias (pixels)
Lower Lim AI (pixels)
Upper Lim AI (pixels)
-25 -83 32 -31 -20
Euclidean Dist.
Tobii RehabVisual Min (pixels)
Max (pixels)
Min (pixels)
Max (pixels)
40 123 50 194
Euclidean Dist.
seems safe to accept, as a reference, the ability to follow movements between objects distanced by, at least 200 pixels.
Direct Differences Between Eye Trackers A final comparison between eye trackers was computed, resorting once more to the Euclidean distance, now applied directly to their estimates of the dire- ction of gaze. When taking both eyes into account, the 100 pairs of estimates presented a mean distance of 108 pixels, with a standard deviation of 34 pixels. Once more, this value is very small when compared to the overall screen resolution of 1280×720 pixels.
If we separate left and right eye information, the former presented an ave- rage distance of 110 pixels, for a standard deviation of 38 pixels, whereas the latter showed 106 and 31 pixels, respectively. Hence, both eyes presen- ted similar results, suggesting that the lighting conditions were sufficiently uniform to secure accurate and uniform treatment of each eye.
If one isolates X and Y coordinates instead, the horizontal distances range between 66 and 191 pixels, for a mean value of 73 pixels and a standard devi- ation of 31 pixels, whereas the vertical distances range from 27 to 143, for a mean of 65 and a standard deviation of 25 pixels. At first glance these results seem to contradict what we have observed earlier, since vertical displacements were more likely to be erroneous than horizontal ones. Yet, if we attend to the possible range of motion in X, 1280 pixels, and in Y, 720, the mean dista- nces observed represent, in fact, about 5.7% of the horizontal scale, and 9% of the vertical one.
CONCLUSION
The main goal of this study was to assess the accuracy of, and possibly validate the eye tracking system integrated in RehabVisual, a digital reh- abilitation platform, recently adapted to work with stroke patients. Said assessment addressed two main aspects of the eye tracker’s functions: the ability to estimate correctly the position of visual attention onto a screen, with the concomitant ability to follow dynamically evolving visual stimuli; and the estimate of time spent in given areas of interest on a screen. Both studies were performed in comparison with a commercially available gold standard.
Although the estimates of time spent in areas of interest did not warrant a high degree of agreement between both eye tracking devices, that measure is does not have as high clinical value as the ability to identify, accurately, the direction of gaze. In that respect, RehabVisual’s eye tracking system has shown to be within reasonable distance from the accepted gold standard.
The validated gaze tracking ability, together with fact that both stimulus delivery and eye tracking are performed in the same device guarantees synch- rony between both streams of data. Recorded videos of those signals allow for the design of new and personalized clinical evaluation and intervention strate- gies, to be applied throughout the stroke rehabilitation program. Those may be used to complement physiotherapist’s evaluation of patients and allow for the identification of possible changes in their visuomotor skills.
ACKNOWLEDGMENT
Research was supported by Fundação para a Ciência e a Tecnologia through research Grants UIDB/FIS/04559/2020 and UIDP/FIS/04559/2020 (LIBPhys), and LASI-LA/P/0104/2020 (LASI), from FCT/MCTES, Portugal.
REFERENCES
Bland, JM. and Altman, D. (1986) “Statistical methods for assessing agreement between two methods of clinical measurements”, in: The Lancet, Vol. 327 (8476), pp. 307–310. Colwell, M. J., Demeyere, N. and Vancleef, K. (2022) “Visual perceptual deficit
screening in stroke survivors: evaluation of current practice in the United Kin- gdom and Republic of Ireland”, in: Disability and Rehabilitation, Vol. 44 (22), pp. 6620–6632.
Validation of a Rehabilitation Platform 111
Dias, P., Ferreira, A., Vigário, R., Quaresma, C. and Quintão, C. (2020) “RehabVisual: Implementation of a Low Cost Eye Tracker without Pre-calibration”, proceedings of the thirteenth Int. Joint Conf. on Biomedical Engineering Systems and Technologies (BIODIVICES20), pp. 235–241. Kasner, S. E. (2006) “Clinical interpretation and use of stroke scales”, in: The Lancet
Neurology, Vol. 5 (7), pp. 603–612. Machado, R., Ferreira, A., Quintão, C. and Quaresma, C. (2018) “Rehabvisual: Development of an application to stimulate visuomotor skills”, proceedings of the eleventh Int. Joint Conf. on Biomedical Engineering Systems and Technologies (BIODIVICES18), pp. 173–178. Myles, P. and Cui, J. (2007) “I. Using the Bland–Altman method to measure agre-
ement with repeated measures”, in: British Journal of Anaesthesia, Vol. 99 (3), pp. 309–311. Rodrigues, S., Quaresma, C., Hansra, K., et al. (2022) “RehbBrain: A serious gaming platform for perceptual and cognitive rehabilitation”, proceedings of the thirteenth Int. Conf. on Applied Human Factors and Ergonomics (AHFE 2022). WHO EMRO (April 21, 2022) Stroke, Cerebrovascular accident. World Health
Organization Website: https://www.emro.who.int/health-topics/stroke-cerebrov ascular-accident /index.html WSO (April 10, 2022) Learn about stroke. World Stroke Organization Website: http s://www.emro.who.int/health-topics/stroke-cerebrovascular-accident /index.html
LISTED IN THE AHFE DIGITAL BOOKSTORE CATALOGUE
Explore the complete digital volume
Human Factors and Systems Interaction
Read this individual research paper free through the original publisher, or explore the full digital proceedings book.
ISBN 978-1-958651-60-5
Explore this ISBN in the AHFE Bookstore ↗Listed in the July 2026 bookstore catalogue; search by ISBN to confirm current availability · Digital book purchase optional