Kelly Dickerson, John Grasso, Heather Watkins, Niav Hughes (2023). Characterizing Complexity: A Multidimensional Approach to Digital Control Room Display Research. In: Human Factors and Simulation. AHFE Open Access, vol. 83, pp. 67–77. https://doi.org/10.54941/ahfe1003563
Complexity can be characterized at numerous levels; physical, perceptual, and cognitive features all influence the overall complexity of an informational display. The Human Performance Test Facility (HPTF) at the U.S. Nuclear Regulatory Commission (NRC) develops lightweight simulator studies to examine the workload induced by various control room-related tasks in expert and non-expert populations. During the initial development of the lightweight simulator, cognitive complexity was defined based on the number of elements in each control panel. While the number of items roughly maps onto information density, it is only one of several features contributing to display complexity. This study is a follow-up to the original complexity evaluation and includes an initial characterization of the perceptual complexity of a set of control panels in their original (i.e., unmodified) and modified (for cognitive complexity reduction) forms. To assess perceptual complexity, a 3-dimensional approach was developed. The control panel displays were assessed using common measures of physical complexity (e.g., edge congestion, clutter, symmetry), performance-based measures (reaction time and accuracy for target identification), and subjective impressions using a survey adapted from a similar FAA assessment of air traffic controller workstation display complexity. Overall, the results suggested that clutter and symmetry were associated with target identification performance; participants interacting with high symmetry-low clutter displays identified target controls faster than those interacting with low symmetry-high clutter displays. Survey results tended to follow the same pattern as the physical and performance-based results; however, these patterns were not statistically significant, likely due to the small sample size. These initial results are a promising indication that the physical and performance-based measures were valid for assessing display complexity and that they are sensitive to differences in complexity, even with smaller samples. The physical and performance-based measures may be good candidates for human factors validation of future system designs - they are quick and easy to administer while providing a holistic sense of display perceptual complexity. Like other types of surveys, surveys for display complexity often require large samples to detect meaningful differences between groups. System designers and other stakeholders may want to consider alternative strategies, such as physical system measurement and characterization using performance-based methods if the user base is small or designs are in the early stages of development, requiring quick answers and an iterative approach to evaluation.
The NRC staff is responsible for review and approval of the human factors engineering (HFE) aspects of nuclear power plants. As part of this review, the interfaces used by operators are evaluated for conformance with HFE guideli- nes using the Human-System Interface Design Review Guidelines (NRC 2020, NUREG-0700, Revision 3). Much of the technical basis for the NRC’s HFE guidance comes from research conducted in other domains (e.g., aviation, military). In a staff requirements memorandum (SRM), the Commission dire- cted staff to consider using generic simulator platforms to investigate human performance issues in nuclear control rooms (SECY-08-0195). This work is intended to begin to form the nuclear domain-specific foundational technical basis used to enhance future guidance updates.
Conducting human factors research in the nuclear domain is often challen- ging because of limitations inherent in the domain. For example (1) nuclear control room simulators are generally complex and costly, requiring dedica- ted simulator engineering staff. (2) Nuclear control room operations require highly specialized expertise and access to individuals with that domain- specific expertise is highly limited. (3) Access to plant-specific simulators is limited due to their continuous use for training or validation activities. To work around these three challenges, the HPTF team developed a lightweight research simulator that could be used to test both control room operators (in some cases, formerly licensed current NRC staff) and non-experts, such as college students, the general population, and NRC staff lacking operational experience.
However, even a “lightweight” nuclear control room simulator is com- plex and generally requires some level of operational knowledge to operate, thus, finding willing participants from outside the operator community is not the only challenge. To use those non-operators as participants while achieving meaningful and generalizable results, the “lightweight” simulator had to be simplified. The simplification strategy aimed to preserve as much operational realism as possible while establishing approximately equivalent cognitive experiences between operators and non-operators. The systematic simplification approach developed for the HPTF is referred to as the “diffe- rent but equal” approach (Harris, Reinerman-Jones, & Teo, 2017; Hughes, D’Agostino, Dickerson, Matthews, Reinerman-Jones, Mercado, Harris, & Lin, 2022). Table 1 details the types of changes implemented to create the different but equal experience.
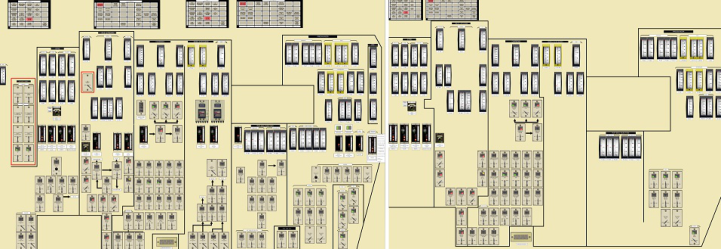
One of the changes implemented to create the “different but equal”experi- ence was a scaled reduction in the number of controls on a panel to minimize frustration related to item identification and limit manual/gestural errors (see Figure 1 for example of a panel before and after reduction in the number of controls). The scaled reduction was applied to one of many control panels, specifically the A2 panel. The designation A2 is a label applied by the simu- lator vendor and is representative of the alphanumeric labelling of nuclear main control room panels. The scaled reduction in the “number of controls included” (Table 1) was applied to “A2” such that the number of controls was roughly equal to those in the simplest panel, “C1”. Removing controls
A Multidimensional Approach to Digital Control Room Display Research 69
Table 1. Types of changes used in “different but equal” scaling method.
Table available in the original PDF paper.
Change Type Description Control nomenclature changes Replacing acronyms with words to reduce system knowledge requirements Control label length changes Recoding alphanumeric control labels to have fewer than 7 characters to reduce memory demands Number of control panels included
Presented only two panels to reduce task-irrelevant and distracting information Number of controls included Scaled reduction in the number of controls to minimize frustration related to control identification and limit manual errors
so that cognitive complexity was roughly equivalent between A2 and C1 was a necessary step for conducting research with non-experts. However, this reduction also changed some perceptual attributes of the displays, for example the observable symmetry between the original and modified pan- els (Figure 1). While the results of Harris et al., (2017) and Hughes et al., (2023) establish the required cognitive equivalence between the modified and unmodified simulator control panels, it is an open question of the impact the modifications had in terms of the perceptual experience, particularly related to symmetry, visual clutter, and overall complexity.
Figure 1: The left depicts an original panel, used by operators during simulator studies. The right image is the simplified panel used by college students.
DEFINING PERCEPTUAL COMPLEXITY Visual perceptual complexity can be defined in terms of perceptual impact of the physical display elements. The overall complexity of a system interface or display is influenced by a multitude of system features including contro- l/interaction, navigational, and structural elements, and the configuration or spatial arrangement of those elements. Determining the overall complexity is usually accomplished through a set of display-based measurements, such as physical dimensions like symmetry or text to graphics ratio (Kim, Lee, Park, Lee, & Yun, 2019; Xing, 2008; Miniukovich & De Angeli, 2014).
Another physical measurement of complexity is (display) clutter (Kim et al., 2019). Clutter is most simply defined as an excess of elements (Horrey & Wickens, 2004), suggesting that clutter is synonymous with item density (see Moacdieh & Sarter, 2015 for other definitions). Clutter is not just an aesthetically problematic excess of elements; it can have significant perfor- mance impacts. Kim et al., found that as clutter was reduced, pilots’ ability to identify threat targets in visual search task improved, both in terms of search time and accuracy. In addition, edge congestion, a measure of item discriminability, is diagnostic for information crowding indicates excessive edge density within an image. Further, there is evidence that performance degrades when the spacing between objects is reduced beyond a critical mini- mum because observers cannot differentiate objects within a display, when edges in proximity are too close (Miniukovich & De Angeli, 2014).
Based on Miniukovich and De Angeli (2014) and others, complexity can be defined by focusing on three main determinants: (1) information quantity, (2) information organization, and (3) information discriminability. Given the determinants of complexity as defined, if complexity is influenced by clutter and the associated item density, the systematic reduction in controls imple- mented in the “different but equal” approach to modification may have also reduced the visual perceptual complexity of the modified displays. Alterna- tively, if complexity is influenced by more than item density, other factors related to the visual perceptual impacts of the reduction of control ele- ments could have neutral or negative impacts on perception and, ultimately, performance.
Physical display metrics are only one aspect of complexity. Subjective expe- riences and performance outcomes, when combined with physical measures provide a more holistic evaluation of the displays. For example, measuring perceived complexity provides insights into the user’s subjective experience of visual complexity. These insights are crucial to consider in overall evalua- tions of display design, particularly for safety related systems, as higher levels of perceived complexity directly impede performance and lead to suboptimal problem-solving with strategy selection and implementation becoming impai- red (Te’eni, 1989). When combined, the measures of physical complexity, performance, and subjective complexity provide a 3-dimensional approach to characterize perceptual complexity.
Present Study The present study uses a combination of physical display metrics, subjective and performance-based measures of visual perceptual complexity to deter- mine the impact that the scaled reduction in cognitive complexity described in Harris et al., (2017) as the “different but equal” approach on perceptual complexity. The survey used for assessing subjective complexity was adapted from an FAA study on the perceived complexity and usability of air traf- fic control displays (Xing, 2008). The performance-based task was a simple visual search procedure, where participants had to locate a set of pre-defined and studied controls (see also Davis, Dickerson, & Gillmore, 2019 for previ- ous use of visual search to assess display usability). The three physical display
A Multidimensional Approach to Digital Control Room Display Research 71
measures were selected based on the work of Kim et al., (2019); Xing, (2008); Miniukovich and De Angeli, (2014) and Moacdieh and Sarter (2015). These represent well established and easy to implement techniques. Additionally, each of the selected measures represents a different aspect contributing to overall complexity: (1) clutter (edge density), (2) symmetry, and (3) edge congestion.
METHOD
Participants Seventeen participants, comprised of NRC interns and full-time staff, were recruited for the study. Participants were eligible for inclusion if they were between the ages of 18–60 and had normal or corrected to normal vision. The final sample included 16 participants; one participant was removed due to experimenter error. This research was reviewed by the Binghamton Uni- versity institutional review board and was conducted in accordance with the Common Rule (45 CFR 46) and applicable Binghamton University policies.
Stimuli The stimuli in this study were three genericized nuclear control room panels. Panel C1 had a total of 112 controls and was the simplest unmodified panel. As the simplest available panel, the previous HPTF studies used this panel to “scale down” other task relevant panels. All the previous HPTF studies minimally also included the A2 panel; given its baseline complexity and its frequency of use, this panel was selected for evaluation in this complexity study. Panel A2 in its unmodified form had 197 controls. In its modified form panel A2 had 113 controls. Each digital panel was displayed at 5120 × 2880 pixels.
Subjective Assessment Procedures Perceived display complexity was evaluated using an established FAA survey for assessing usability and complexity of different designs of air traffic moni- toring system displays (Xing, 2008). This survey was selected because it was lightweight and had been used both in aviation and non-aviation domains. The full survey contained 13 items; the present study used a subset of six items that were directly relevant to complexity. The excluded items were related to usability and were not applicable. The survey was administered immediately after each block of trials. The purpose of repeating the survey was to deter- mine if participants’ subjective rating of complexity changed as a function of experience.
Performance-Based Assessment Procedures Prior to the beginning of the performance assessment, participants were given images of the target controls for a 1-hour self-study familiarization interval. Performance was assessed using a visual search task. For each trial, partici- pants were shown an 8.5 × 11 cm card containing a target and then given access to the panels. At the start of each trial, the researcher oriented the
participant to the panel that would be used for that trial which helped to reduce the size of the search space. The participant searched for each of the eight target controls individually. The participants were instructed that to indicate that they were finished with their search, to click the screen with their finger. There were three trials for each of the eight target controls with one trial per control per block for a total of three blocks. The eight target con- trols were distributed across the two panels, A2 and C1. Participants were divided into two between subjects groups based on two levels of panel type: (1) unmodified and (2) modified. The unmodified panel group searched for targets on the 197 controls on A2 and 112 controls on C1. The modified panel group searched for targets on the 113 controls on A2 and 112 controls on C1. By using the unmodified C1 in both groups, comparisons related to number of items and item configurations could be made. Both response time and accuracy were collected, however, all 16 included participants achieved 100% accuracy therefore only response time was analysed.
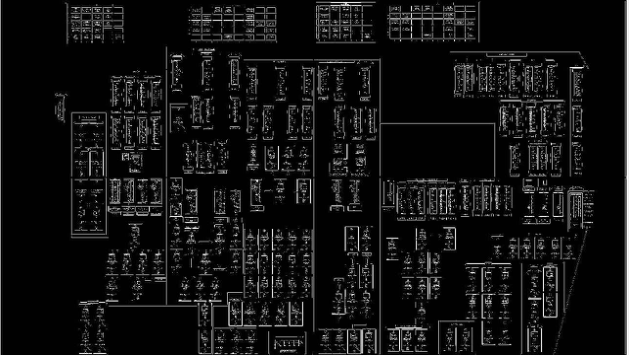
Physical Display Properties Characterization Procedures For all three metrics (symmetry, edge density and edge congestion) the physi- cal display properties characterization was conducted using the Matlab image processing toolbox. Edges in the panel images were detected using the Canny method, which uses linear filtering with a gaussian kernel to smooth noise and compute edge strength and direction for each pixel within an image. The output of the Canny method is a matrix where all detected edge pixels become ones and all other pixels become zeros (see Figure 2 for visual representation of Canny edge detection). The matrices obtained by using the Canny method on each display, were used to compute symmetry and edge density, but not edge congestion.
Symmetry was computed by creating another matrix, half the size of the original, in such a way that if a feature or edge (represented by a value of
Figure 2: A visual representation of the Canny edge detection method on the unmodi- fied A2 panel.
A Multidimensional Approach to Digital Control Room Display Research 73
one in the original matrix) corresponded symmetrically to another feature or edge (also represented by a one) across the axis of symmetry then a one was stored, otherwise a zero was stored. The value of symmetry was found by using the sum of the values in the new matrix divided by the total number of pixels in the new matrix. Both vertical and horizontal symmetries were found using this function. The mean of the vertical and horizontal symmetry was also calculated for each display.
For the edge density metric, total edge density was found by dividing the sum of the matrix (sum of feature or edge pixels) by the total num- ber of pixels in the matrix. The same was done for each quadrant of the image (i.e., sum of a quadrant of the matrix divided by total pixels in that quadrant).
The edge congestion metric was calculated using Subband Entropy, which assumes that clutter is an emergent feature, driven by the amount of informa- tion in the display (Rosenholtz, Li, & Nakano, 2007). Congestion measures of clutter capture the extent of organization inherent in the information; the more redundancy present in a visual scene the more “organized” it appears, giving a subjective impression of low clutter. The Subband Entropy measure is based on common image encoding standards (e.g., JPEG 2000) and is thou- ght to be analogous to how image decomposition occurs in early human vision (i.e., V1, Olshausen & Field, 1996). The Rosenholtz et al., Sub- band Entropy method was selected for this study because of its consistency with how information is processed by humans and the method was well documented.
RESULTS AND DISCUSSION
Subjective Complexity and Performance Assessments Overall participants in the unmodified panel condition and those in the modi- fied panel condition did not significantly differ on their subjective ratings of perceived display complexity Munmodified = 2.08 (SD = .45), Mmodified = 2.11 (SD = .53), t(14) = −.097, p > .05.
Performance Based Assessment The C1 panel was the same in both the modified and unmodified groups. The critical comparison between groups was between the unmodified and modified A2 panels. If the modified panel reduced complexity in a way that impacted performance, there should be a significant difference between the A2 panels but not the C1 panels. Consistent with this hypothesis, there was no difference between the C1 panels Munmodified = 5.39 sec (SD = 2.86 sec), Mmodified = 5.64 sec (SD = 3.12 sec), t(7) = .630, p > .05. The dif- ference between the unmodified and modified A2 panels was significant Munmodified = 11.58 sec (SD = 3.95 sec), Mmodified = 9.35 sec (SD = 2.65 sec), t(7) = −2.86 p = .024. These results suggest that the scaled comple- xity reduction, where the elements in the A2 panel were reduced to match the number of elements in the C1 panel was successful in supporting control identification for non-expert operators.
Physical Display Assessment Tables 2 and 3 provide the values for visual clutter and symmetry. There were no statistically significant differences between the unmodified or modified panels for either measurement.
The analysis of the edge congestion data yielded significant results consi- stent with the performance data. The comparison between the unmodified and modified A2 panels was significant t(3.607) 2.672, p = .031. Measu- red edge congestion was lower in each of the four quadrants of the modified A2 panel compared to the unmodified panel. The comparison between the unmodified A2 and C1 panels was not significant. Table 4 provides the edge congestion values for each quadrant and the quadrant-wise difference scores.
The three display measures used were selected because they are well esta- blished within the visual perceptual literature and are straightforward to implement. The visual clutter method (Table 2) selected was not sensitive to the differences between the modified and unmodified panels. This could be for several reasons, including the appropriateness of that specific technique for measuring clutter in the man-made, control room environments (com- pared to natural environments) or methodological constraints related to the number of panel images available for evaluation.
Table 2. Average clutter for each quadrant for modified and unmodified A2 and C1 panels.
Table available in the original PDF paper.
Panel Top Left Top Right Bottom Left Bottom Right C1 0.039 0.051 0.030 0.060 A2 Unmodified 0.053 0.051 0.058 0.060 A2 Modified 0.054 0.028 0.041 0.018 A2 Unmodified-Modified −0.001 0.024 0.016 0.043
Table 3. Average vertical and horizontal symmetry for modified and unmodified A2 and C1 panels.
Table 4. Edge congestion for each quadrant for modified and unmodified A2 and C1 panels.
Table available in the original PDF paper.
Panel Top Left Top Right Bottom Left Bottom Right C1 2.706 3.184 2.515 3.586 A2 Unmodified 3.726 3.530 3.875 4.084 A2 Modified 3.564 2.370 3.199 1.973 A2 Unmodified-Modified 0.162 1.160 0.676 2.111
A Multidimensional Approach to Digital Control Room Display Research 75
CONCLUSION
Using multiple sources of information about the display provided some interesting points of convergence and dissociation. Like Andre and Wickens (1995) and more recently Davis, Dickerson, and Gillmore (2019), there was not a connection between subjective experience and performance. When examining usability of cockpit displays that include novel sensory imagery, subjective ratings and performance-based measures diverged, Davis et al., found that pilots preferred the most informationally dense displays, but per- formed best with simpler displays. In the present study, participant ratings of display complexity did not differ between the unmodified and modified panels, however, response times for target identification was generally faster for the modified panel relative to the unmodified panel.
The results of the physical display measurements were mixed, visual clutter and symmetry did not differ between the two displays. This is an important finding because, as can be seen in Figure 1, the modified A2 panel appears less symmetrical, but this subjective experience of asymmetry was likely driven by the additional “white space” between control elements and not a real dif- ference in average symmetry. Edge congestion, which is an alternative metric for clutter and is closely associated with complexity in the literature, did reveal significant differences between the unmodified and modified A2 pan- els, confirming that the unmodified A2 was more cluttered than the modified panel. This was likely due to differences in local distributions of edges and non-edge content. Taken together, these results demonstrate that participants were easily able to locate each of the target controls, but it was more effort- ful in the unmodifed panel, which had more edge congestion compared to the modified panel. Importantly, edge density, symmetry, and edge conge- stion for unmodified and modified A2 and unmodified C1 were well within established usability standards; neither modified nor unmodified panels were “bad”, they were simply visually different, which may have been the driver behind slightly slower response times in the unmodified panel group. The difference in performance between the unmodified and modified panel was consistent with previous findings; slower response times for more complex displays (Hugo & Gertman, 2013).
In terms of a link between cognitive and perceptual complexity, the modi- fications implemented using the “different but equal” approach created a cognitive experience that produced roughly equivalent levels of workload demand between operators and non-operators, further substantiating the HPTF methodology. The perhaps unintended effect of that cognitive com- plexity change was an associated reduction in visual perceptual complexity, evident in both physical display parameters and performance.
The introduction of advanced reactors and ongoing modernization (i.e., digitization) of analog control rooms will create a need for substantial design work to translate analog user interfaces into digital displays. Further, as control rooms evolve to support increased automation and multi-unit ope- rations, display concepts will also need to evolve, and this evolution may be towards complexity. The results of this study provide initial evidence that designers and HFE assessors should consider the impact visual clutter can
have on operator performance. While caution regarding clutter is identified in NUREG-0700, current guidance for human factors assessments of control room interface designs do not include specific information about assessing displays for clutter or complexity. Future research into the techniques pilo- ted for the present paper should include assessment of additional panels and a larger pool of participants to establish the feasibility of these lightweight techniques for assessing display issues early in the design process.
ACKNOWLEDGEMENT
The positions described in this paper are those of the authors and do not necessarily represent the views of the U.S. Nuclear Regulatory Commission or the U.S. Government.
REFERENCES
Andre, A. D. and Wickens, C. D., 1995. When users want what’s not best for them. Ergonomics in design, 3(4), pp. 10–14. Davis, B. M., Dickerson, K. and Gillmore, S. C., 2019, July. User centered design stra-
tegies for improving visualization of sensor data in rotorcraft cockpit displays for degraded visual environment operations. In International Conference on Applied Human Factors and Ergonomics (pp. 131–141). Springer, Cham. Harris, J., Reinerman-Jones, L. and Teo, G., 2017. The impact of simulation display on nuclear power plant task error frequencies. In Advances in human factors in energy: oil, gas, nuclear and electric power industries (pp. 133–144). Springer, Cham. Horrey, W. J. and Wickens, C. D., 2004. Driving and side task performance:
The effects of display clutter, separation, and modality. Human factors, 46(4), pp. 611–624. Hughes, N., D’Agostino, A., Dickerson, K., Matthews, G., Reinerman-Jones, L., Barber, D., Mercado, J., & Lin, J., 2023. Human performance test facility (HPTF) volume 1 – systematic human performance data collection using nuclear power plant simulator: a methodology (RIL 2022-11). U. S. Nuclear Regulatory Commission. Hugo, J. and Gertman, D., 2013. A qualitative method to estimate HSI display
complexity. Nuclear Engineering and Technology, 45(2), pp. 141–150. Kim, S. H., Lee, J. H., Park, D., Lee, Y., and Yun, M. H., 2019, November. Effects of Visual Complexity Levels and Information Decluttering Methods for Cockpit Displays on Human Search Performance. In Proceedings of the Human Factors and Ergonomics Society Annual Meeting (Vol. 63, No. 1, pp. 96–100). Sage CA: Los Angeles, CA: SAGE Publications. Moacdieh, N. and Sarter, N., 2015. Display clutter: A review of definitions and
measurement techniques. Human factors, 57(1), pp. 61–100. Miniukovich, A. and De Angeli, A., 2014, May. Quantification of interface visual complexity. In Proceedings of the 2014 international working conference on advanced visual interfaces (pp. 153–160). NRC (2020). Human-System Interface Design Review Guidelines (NUREG-0700,
Rev.3). Washington, D. C.: U. S. Nuclear Regulatory Commission. Olshausen, B. A. and Field, D. J., 1996. Emergence of simple-cell receptive field properties by learning a sparse code for natural images. Nature, 381(6583), pp. 607–609.
A Multidimensional Approach to Digital Control Room Display Research 77
Rosenholtz, R., Li, Y. and Nakano, L., 2007. Feature Congestion and Subband Entropy measures of visual clutter. Te’eni, D., 1989. Determinants and consequences of perceived complexity in human-
computer interaction. Decision Sciences, 20(1), 166–181. U. S. Nuclear Regulatory Commission, 2008. Analysis of options and recommendations for new reactor simulator training of NRC inspectors (SECY-08-0195). U. S. Nuclear Regulatory Commission. U. S. Department of Health and Human Services, 2018. Protection of human subjects.
45 CFR § 46. Subparts AD. Xing, J., 2008. Designing questionnaires for controlling and managing information complexity in visual displays. FEDERAL AVIATION ADMINISTRATION OKLAHOMA CITY OK CIVIL AEROSPACE MEDICAL INST.
LISTED IN THE AHFE DIGITAL BOOKSTORE CATALOGUE
Explore the complete digital volume
Human Factors and Simulation
Read this individual research paper free through the original publisher, or explore the full digital proceedings book.
ISBN 978-1-958651-59-9
Explore this ISBN in the AHFE Bookstore ↗Listed in the July 2026 bookstore catalogue; search by ISBN to confirm current availability · Digital book purchase optional