Marian Wnuk (2022). Limiting the risk to the environment by measuring the characteristics of antennas in the near zone. In: Human Factors in Software and Systems Engineering. AHFE Open Access, vol. 61, pp. 110–121. https://doi.org/10.54941/ahfe1002531
Measurements in the near zone and the subsequent use of the analytical method and transforming the obtained results to determine the radiation characteristics, which can conveniently replace the conventional far-field range tests. It comes down to the use of closed rooms, such as anechoic chambers, which provide appropriate conditions to carry out measurements and inspections and favourable weather conditions. This is a very cost-effective and time-effective method. The determined characteristics are almost identical in terms of accuracy like those set in the far field. The downside is that some measurements require complex software and their duration is much longer than the real one.The measurement with the probe covers the phase and amplitude of the signal after a predefined scanning area, which is different for each antenna and therefore also the methods, since the method is selected according to the antenna under test. The rectangular planar method was used in the work.After constructing a measuring station and taking measurements, they are transformed by using the Fourier transformation. In the study of a parabolic antenna, these were not complicated operations because planar methods are characterized by simplicity of calculations, in contrast to more difficult cylindrical methods and much more complicated spherical methods.The measurement consists in collecting data on amplitude and phase through a second antenna, which acts as a measuring probe, at specified distance intervals in the azimuthal and elevation directions. Therefore, the used fin antenna is moving on the antenna mast in two planes. The obtained results must be entered into a computer program in order to plot the characteristics.All the considerations, along with the concept of the measurement stand, were based on theoretical foundations, based on knowledge of the types of antennas and their parameters, knowledge of the near zone and its properties, and the behaviour of the signal during measurements.
One of the important elements of radio communication systems is the antenna. Its task is to convert the input current into an electromagnetic field and radiate it into the surrounding space (transmitting antenna) or vice versa (receiving antenna). The antenna is therefore a device that adjusts the wave guide to the free space. Its parameters and characteristics depend not only on the effective transmission of information, but also on meeting the com- patibility conditions, i.e. not interfering with the operation of other systems,
Limiting the Risk to the Environment by Measuring the Characteristics of Antennas 111
especially in the directions of radiation of the side lobes. Therefore, the tech- nique of antenna measurements has been developing very intensively recently. It must ensure that measurements are made with a high degree of accuracy, and these measurements must be made at ever lower signal levels. To meet these requirements, these measurements should be performed under special conditions that are met in anechoic chambers. The characteristics of anten- nas can be determined in many ways. The most important are direct and indirect methods. The direct method is the simplest and the earliest used to determine the characteristics of antennas. Determining the characteristics with this method consists in irradiating the antenna with a quasi-plane wave from different directions and registering the level of received signals. With a good approximation, it can be assumed that the electromagnetic energy reaching the antenna from a long distance has the character of a plane wave. This allows for unambiguous determination of the antenna radiation pattern, because the plane wave has a strictly defined direction of propagation. Pro- viding a deformation of the wave surface in the required area of less than π/8 is sufficient to make this wave flat. Direct methods allow to obtain the characteristics of the tested antenna in real time, while indirect meth- ods require additional time to perform mathematical calculations and obtain a characteristic graph.
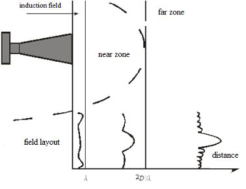
ANTENNA RADIATION ZONES In the area surrounding the antenna, there are typically three zones of the electromagnetic field generated by this antenna: the reactive near-field, the radiating near-field, and the far-field (far-field). The far zone extends to infi- nity and it is the region of space in which the electromagnetic field changes with the distance r from the transmitting antenna according to the relation- ship exp (-jkr)/r, where k = 2π/λ, λ - wavelength. The far zone is assumed to extend from the distance from the antenna under consideration to infinity, where D denotes the greatest geometrical dimension of the antenna under consideration. The factor λ added to the relationship 2D2/λ covers the case where the maximum geometrical dimension of the antenna is smaller than the wavelength λ.
!
Equations and mathematical formulas are available in the original paper PDF.
The area of space extending from the antenna to the imaginary boun- dary of the far zone is called the near zone, while up to the distance λ from the tested antenna we are dealing with the induction field. In the induction field, the phases of the electric and magnetic fields are almost quadrature, the Poynting vector is complex.
The imaginary part of the Poynting vector is responsible for the accumu- lation of the electromagnetic field energy at the antenna’s surface, and the real part is related to the energy radiated by the antenna. At a distance grea- ter than λ from the antenna, the electromagnetic field has a complex nature and changes strongly as a function of the distance from the antenna, it is
112 Wnuk
Figure 1: Zones around the antenna.
the so-called near radiating zone. In the near zone, antenna measurements are usually performed in the near radiating zone. Sometimes terms that are borrowed from optics, such as the Fresnel zone and the Fraunhofer zone, are used to describe the areas of the electromagnetic field in the vicinity of an antenna. The Fraunhofer zone is a term identical to the far zone, while the Fresnel zone extends from the distance.
1
3 D 2 to the conventional border of the far zone.
It should be emphasized that until now there are differences among experts in the subject as regards the naming of individual areas of the electromagnetic field around antennas and the range of individual zones. It is presented in fig. No. 1.
The electric and magnetic field near and away from the antenna has the following characteristics:
In the near zone, the electric and magnetic field vectors are shifted in phase by 90 °. Physically, this means that energy over one half cycle comes out of the antenna, and within the next half cycle, it returns to it.
In the far zone, the vectors: electric field and magnetic field are in phase. This means that the energy flows along the directions coming from the antenna to infinity.
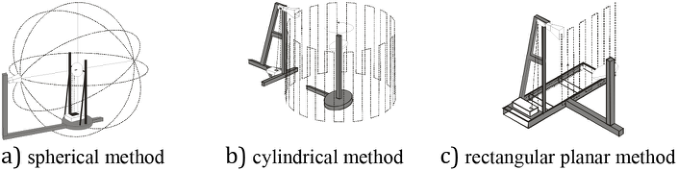
Traditional methods require measurements to be made in the far zone, This condition is difficult to meet for antennas operating in the microwave range. The radius of this zone, for example, for an antenna size L = 3m and opera- ting frequency f = 9 GHz, extends over 540 m. It should be emphasized that the size of the largest anechoic chambers does not exceed 50 m. Therefore, a need has arisen to develop methods that allow the size of the measurement structure to be reduced to a suitable size for closed spaces such as an anech- oic chamber. The solution to this problem is to make measurements in the near zone, i.e. at a distance (4 ÷ 10) λ. There are many variants of the near- field measurement method. Three of them are commonly used. These are: the spherical method (Fig. 2.a), the cylindrical method (Fig. 2.b) and the planar method (Fig. 2.c).
Table (1) shows the main features of the currently used measurement methods. Each of these methods has its own advantages and disadvantages.
Limiting the Risk to the Environment by Measuring the Characteristics of Antennas 113
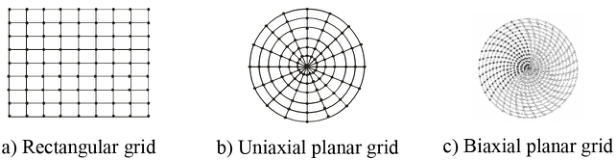
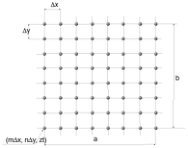
Figure 2: View of the antenna measurement station in the near zone.Figure 3: Measurement grid.
Spherical scanning requires larger anechoic chambers compared to other methods. Cylindrical scanning is ideal for area control radar measurements. The planar scan is limited by the angular sector allowing the measurement of the main beam and the nearest side lobes. The main advantage of in-plane scanning is the dense and even arrangement of the measurement points on the grid. In the case of scanning on the polar (uniaxial) and bipolar (biaxial) planes, it is possible to obtain a scanning plane larger than that allowed by the anechoic chamber.
In the methods of measuring antennas in the near zone, the values of the electromagnetic field are measured at discrete points on a given surface. The measurement points are located at the nodes of a properly defined mesh inscribed in this surface. There are three types of grid of measurement points, which are shown in Fig. 3.
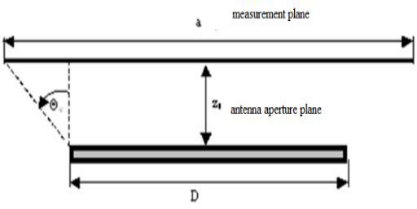
The near field radiating area ranges from the distance equal to the wave- length λ from the antenna to the distance defined by the formula (1). Beyond this distance, there is already a distant area where the angular energy distri- bution does not fluctuate with the distance and the radiation power decays with the distance. The dimension of the measurement area is important as the accuracy of the planar near-field measurement technique is considered. The size and location of the measurement area defines the angular sector size of the validity area. The size of this angular sector depends, inter alia, on on the size of the scanning area of the electromagnetic field, as well as the distance of this surface from the finish of the tested antenna.
The calculated far-field radiation pattern will be accurate in the ± 2S range. Complete angular coverage can be achieved in a spherical system by taking measurements in the near zone over the entire spheri- cal near-field surface. Regardless of the measurement method chosen, the
114 Wnuk
Figure 4: Explanation of the size of the angular sector of the validity area of the measured characteristic.
instrumentation that ensures the performance of specific measurements is similar.
It should be emphasized that when carrying out measurements in the near zone, the obtained measurement results should be transformed, using analytical methods, into data for calculating the radiation characteristics in the far field. The calculated radiation patterns are as accurate as far-field range measurements. Depending on the required accuracy, it is necessary to use more complex and expensive regulatory procedures and more com- plicated software and the radiation characteristics are not obtained in real time
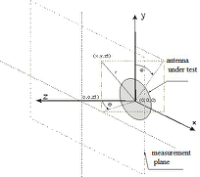
THEORETICAL BASIS OF DETERMINING ANTENNA CHARACTERISTICS BASED ON NEXT FIELD MEASUREMENTS Contemporary planar scanning techniques for antenna near-field measure- ments are based on the plane-wave spectrum representation. Electromagnetic waves of a given frequency can be represented as a superposition of ele- mentary plane waves of the same frequency. For further considerations, a rectangular x, y, z, coordinate system was adopted (Fig. 5).
In the source less and lossless area of free space, Maxwell’s equations describing the phenomenon of propagation of electromagnetic waves, can be transformed to the form of homogeneous Helmholtz equations of the second order, ∇2 #»E + k2 #»E = 0 (4)
Assuming that the observations of the components of the electric and magnetic field vector of a sinusoidal wave in time were made at the same time t = tp in all considered points in space, the terms dependent on the independent variable t representing time were omitted in the above equati- ons. Due to the linearity of the above-mentioned operators and the linearity of the medium in which the described phenomenon of electromagnetic wave propagation occurs, it is not difficult to prove that the equations presented
Limiting the Risk to the Environment by Measuring the Characteristics of Antennas 115
Figure 5: Location of the antenna in the reference frame used in the analysis.
#»A
exp
−j#»k #»r
#»E
x, y, z
kx, ky
dkxdky, (7)
#»k × #»A
exp
−j#»k #»r
#» H
x, y, z
kx, ky
dkxdky, (8)
#»k · #»A
kx, ky
#»i x + ky
#»i y + kz
#»i z - wave vector, indicates the direction of wave propagation described by the wave equations (4, 5, 6), k2 = #»k · #»k - wave number (is the length of the wave vector),
kx, ky
kx, ky
#»ix + Ay
kx, ky
#»iy + Az
kx, ky
#»iz - a wave vector describing the spectrum of plane waves. Felt expression #»A
exp
−j#»k #»r
occurring in the relations (7,9) represents a homoge-
kx, ky neous plane wave propagating in the direction determined by the vector , and therefore the monochromatic wave radiated by the aperture can be written as a superposition of plane waves of the same frequency, different amplitudes and propagating in different directions.
On the other hand, equation (12), which is a natural consequence of Gauss’s law for the source less area written by equation (9), allows to iso- late two independent components (here
kx, ky
kx, ky
and Ay
) vector #»A
kx, ky
kx + Ay
kx, ky
ky
kx, ky
kx, ky kz
In order to determine the value of the electric field for the aperture loca- ted in the far field, using the expression (10), the following relationship was obtained,
116 Wnuk
Equations and mathematical formulas are available in the original paper PDF.
#»A
kx, ky
[Equation or mathematical symbol available in the original paper PDF]
[Equation or mathematical symbol available in the original paper PDF], (11)
Equations and mathematical formulas are available in the original paper PDF.
where: kx = k sin θ cos ϕ, ky = k sin θ sin ϕ, kz = k cos θ, Az kx, ky is expressed by (10). The necessity to determine the components Eθ = (r, θ, ϕ) and Eϕ = (r, θ, ϕ) far field defined in spherical coordinates implies the execution of transformations which give the relation (11) in the appropriate form:
Equations and mathematical formulas are available in the original paper PDF.
sin ϕ
iθ
kx, ky
cos ϕ + Ay
kx, ky
r + cos θ(Ay cos ϕ −Ax sin ϕ)iϕ)
= Eθ(kx, ky)iθ + Eϕ(kx, ky)iϕ (12) In the next step, depending on the method of polarization of the tested aperture, we determine the self, (co-polar) Eco (θ, ϕ) and cross polarization characteristics Ecross (θ, ϕ).
+ Ay(kx, ky)(cos2 ϕ + cos θ cos2 ϕ) (14)
To determine the characteristics of the far-field, it is necessary to know the components Ax
kx, ky
and Ay
kx, ky
the vector of the plane wave spe- ctrum #»A
kx, ky
. In the case of observing the electric field vector on the plane z = zt, the vector equation (10) takes the following form:
exp exp
exp
kx, ky
−jkzzt
−jkzx
−jkzy
dkxdky,
Ex
exp exp
exp
Ey
Ay
kx, ky
−jkzzt
−jkzx
−jkzy
dkxdky,
exp exp
exp
Ez
kx, ky
−jkzzt
−jkzx
−jkzy
dkxdky,
Limiting the Risk to the Environment by Measuring the Characteristics of Antennas 117
where: q
k2 −k2x −k2y dla k2
x + k2
Equations and mathematical formulas are available in the original paper PDF.
dla k2
−j
k2x + k2y −k2
x + k2
y > k2.
[Equation or mathematical symbol available in the original paper PDF] These dependencies are classic two-dimensional Fourier integrals, so after applying inverse transformations, after further transformations we get:
exp exp
dxdy,
Ex
x, y, zt
jkxx
jkyy
kx, ky
jkzzt
exp exp
dxdy,
Ay
kx, ky
jkzzt
Ey
x, y, zt
jkxx
jkyy
Equations and mathematical formulas are available in the original paper PDF.
kx, ky
kx, ky
kx + Ay
kx, ky
ky
kz The choice of sample spacing allows for Fourier integrals to obtain equ- ations whose structure is in fact a modified version of the two-dimensional discrete Fourier transform or the inverse. Due to the large number of mea- surement points obtained during the scanning of the measurement plane, the selection of effective numerical algorithms for data processing becomes of great importance. A good example is the Fast Fourier Transform (FFT) and the Inverse Transform (IFFT) algorithms, which can be used to derive transforms based on row-column decomposition.
For a finite number of observation points (2N measurement points) and a rectilinear domain (s ∈(−1s, 1s))one can write:
sin w (s −n1s)
The task of the approximating function ψ (s) is to ensure a quick converge- nce of the approximation error as the value of the oversampling rate increases χ = π/w
1s π/w is the maximum allowable spacing - Nyquist spacing - resul- ting from the sampling theorem) and the minimization of the so-called the cut-off error resulting from the finite size of the measuring grid. For the case of the approximating function, ψ (s)the following expressions can be proposed: ψ (s) = 1 - development over classical sampling functions,
sinh[πνN] ximate Prolate Spheroidal) function
, χ - degree of oversampling.
1 −1 χ
118 Wnuk
Figure 6: Measurement grid.
From the point of view of applications, an important issue is to compare the speed of convergence to zero of the approximation error for BLI interpola- tion and for the method using both classical sampling functions and APS-type functions On the other hand, in the case of the approximation of the domain of an angular variable ϕ (ϕ ∈(−1ϕ, 1ϕ)), the following rule should be applied:
M X
DMn (ϕ −m1ϕ) Mr (ϕ −m1ϕ) #»F (m1ϕ) , (23)
where:
(2Mn + 1) ϕ
2
(2Mn + 1) sin (ϕ/2) - Dirichlet function, Mr (ϕ, 0) acts as a function that reduces the value of the cut-off error. Due to the fact that planar scanning was used in the work, error analysis for this case is not performed.
RULES FOR SAMPLING A FIELD IN THE NEAR ZONE The planar method with a rectangular grid of measurement points was used to test the antenna in the work. This choice was dictated by its main advan- tages, such as: low cost of the scanning mechanism, the smallest amount of calculations and the lack of movement of the tested antenna. The acquisition of data in a planar near field is carried out over a rectangular x-y grid, Fig. 6 with the maximum sample spacing in the near field.
1x = 1y = λ 2 (24) The measurement procedure requires that the area of the zt plane at a dista- nce from the test antenna be selected where the measurements are taken. The distance zt should be located at a distance of at least two or three wavelengths from the test antenna to the near-field exposure limit. The plane in which the measurements are made is divided into a rectangular grid with M x N points at a distance of 1x and 1y apart and defined by the coordinates (m1x n1y, zt), where:
−M
Limiting the Risk to the Environment by Measuring the Characteristics of Antennas 119
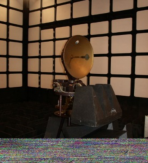
Figure 7: View of the tested antenna, set to measure the field in the near zone.
The M and N values are determined by the linear dimensions of the sample plane divided by the sample spacing. Measurements are performed until the signal at the edges of the plane reaches a level of -40dB below the highest signal level within the measured plane. Defining a and b as the width and height for the measured plane, M and N are determined by the expressions: M = a 1x + 1 and N = b 1y + 1 (26)
The sampling distances selected on the grid should be less than half the wavelength and meet the Nyquist sampling criterion. If the z = zt plane is located in the far field of the source, the sampling intervals can increase to its maximum value of λ/2. Rectangular grid points are separated by grid spacing as: (27)
where: kxo and kyo are real numbers and represent the largest sizes respe- ctively kx and ky so as to f(kx, ky) ∼= 0 for kx
> kxo or
ky
> kyo.
EXPERIMENT VERIFICATION Determining the antenna radiation pattern on the basis of measurement data made in the near field requires the use of an advanced mathematical tool. Two computer programs have been developed. The first of them determines the theoretical distributions of the electric field on the surface of the antenna aperture, as well as the electric field and phase distributions in a plane parallel to the aperture plane at a distance zt from it. The second program determines the cross-section of the radiation pattern of the parabolic antenna under study on the basis of the measurement or theoretical data determined by the first program. To verify the correctness of the developed concept of the measuring station, the measurements of the antenna were carried out (Fig. 7) with a symmetrical parabolic reflector with a diameter of D = 0.6 m. As a radiating element, a half-wave dipole was used, which in combination with a circular- shaped counter-reflector.
In this case, the far zone will be at a distance of 7.2 m. The dimensions of the anechoic chamber allow for measurement at a maximum distance of 5 m.
The figures below show the measurements of the amplitude and phase characteristics of the electromagnetic field of the tested antenna, measured in the near zone, they were made in the anechoic chamber. The measurement
120 Wnuk
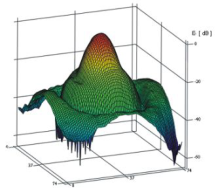
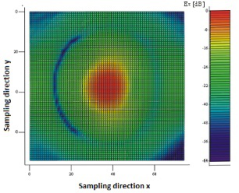
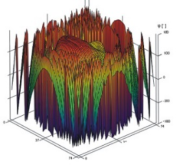
Figure 8: The normalized spatial amplitude characteristic of the tested antenna in the near field.Figure 9: Normalized amplitude of the electric field intensity.Figure 10: Spatial phase characteristic of the tested antenna in the near field.
results have been standardized. The signal level equal to 0dB was taken as a reference. The phase difference was calculated by the frequency converter on the basis of the ratio of the signal received from the antenna to the reference signal. Figures (8) and (9) show the measured distributions of the electric field amplitude in the scanning plane for the component Ex.
On the other hand, in Figure (10), the measured distribution of the electric field phase in the scanning plane is shown.
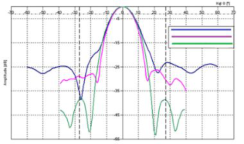
Using the directional program, the following characteristics were determi- ned: theoretical (based on the data obtained with the near_field program) and the characteristics obtained from calculations (based on the formula (11). Both characteristics are shown in one figure, fig. 11. Additionally, the same figure shows the radiation characteristics obtained from the measure- ments. such a chart can be used to compare and verify the experiment. The characteristics are marked with numbers and colors, respectively:
Blue - cross-section of the antenna radiation pattern determined by measurements at the station fig. 11 (near field) - No. 1;
Red - antenna radiation pattern cross-section calculated using the directi- onal program based on the data received from the antenna’s near field - no. 2;
Limiting the Risk to the Environment by Measuring the Characteristics of Antennas 121
Figure 11: Radiation characteristics of the tested antenna.
Green - theoretical cross-section of the antenna radiation pattern obtained with the use of near_field and directional programs - no. 3.
Comparing the characteristics from Figure (11), the narrowing of the cha- racteristics 2 and 3 in relation to the 1 is noticeable. The reason is not only the phase disturbances, but also the failure to maintain the far zone condition when measuring characteristics no. 1. The difference between the border of the far zone and the distance at which the measurements were made, amoun- ting to 2.85 m, is so significant that it has a direct impact on the shape of the characteristic.
CONCLUSION
In the previous analysis, it was assumed that the components tangent to the measurement plane of the electric field vector are measured exactly at the point. In fact, such a probe does not exist, and the antenna used for the mea- surements has certain geometrical dimensions. This averages the amplitude and phase values on its surface. The influence of the probe radiation pattern is also significant. Another factor distorting the characteristics was the impre- cise, non-automatic scanning system. The accuracy of positioning the probe in the vertical plane leaves much to be desired as well as the length of the measurement time. The obtained measurement results confirmed the corre- ctness of the adopted design assumptions and the correctness of the developed algorithms. The radiation characteristics transformed into the far field are consistent with the theoretical characteristics and the results of comparative measurements.
REFERENCES Długosz T., Trzaska H. (2010). How to Measure in the Near Field and in the Far Field; Communication and Network,), 2, 65–68 Kabacik P. (2004). Reliable evaluation and property determination of modern- day
advanced antennas; Oficyna Wydawnicza Politechniki Wrocławskiej, Wrocław. Modelski J., Jajszczyk E., Chaci´nski H., Majchrzak P. (2004). Pomiary parametrów anten Oficyna Wydawnicza Politechniki Warszawskiej, Warszawa Rahmat-Samii Y., Williams L. I., and Yaccarino R.G.: “The ULCA bi-polar pla-
nar near-field antenna –measurement and diagnostic range”, IEEE. Antennas and Propagat., Magazine., vol. 37, pp. 16–34, December, 1995. Salkic H., Softic A., Muharemovic A., Turkovic I. and Klaric M.. (2012) Calculation and Measurement of Electromagnetic Fields in Electromagnetic Radiation; InTech Europe. Wnuk, M.. Analiza struktur promieniuja˛cych poło˙zonych na wielowarstwowym
dielektryku, Wojskowa Akademia Tec.
LISTED IN THE AHFE DIGITAL BOOKSTORE CATALOGUE
Explore the complete digital volume
Human Factors in Software and Systems Engineering
Read this individual research paper free through the original publisher, or explore the full digital proceedings book.
ISBN 978-1-958651-37-7
Explore this ISBN in the AHFE Bookstore ↗Listed in the July 2026 bookstore catalogue; search by ISBN to confirm current availability · Digital book purchase optional