Faith Dowelani, Obinna Ozumba (2022). Determinants of BIM Adoption in Facilities Management in South Africa: An Application of the UTAUT Model. In: Human Factors in Software and Systems Engineering. AHFE Open Access, vol. 61, pp. 88–96. https://doi.org/10.54941/ahfe1002528
Based on the diversity of the informational needs of an organisation, various information technology systems are introduced and used to support a wide range of Facilities Management (FM) information. The adoption of BIM in FM offers an opportunity for facilities managers to add value to the facilities planning, maintenance, occupation and operations management. Effective adoption of BIM in FM would require better knowledge of relevant and influential factors, which hitherto have not been explored adequately in emerging economy contexts such as South Africa. Therefore, this study aimed to identify and evaluate the determinants for adopting BIM for FM practice, using South Africa as context and the UTAUT model as a theoretical framework for examining determinants of BIM adoption in FM. Relevant literature review was complemented, and a survey strategy was used for data collection through the development of a questionnaire instrument. The results demonstrate a strong relationship between Performance Expectancy and Behavioural Intention, indicating the influence of organisations and senior management on BIM adoption in FM and that Attitude has a significant effect on Use Behaviour. The findings align with the UTAUT model and add to the body of practical reference BIM adoption in FM.
FM has grown into a discipline and profession within the property and construction industry, exemplified by the establishment of professional FM institutions globally. They include bodies such as IFMA in the USA, JFMA in Japan, BIFM in the UK, FMA in Australia, and SAFMA in South Africa (Tay and Ooi, 2001). FM is a component of the building life-cycle that con- tributes the most to the total cost of a project, compared to the cost of design and construction (Gallaher et al., 2004). According to Jordani (2010), the cost of FM activities accounts for 85% of the life cycle cost of a building. Hence, information management tools used during FM should reduce costs and improve efficiency.
The introduction of computers in the 20th century advanced facility infor- mation management systems (Graddy, 2010). Computers have since evolved from large mainframe types, to more miniature personal computers. An
Determinants of BIM Adoption in Facilities Management in South Africa 89
increase in demand for information management due to computerisation within the Architecture, Engineering and Construction (AEC) sector has impacted FM (Pärn, Edwards and Sing, 2017). The drivers include pro- blems such as collecting, retrieving and sharing of data that is not integrated (Cardellino and Finch, 2006). The diversity of informational needs for FM demands a well-structured computer-aided maintenance programme, for adequate facilities maintenance without compromising safety (Shohet, Lavy- Leibovich and Bar-on, 2004). The need for a ‘golden thread’ of information between all stages of a facility’s life cycle, requires information technology systems to collect and make information available in an integrated way, across a facility’s life cycle stages (Motamedi, 2013). The shared digital representation of built environment data, known as Building Information Modeling (BIM), holds information for different stakeholders at different phases of a facility life cycle (Liu, 2012). BIM in FM can be used for inter- pretation and analysis, enabling more efficient building management while adding value to stakeholders (Carbonari et al., 2018). BIM is described as a tool for improving cost efficiency, and generating and managing FM- related information (Parn et al., 2016). It also facilitates the integration of information throughout the life cycle of a building (Mohanta and Das, 2016).
However, there is still a very low adoption of BIM by FM practitioners, occasioning limited experience, inadequate knowledge, and difficulties with using BIM software (Teicholz, 2013). Even so, the adoption of any new tech- nology is influenced by determinants, and BIM is no exception Succar et al., (2012). Though BIM has gained momentum in AEC, its utilisation is compli- cated with several challenges (Sabol, 2013), as substantiated by Eastman et al. (2011), Kekana et al. (2014) and Azhar (2011). Even so, the specific deter- minants of BIM in FM and the relative strengths have not been thoroughly investigated.
The challenges of BIM adoption can be broadly classified into two cate- gories: business process challenges, and technological challenges. Various models of innovation and adoption are used to understand adoption of new technology. Many models examine individual choices of acceptance or reje- ction of innovations. According to Straud (2009), some models focus on the adoption environment, and others focus on type of innovation. In FM studies, the specific determinants of BIM adoption and their relative strengths have not been thoroughly examined. Over other models, the UTAUT model pre- sents relevant features for such examination and it has been successfully used in technology adoption studies. See Howard et al. (2015). It also explains over 70% of all the technology acceptance behaviour, beyond other models (Waehama et al., 2014). Therefore, the research design for the current study was set with the UTAUT model as a lens.
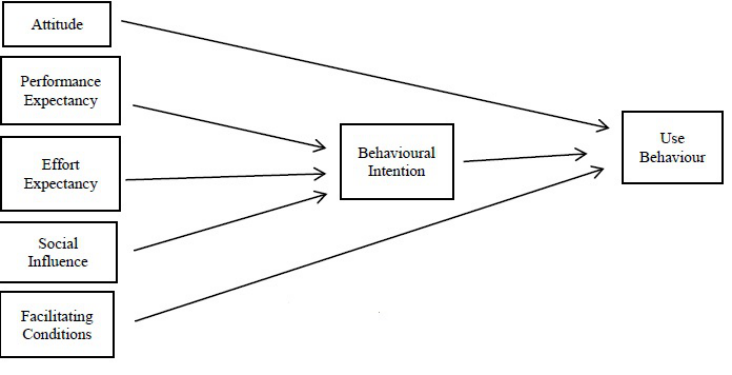
THE UTAUT MODEL FOR BIM ADOPTION The UTAUT model employed in the study consists of four core determinants of usage intention – Performance Expectancy (PE), Effort Expectancy (EE), Social Influence (SI) and Facilitating Conditions (FC). Behavioural Intention (BI) is a mediating variable for PE, EE and SI, and a predictor of technology
90 Dowelani and Ozumba
Figure 1: UTAUT model (Adopted from Howard et al., 2015).
Use Behaviour (UB) (Waehama et al., 2014). The Attitude (ATT) variable was included by Howard et al. (2015). Depending on the gravity of the determi- nants, the value of BI mediates in regard to the outcomes in UB. The UTAUT model applied in the study is presented in Figure 1.
RESEARCH DESIGN FOR THE STUDY Fieldwork was based on data collection by survey strategy through the use of questionnaires which were self-administered and returned. The South Afri- can Facilities Management Association (SAFMA), made up of 360 members was used as sample population, with Gauteng Province of South Africa as geographical scope. A sample size of 30 was used, following Saunders et al. (2012). The UTAUT model was applied by measuring each variable in the questionnaire through questions, addressing aspects of BIM adoption and utilisation in FM. The model explained user intention to use BIM and usage behaviour, measuring dependent, independent and mediator variables. The question design used the 7-point Likert scale as follows: 1 – Strongly agree; 2 – Agree; 3 – Somewhat agree; 4 – Neither agree nor disagree; 5 – Somewhat disagree; 6 – Disagree; 7 – Strongly disagree.
Validity-and-Reliability A Cronbach alpha analysis was used to validate the questionnaire. Reliabi- lity was analysed with the use of factors loading and Cronbach’s Alpha. In Table 1, all factor loadings exceed 0.5, while Cronbach’s Alpha values for PE, EE, SI, FC and ATT are higher than 0.7, indicating a high level of relia- bility. The values of BI and UB are below 0.7 but above 0.5. The low alpha is most probably due to a lower number of questions (Tavokol and Dennick, 2011). Considering the results in light of George and Mallery (2003), the questionnaire was deemed a reliable tool.
Determinants of BIM Adoption in Facilities Management in South Africa 91
Descriptive Statistics Descriptive statistics was performed by generating the mean and standard deviation (SD), from responses. Variables were expanded into relevant indi- cators for FM Practitioners perceptions of performance Expectancy, Effort Expectancy, Social Influence, Facilitating Conditions. The mean shows ave- rage perception through the the Likert scale responses, while the SD shows the concentration or spread of response values, to the mean, in other to validate the average. See Table 2.
Correlation Analysis Correlation analysis was subsequently used to analyse the UTAUT data fur- ther. Correlation analysis was used to work out the extent and nature of the relationship between the different variables as follows: Relationship between
92 Dowelani and Ozumba
Table 2. Descriptive statistic of UTAUT indicators.
Table available in the original PDF paper.
Variables Indicators N Mean Std. Deviation Performance Expectancy
34 4.81 2.095
PE1 I find BIM useful 36 3.61 2.06 PE2 Working with BIM increases productivity 36 3.61 2.088 PE3 Using BIM increases my performance 36 4.94 1.788 PE4 BIM enables me to accomplish tasks more quickly Effort Expectancy
36 4.47 1.859
EE1 Learning to operate BIM is easy for me 36 4.5 2.091 EE2 My interaction with BIM is clear and understandable
36 3.64 2.031
EE3 It is easy for me to become skilful at using BIM
36 3.64 2.031
EE4 I find it easy to use BIM 36 2.72 1.446 Social Influence SI1 People who influence my behaviour think I should use BIM
36 3.64 2.058
SI2 People who are important think I should use BIM
36 4.94 1.788
SI3 Senior management has been helpful in the use of BIM
34 5.36 1.659
SI4 The organisation has supported the use of BIM Facilitating Conditions
36 4.44 1.889
FC1 I have the resources necessary to use BIM 36 4.44 2.157 FC2 I have the knowledge necessary to use BIM
36 4.03 1.158
FC3 BIM is not compatible with other computer systems I use
36 3.78 1.245
FC4 There is assistance available with BIM difficulties FC5 Using BIM fits into my work style 36 3.58 1.251 Attitude ATT1 Using BIM is a good idea 36 2.69 1.47 ATT2 I like working with BIM 36 3.39 1.293 ATT3 Working with BIM makes work
36 3.25 1.18
interesting
Behavioural Intention
36 4.36 1.641
BI1 I intend to use BIM whenever possible 36 2.92 1.228 BI2 I have plans to use BIM in the near future 36 2.92 1.317 BI3 I predict I will use BIM 35 2.67 1.454 Use Behaviour UB1 I use BIM for different facilities management tasks UB2 I perceive using BIM as voluntary 36 3.47 1.647
attitude and use behaviour, relationship between performance expectancy and behavioural intention, relationship between effort expectancy and beh- avioural intention, relationship between social influences and behavioural intention, and relationship between facilitating conditions and use behavi- our. The Correlation matrix shows the P-values and correlations coefficients. The P-value was set at p ≤0.05., the p-value is significant at 0.01. As shown in Table 3
Determinants of BIM Adoption in Facilities Management in South Africa 93
Table 3. Correlation matrixes.
Table available in the original PDF paper.
Correlations
PE EE SI FC ATT BI UB 1 .917** .929** .846** .862** .763** .494**
PE Pearson Correlation
.917** 1 .947** .921** .955** .852** .496**
Sig. 2-tailed 0.000 0.000 0.000 0.000 0.000 0.002 EE Pearson Correlation .929** .947** 1 .856** .888** .807** .506** Sig. 2-tailed 0.000 0.000 0.000 0.000 0.000 0.002 SI Pearson Correlation
.846** .921** .856** 1 .946** .932** .729**
Sig. 2-tailed 0.000 0.000 0.000 0.000 0.000 0.002 FC Pearson Correlation Sig. 2-tailed 0.000 0.000 0.000 0.000 0.000 0.000 ATT Pearson .862** .955** .888** .946** 1 .876** .650**
Correlation .763** .852** .807** .932** .876** 1 .721** Sig. 2-tailed 0.000 0.000 0.000 0.000 0.000 0.000 BI Pearson Correlation
Sig. 2-tailed 0.000 0.000 0.000 0.000 0.000 0.000 **Correlation is significant at the 0.01 level 2-tailed.
FINDINGS AND DISCUSSION From Table 2, the mean values of PE 1-4 are between 3 and 4, indicating that the respondents are neutral in their perception that BIM enables them to accomplish tasks faster and that working with BIM increases productivity. Although the respondents agree that BIM is easy to use (EE4), the descriptive analysis of EE 1-3 shows that the respondents are neutral in their interaction with BIM. The mean values of FC 1-5 are also between 3 and 4, which means that most of the respondents’ answers fall within the range of somewhat agree and neither agree non-disagree. In addition, SI 1-4 is between 3 and 5, and it shows that people disagree or may not be influenced by people important to them to use BIM. ATT 1-3 is between the values of 2 and 3, meaning that the most common answers were agreed and somewhat agreed. These results indicate that the respondents have a positive attitude towards using BIM. The results for BI. 1-3 indicate that the respondents intend or have plans to use BIM. UB 1-2 values are between 3 and 4, respondents neither agree nor disagree.
Furthermore, a correlation analysis was conducted to examine the data from the UTAUT survey in Table 3. The results show a significant correlation between PE — BI of 0.763, EE – BI of 0.852, SF-BI of 0.807, BI. — UB of 0.721, FC - UB of 0.729 and ATT — UB of 0.650. Moreover, the results show that the correlation coefficient is above 0.50, meaning that the relationship between all variables is positive. The UTAUT model demonstrates that the independent variables PE, EE, SI, FC and ATT directly influence UB and BI;
94 Dowelani and Ozumba
and, further, that BI impacts UB. The model was used to determine if PE, EE and SI can strengthen the intent to use BIM in FM. Based on the validity and reliability analysis PE, EE and SI are determinants of BI to use BIM in FM. A p-value of less than 0.05 was set to achieve significance. Table 3 shows that the p-value of PE, EE and SI to BI is 0.00, indicating that PE, EE and SI are significant to BI. The Correlation Coefficient for PE, EE and SI to BI are above 0.7. According to Pallant (2011), a value between 0.5 and 1 is considered significant, indicating a high and positive correlation between the variables. Therefore, there is a positive relationship between PE, EE, SI and BI. The results further suggest that BI has a significant effect on UB. These results correspond to the finding of Venkatesh et al. (2003). Thus, it can be deduced that PE, EE and SI influence the prediction of future use of BIM in FM in South Africa. The original model by Venkatesh et al. (2003) predicts that BI affects the UB of individuals, as is the case with the current study. BI has a correlation coefficient of 0.721. The results also show that ATT and FC significantly affect UB, with a p-value of less than 0.05. The correlation coefficient is also high. Hence, ATT and FC positively influence UB. These results align with Attuquayefio and Addo (2014) and Howard et al. (2015), who agree that ATT significantly affects UB.
CONCLUSION
In the current study, a conceptual framework for technology acceptance, UTAUT, has been used to build a holistic understanding of how individu- als adopt technology in an emerging economy context. Using the UTAUT model, findings here demonstrate that Performance Expectancy (PE), Effort Expectancy (EE) and Social Factors (SI) have substantial effects on Beha- vioural Intention (BI). There is a strong relationship between Performance Expectancy (PE) and Behavioural Intention (BI). This suggests that practi- tioners regard BIM as a tool that can increase productivity, increase work performance, and enable individuals to complete tasks faster. This perce- ption is viewed as a positive factor towards BIM adoption in FM in South Africa. Secondly, the p-value of Social Influence (SI) towards Behavioural Intention (BI) was significant, meaning that organisations and senior mana- gement can influence the adoption of BIM in FM. With the support of senior management, the use of BIM in FM practice will gain more traction, thereby encouraging more adoption at the design and construction stages. Thirdly, the results confirm that Attitude (ATT) has a significant effect on Use Beha- viour (UB). Similarly, in determining intent to adopt BIM, a positive attitude towards working with BIM was stronger than the notion that using BIM is good. The findings discussed here reveal that the five independent variables of the UTAUT model affect BI and UB positively. Essentially, within the limits of this study, the findings indicate a strong agreement with the UTAUT model. To further this research, it would be interesting to see the results of a national survey, an exploration of the BIM maturity level of the local FM industry. It is important to explore the FC factor elements in terms of studies such as Ozumba and Shakantu (2018).
Determinants of BIM Adoption in Facilities Management in South Africa 95
REFERENCES
Attuquayefio, S.N., and Addo, H., 2014. Using the UTAUT model to analyse students’ ITC adoption. International journal of education and development using information and communication technology 9IJEDICT, vol 103, pp. 75–86 Azhar, S. 2011. Building Information Modeling BIM: Trends, Benefits, Risks, and
Challenges for the AEC Industry, Journal of Leadership and Management in Engineering, vol. 11, pp. 241–252. Carbonari, G., Stravoravdis, S. & Gausden, C. 2018. “Improving FM task efficiency through BIM: a proposal for BIM implementation”, Journal of Corporate Real Estate, vol. 20, no. 1, pp. 4–15. Cardellino, P. and Finch, E. 2006. ‘Evidence of a Systematic Approach to Innovation
in Facility Management’, Journal of Facility Management, vol. 43, pp. 150–166. Eastman, C., Teicholz, P., Sacks, R., and Liston, K. 2011. The BIM Handbook: A Guide to Building Information Modeling for Owners, Managers, Designers, Engineers And Contractors 2nd Ed. New Jersey: John Wiley and Sons. Gallaher, M.P., O’Connor, A.C., Dettbarn, J.L. and Gillday, L.T. 2004. ‘Cost Analysis
of Inadequate Interoperability in the US. Capital Facilities Industry’, NIST GCR 04-867; pp. 194. Graddy, M. 2010. Using Decision Analysis to Select Facility Maintenance Management Information Systems. Retrieved From Http://Www.Dtic.Mil/Dtic/Tr/Fulltex t/U2/A521271.Pdf. Howard, R., Restrepo, L. and Chang, C.Y. 2016. Addressing Individual Perceptions:
An Application of the Unified Theory of Acceptance and Use of Technology to Building Information Modelling. Jordani, D.A. 2010. BIM and FM: The Portal to Lifecycle Facility Management’, Journal of ‘Building Information Modeling, pp. 13–16. Kekana, T.G., Aigbavboa. CO and Thwala, W.D. 2014. Building Information Model-
ling BIM: Barriers in Adoption and Implementation Strategies in the South Africa Construction Industry. International Conference of Emerging Trends in Computer Image Processing. Liu, R. 2012. BIM Based Life Cycle Information Management: Intergrading Knowledge of Facility Management Design. Retrieved From Http://Ufdc.Ufl.Edu/Files /UFE0044045/00001/LIU__.Pdf. Mohanta, A. and Das, S. 2016. BIM as a facilities management tool: a brief review.
The 7th International Conference on Sustainable Built Environment, Kandy, Sri Lanka, December 2016 Publications. Motamedi, A. 2013. Improving Facilities Lifecycle Management Using Rfid Localization and Bim-Based Visual Analytics. Retrieved from Http://Spectrum.Library .Concordia.Ca/977834/1/Motamedi_Phd_S2014.Pdf. Ozumba, A. and Shakantu, W. 2018. Exploring challenges to ICT utilisation in
construction site management. Construction Innovation, vol. 18, pp. 321–349. Pallant, J. 2011. SPSS survival manual: A step by step guide to data analysis using the SPSS program. 4th Edition, Allen & Unwin, Berkshire. Pärn, E. A.Edwards, D. J. and Sing, M. C. P. 2017. “The building information model-
ling trajectory in facilities management: A review”. Automation in Construction, Vol. 75. pp. 45–55. Sabol, L. 2008. Building Information Modeling and Facility Management. Design and Construction strategies, LLC, Washington, DC. Retrieved From Http://Www. Dcstrategies.Net/Files/2_Sabol_Cost_Estimating.Pdf. Saunders, M., Lewis, P. and Thornhill, A. 2012. Research Methods for Business
Students 6th Ed. England: Pitman Publishing Imprint.
96 Dowelani and Ozumba
Shohet, I.M., Lavy-Leibovich, S., and Bar-On, D. Integrated Maintenance Management of Hospital Building in Israel. Journal of Construction Management and Economics, vol. 212, pp. 219–228. Straud, E.T. 2009. Understanding Technology Adoption: Theory and Future Dire-
ction for Informal Learning. Review of educational research, vol. 79 2, pp. 625–649. Succar, B. 2012. The Five Components of BIM Performance Measurement. Journal of Architectural Engineering and Design Management, vol. 8 2, pp. 120–142. Tay, L. and Ooi, J.T.L. 2001. “Facilities management: a ‘Jack of all trades?”,
Facilities, vol. 1910 pp. 357–363. Teicholz, P. 2013. BIM for Facility Management. Canada: John Wiley and Sons. Waehama, W., McGrath, M., Korthaus, A. and Fong, M. 2014. ICT Adoption and the UTAUT Model. “Proceeding of the International Conference on Educational Technology with Information Technology”, ICETIS 2014 http://www.icetis.com – Bangkok, Thailand – November 8–9, 2014.
LISTED IN THE AHFE DIGITAL BOOKSTORE CATALOGUE
Explore the complete digital volume
Human Factors in Software and Systems Engineering
Read this individual research paper free through the original publisher, or explore the full digital proceedings book.
ISBN 978-1-958651-37-7
Explore this ISBN in the AHFE Bookstore ↗Listed in the July 2026 bookstore catalogue; search by ISBN to confirm current availability · Digital book purchase optional