Verónica Prado, Mateo Romero, Johanna Pozo-Neira, Omar Alvarado (2022). A software to measure quantitative electroencephalogram during the performance of a psychological cognitive task using the OpenBCI hardware. In: Human Factors in Software and Systems Engineering. AHFE Open Access, vol. 61, pp. 102–109. https://doi.org/10.54941/ahfe1002530
Quantitative electroencephalogram (qEEG) is used to understand brain functions by processing the activity recorded through the electrodes using different algorithm techniques. The qEEG is commonly known as Brain Mapping. In this paper, we report the development of a software to synchronize the acquisition of EEG signal from the Cyton board with a cognitive task. The digitalized test was done via Psychopy, so the use of LabStreamlayer (LSL) was needed to link with both OpenBCI and LAbRecorder in order to have each stimulus synchronized with the EEG signal. Data was collected from five participants between 20-30 years old while performing the cognitive task. Our results indicate a correct linking of the data recording and the stimuli task, which enables researchers to measure different parameters such as spectral power density, power ban and brain mapping
The brain is the most precise organ in the human body and it is responsible for the sensory functions as well as the control of cognitive activity, with atten- tion and executive functions being the most relevant. According to Gonzales (2005), paradigms are experimental tasks used to map brain activity through electroencephalography (EEG) or functional magnetic resonance imaging (fMRI). The use of these imaging techniques provides knowledge regarding the abilities and functional activities of a participant during a cognitive evalu- ation. The cognitive tasks used to assess patients will stimulate different brain areas related to specific cognitive functions, such as perception, memory, logical thinking, among others. The analysis of electric and non-electric bio signals has been used in EEG and fMRI along with the aforementioned tests.
Software to Measure Quantitative Electroencephalogram 103
However, abstract-reasoning tests show a limitation as there is no system that measures the evaluation and brain activity of the patient simultaneously. In other words, a synchronization between the digitalized task and brain acti- vity is not achieved, as commercial EEG devices are not standardized on a defined protocol. These limitation does not allow researchers to obtain data that can be analyzed through quantitative or qualitative from an EEG device through software as Python, MatLab or SPS.
In this project, an abstract-reasoning paradigm will be digitalized using the Psychopy program inside the Python programming environment.
Studies done in India by the Electronic Department at the University Gora- khpur in 2014, were used to develop an interface electroencephalography (EEG) device. The device used cognitive signal processing for neurophysiolo- gical testing, and was based on a Brain Computer Interface (BCI). This device was used to measure the effect of cognitive action in the human brain due to stress, workload, emotions, along with neural activity, through the interface design. (Casey et al., 2019).
Another study, done in Indonesia, measured the concentration of people during a reading task. The experiment was applied to 16 people between 18 and 22 years old. The tasks used the OpenBCI in the Ganglion plate, and registered the different electric signals (alpha, beta, delta, theta and gamma) obtained through EEG during 15 minutes. To compare the different results, it is important to notice that a person during a focusing process will pro- vide a wave frequency between 15-18 Hz. The final results determined that the average time people can focus during a reading tasks is 11.03 minutes (Zocadagui et al., 2014).
As a result, it has been repeatedly proven that the cognitive actions in the human brain can be measured through an EEG interface. In a study done by Hansen et al. (2016) using EEG, it was demonstrated that the data acquisi- tion can achieve a 75% precision, determining that the BCI systems can be important in the future for the scientific community.
A current issue would be that, usually, psychological tests are not digitali- zed using these systems. However, newer studies are developing paradigms to stimulate the zones of interest in determined times while applying pilot tests. (Sepulveda et al., 2015).
The OpenBCI The development of diagnosis and experiments can be scanned and treated through an interface that combines the brain and computer, known com- mercially as the Brain Computer Interface (BCI) (Chang et al., 2016). The OpenBCI provides compatibility through an open code with third parties. This can be done through Matlab, Python or other programming languages.
EEG Electrode Cap The electrode cap used mesh fabric with electrodes placed in the 10-20 system. This cap allows the combination of signal quality with comfort, which lets the patients wear the device for several hours, such as for sleeping studies. It is compatible with all the OpenBCI plates. It uses 21 channels with
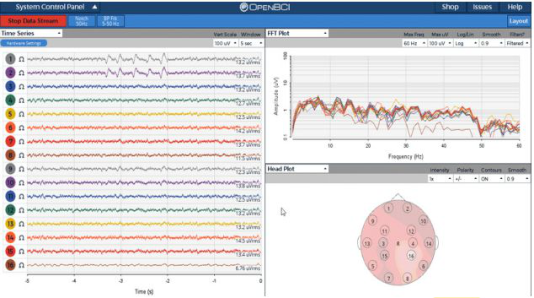
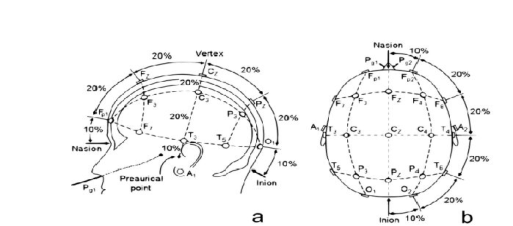
Figure 1: Main screen of the OpenBCI Retrieved from Welcome @docs.openbci.comFigure 2: Location points of the 10-20% system. Retrieved from “Posicion- de-los-electrodos-acorde-al-SistemaInternacional-10-20-Figura-vista-desde la_fig1_274457110 @ www.researchgate.net.”
1.5mm synthetized touch-proof electrodes, which have been standardized in the industry.
The 10-20 system, named this way due to the space between the electrodes and the way they’re placed in skull. Each electrode is placed between 10 and 20% from the total distance between all the recognizable points in the skull, starting at the nasion, a point between the nose and the forehead to the back of the occipital lobe, and from one earlobe to the other (Talamillo, 2011).
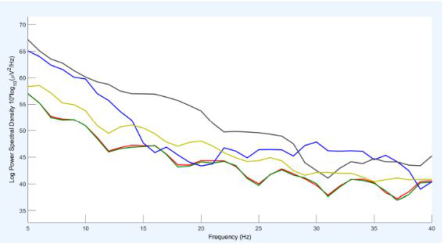
Analysis of the Spectral Potential Density The spectral potential density reports the distribution of the potential or energy that a signal has, in this paper, an EEG. It is a mathematical function that shows the distribution of the energy of such signal in the different fre- quencies where they’re modulated. Therefore, it is possible to determine on which frequency the changes in power happen (Luengas & Toloz, 2020).
Validation of an Abstract-Reasoning Paradigm The paradigm used for this project counts with semantic and visual analog tasks that were applied in young adults aged 20-30 years old. The paradigm had been validated by Shunta et al. (2020). All of the participants lived in the city of Cuenca, in Ecuador.
Software to Measure Quantitative Electroencephalogram 105
Figure 3: Spectral potential density (Luengas & Toloz, 2020).
The presentation of the times, number of conditions that were shown and the exhibition of the stimuli are characteristics that should be taken into account while using a block-design paradigm. The optimal recommendation for the presentation time is between 14-20 seconds, although there could be some exeptions for this, using blocks for up to 30 seconds. The timing will depend on the statistical potential that is hoped to achieve. Another point that should be taken into account is the duration time of the whole experi- ment, as longer experiments tend to cause anxiety or tiredness, diminishing the psychological validity of the study (Shunta et al., 2020).
Psychopy Environment Psychopy is an open code software, written in a Python programming langu- age. It combines the easy use of graphic interfaces of OpenGL with Python to generate a high-precision visual stimulus. The Psychopy environment uses a minimalist design that allows users to implement different stimulus, visual, auditory, motor, etc., using only scripts. Inside this software, different experiments can be implemented for neuropsychological studies.
LSL and Lab Recorder It’s meaning is “Lab Stream Laver”, and it consists of libraries that allow the compilation of data through different systems in order to gather different research experiments. The Lab Recorder interface allows the saving of all the streams that are available in the transmission layer and its format is saved as an Extended Disk Format (‘vdf’). This format can be processed in Matlab through the LSL scheme format (LabStreaming Layer Overivew, 2016).
METHODS
The aim of this project is to develop a software that will allow the acquisi- tion of brain activation data during the performance of cognitive tasks using OpenBCI for quantitative analysis of EEG data.
RESULTS
The aim of this project is the acquisition of data to be used as quantitative EEG at the time of analysing results. It is considered that, to have a better
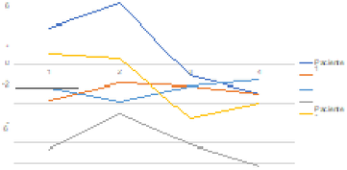
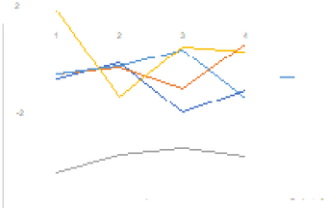
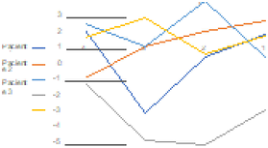
Figure 4: Average of the brain activity per participant during set 1.Figure 5: Average of the brain activity per participant during set 2.
acquisition of such data, the participants must have short, clean hair. In the case of women with longer or more voluminous hair, the contact zone for the EEG electrode was cleaned so the results will be correct at the time of analysis and would not be affected by artifacts produced by the hair.
For this study, the following electrodes were considered on the 10/20 system: F3, F4, P3, O1, and O2. These electrodes obtained the signal for the study. The test was performed in 5 participants (two women and three men), who were undergraduate students between 20 and 30 years old. The participants did not report neurological conditions that could have affected the studied paradigm.
The samples obtained for each participant were stored and saved for poste- rior analysis of the wave activation for each question presented. The data were analyzed with the EEGLAB tool, where the channels previously men- tion were filtered. The following table shows the different participants, each with their Power Spectral Density (PSD) obtained by averaging two values, a minimum and a maximum for each participant and an average for the stimuli per set.
The following figure shows the brain activation for all the participants per set, to provide information for a more generalized analysis about the complexity of the sets shown to each participant.
Figure 4 shows that one of the participants had a higher brain activation on stimulus 2 of set 1, while participant number 2 shows greater activation on the second stimulus. Participant number 3 has a higher activity at stimulus number 4, similarly to participant number 5. Participant number 4 is the one that shows the lowest brain activity in comparison to the rest of the participants during set 1.
Software to Measure Quantitative Electroencephalogram 107
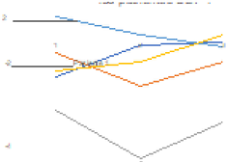
Figure 6: Average of the brain activity per participant during set 3.Figure 7: Average of the brain activity per participant during set 4.
On Figure 5, participant 1 had a higher brain activation when going from the first stimulus to the second, to then slow down at the third stimulus and go high again at the last stimulus. On the other hand, participant two has a higher activation, with no significant variation, up to the third stimulus, in which his activation goes higher and peaks at stimulus 4. Participant three has a raise on his activation up to the third stimulus, after which his brain activation is decreased until solving the fourth stimulus. Participant four has a low brain activation relatively throughout the whole test. Participant 5 has his higher peak on brain activation on the first stimulus, considerably decreasing in the second one and going high again on the third stimulus to keep the same activation up to the next stimulus.
The previous figure shows that participant one has a low brain activity after the first stimulus up to the second. After this, his brain activity decreases significantly until reaching the third stimulus, and only peaks on its highest when finishing the fourth stimuli. Analyzing the performance of participant two, it is possible to say that his brain activity decreases during set number three. Participant number 3 reaches his highest peak of brain activity on the second stimulus, to then decrease brain activation on stimulus three and raise again on the next stimulus, although with lower intensity. Participant number four has his lower brain activation on stimuli 2 and 4. At last, participant number 5 shows a decrease of brain activity from the first stimulus to the second one, then raises his brain activation, with his highest peak at stimulus number 3.
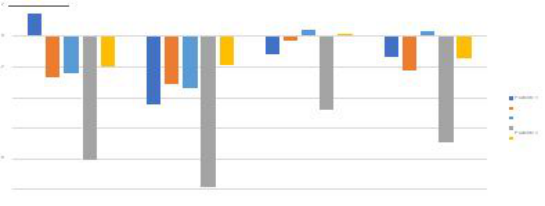
As shown on figure 8, participant one slowly increases brain activity un reaching his highest peak at stimulus 3 of set 4. The curve for participant number two shows that the brain activity decreases on stimulus number 2 to then raise at stimulus 3. Participant 3 diminishes brain activity until reaching the lowest point at stimulus 3. Participant 4 also showed a decrease on brain activation from stimulus 1 to 2, to then raise at stimulus 3. Last, participant
Figure 8: Comparison between the average brain activation among all participants across all sets.
number 5 slowly increases brain activation until peaking at the third stimulus of set 4.
A comparison on test performance for each participant across all sets. Analysing this bar graph, it is concluded that participants showed their highest brain activation during set three, and the lowest one at set 2.
CONCLUSIONS
With this data obtained by OpenBCI to be used in a quantitative analysis of EEG data using Psychopy, EEG signal was synchronized when showing a cognitive task paradigm to participants, using abstract stimuli. With the help of one student from the neuropsychology master’s program, it was possible to validate the functioning of the system on 5 participants aged 20-30 years old. The software developed in this project allows the acquisition of brain activation signals during the performance of cognitive tasks for a further quantitative analysis.
An EEG cap (EEG electrode cap), medium size, net structured and synthetic electrode use was acquiered, which uses a conducting gel to obtain the correct biosignals from participants.
During the development of the paradigm, the determined sets showed to participants used four images, to avoid tiredness effects on the participants that could interfere with the signal obtained causing noise.
It was concluded that participant number 5 showed a higher brain activa- tion (as shown on Figure 7), and had a different level of complexity wile performing the different set tasks. Set number 3 caused a higher level of activation among all participants, suggesting it was the hardest set to resolve.
REFERENCES
Hansen, E., Kristensen, M., & Schneiders, E. (2016). Timely Constraints of EEG in Cognitive Distraction and Focus Detection while Driving. https://projekter.aau. dk/projekter/files/281248912/hcc102f18Paper.pdf Martínez, A., & Vanegas, M. (2007). Aspectos neuropsicológicos de la resonancia
magnética funcional. Revista Ecuatoriana de Neurologia, 16(2), 114–117. “Posici-on-de-los-electrodos-acorde-al-SistemaInternacional-10-20-Figura-vistadesdea_fig1_274457110 @ www.researchgate.net.” [Online]. Available:
Software to Measure Quantitative Electroencephalogram 109
https://www.researchgate.net/figure/Posici-on-de-loselectrodos-acorde-al-Sis tema-Internacional-10-20- Figura-vista-desde-a_fig1_274457110. Sepulveda, R., Montiel, O., Gerardo, D., Daniel, G., & Castillo, O. (2015).
Clasificación de señales encefalográficas mediante redes neuronales artificiales. Computacion y Sistemas, 19(1), 69–88. https://doi.org/10.13053/CyS-19-1-1570 Shunta, F., Estévez, F., Aguirre, D., Alvarado, O., López, A., Peña, P., & Bueno, A.
(2020). Validation of an abstract reasoning paradigm for Functional Magnetic Resonance (fMR). Revista Ecuatoriana de Neurologia, 29(2), 58–66. https://doi. org/10.46997/REVECUATNEUROL29200058 Zocadagui, E., Sierra, M., Montaña, I., Erwin, S., & Estupiñan, A. (2014). DIMEN- SIONES DE LA EMOCIÓN EN PERSONAS CON RASGOS AGRESIVOS Y NOAGRESIVOS. In Paper Knowledge . Toward a Media History of Documents. “Posici-on-de-los-electrodos-acorde-al-SistemaInternacional-10-20-Figura- vista- desdea_fig1_274457110 @ www.researchgate.net.” [Online]. Available: https://www.researchgate.net/figure/Posici-on-de-loselectrodos-acorde-al- Sistema-Internacional-10-20- Figura-vista-desde-a_fig1_274457110. Qué Es Un Paradigma? Análisis Teórico, Conceptual Y Psicolingüístico Del Tér-
mino. Investigación y Postgrado [online]. 2005, vol.20, n.1, pp. 13–54. ISSN 1316–0087. R. Rahma and J. Nurhadi, “Measurement of Concentration Duration on Reading Activity: EEG Analysis with OpenBCI Ganglion Board,” SSRN Electron. J., no. January, 2018, doi: 10.2139/ssrn.3174465. T. Talamillo García, “Manual básico para enfermeros en electroencefa- lografía,” Enfermería Docente , no. 94, pp. 29–33, 2011, [Online]. Available: http://www.juntadeandalucia.es/servicioandaluzdesalud /huvvsites/default/files/revistas/ED-094-07.pdf. Y. Chang et al., “Feature Extraction and Signal Processing of Open-Source Brain-
Computer A Signal Processing Tool for OpenBCI Tool Descriptions,” no. Febru- ary, 2016. “Welcome @ docs.openbci.com.” [Online]. Available: https://docs.openbci.com/doc s/Welcome.html.
LISTED IN THE AHFE DIGITAL BOOKSTORE CATALOGUE
Explore the complete digital volume
Human Factors in Software and Systems Engineering
Read this individual research paper free through the original publisher, or explore the full digital proceedings book.
ISBN 978-1-958651-37-7
Explore this ISBN in the AHFE Bookstore ↗Listed in the July 2026 bookstore catalogue; search by ISBN to confirm current availability · Digital book purchase optional