Antti Syvanen, Kimmo Vanni, Jarmo Viteli (2022). Comparison Between Technostress Instruments Among Education and Health Care Sectors. In: Human Factors, Business Management and Society. AHFE Open Access, vol. 56, pp. 184–190. https://doi.org/10.54941/ahfe1002267
Background: Online meetings in Teams, Zoom and Google Meet have become a relevant part of daily activities in business, research and education. The Covid-19 pandemic forced employees to move from physical meetings to online meetings with very limited time to familiarize themselves with interfaces and functionalities of the applications. It has widely been reported that use of technology may stress people, and the phenomenon is known as technostress. However, the research about technostress due to online meetings and used tools has still been scarce. Objective: We aimed to measure technostress due to online meetings and its factors among university teachers and researchers, and clerical employees. We also aimed to compare which measure (dependent variable) would be the most reliable. Methods: A survey was conducted and the data were handled by SPSS-26 statistical package and AMOS. Statistical analyses were done by linear regressions, correlations, analysis of variance, and both experimental and confirmatory factor analysis. The used dependent variables of analyses were the sum variables of Cohen-4 stress measure and Salanova's technostress measure. Results: Analyses showed that increased online meeting hours due to Covid-19 pandemic has statistically significant impact on perceived technostress. The impact of user interfaces of online meeting tools on perceived technostress was the most relevant factor. Other significant factors were e.g., information security and topics of the meetings. Technostress between genders was statistically non-significant but age was a significant factor. Cohen-4 stress measure was not adequate for technostress assessments, whereas Salanova's technostress measure worked well. Conclusion: Covid-19 pandemic has had an impact on the use of online meetings tools. Even if tools have been useful and the relevant part of office work, the use of tools may affect technostress. The most relevant factor for technostress was the user interfaces. Based on the result, we recommend software companies to focus on developing user interfaces and assessing user experiences of online meeting tools.
Online meetings in Teams, Zoom and Google Meet have become a relevant part of daily activities in business, research and education. The Covid-19 pan- demic forced employees to move from physical meetings to online meetings with very limited time to familiarize themselves with interfaces and functio- nalities of the applications. It has widely been reported that use of technology may stress people, and the phenomenon is known as technostress. However, the research about technostress due to online meetings and used tools has still been scarce. Technostress refers to the stress an individual experiences as a result of using technology. It is a psychological condition or experience involving feelings of anxiety, fatigue, cynicism, and inefficiency (Salanova et al. 2014). Technostress has traditionally been measured, especially in infor- mation technology jobs, but as information technology has become more widespread, technostress research is expanding into more diverse work situa- tions and fields (Tarafdar et al. 2014). As information technology has become more commonplace, there has been a shift to talk about unwanted outcomes of digitalisation, and technostress is being examined increasingly from the point of view of general stress research.
With digitalisation, the ability of employees to identify the negative and positive effects of the use of information technology has become increasingly important for the meaningfulness and well-being of work. This has become clear recently, especially regarding the use of online conferencing and com- munication tools. Online conferencing tools are software platforms used at work, but they also have social media features. The use of social media plat- forms has been found to produce symptoms suggestive of technostress (Salo et al. 2019), while their direct exploitation and experience of technostress in working life have increased (Brooks et al. 2017). Detecting the sources and symptoms of technostress is fast becoming an important working life skill. Methods for exploring technostress need to keep developing as the phenomenon changes.
The specific research questions were as follows:
1. How are technostress distributed among respondent groups in education and health care sector? 2. How do individual technostress instruments fit to report technostress?
METHODS
Technostress research has emphasized the use of self-reported survey meth- ods, which have largely utilized metrics on similar sources and consequences of technostress compiled by Ayyagar et al. (2011) and Ragu-Nathan et al. (2008). The main sources of technostress have been studied e.g., an influx of information, i.e., an increasing amount of information; invasion, i.e., the constant presence of information systems in everyday life; complexity, i.e. the complexity of use; uncertainty, i.e., insufficient technological understanding in relation to others; as well as turnover, i.e., constant updates and technical changes (Tarafdar et al. 2014). Surveys related to the experience of techno- stress have been used less. The most significant of these so far has been the survey by Salanova et al. (2014).
An online survey was conducted, and the data were handled by SPSS- 26 statistical package and AMOS. Statistical analyses were done by linear regressions, correlations, analysis of variance, and both experimental and confirmatory factor analysis.
The dependent variables of analyses were the sum variables of Cohen-4 stress measure (Cohen et al. 2014) and Salanova’s technostress measure. The independent variables were selected from participants’ background informa- tion and they attitudes concerning work related stress, technostressors and technostress. Items on creators of technostress were presented in the 5-point Likert scale with options from strongly disagree to strongly agree. The percei- ved stress level was assessed with Cohen-4 measure which consists of four items on a five-point scale from 0 “never” to 4 “very often” (Cohen et al. 1994). Cohen-4 has shown good internal consistency and reliability. In this study, an acceptable level of internal consistency was reached (α = .75).
Creators of technostress were studied with 23 items, likert-5 scale (Chen, 2015):
Information overload (6 items): “The complexity of using online tools has increased my workload”,
Invasion (3 items): “I have a feeling that online tools are interfering with my normal life”,
Complexity (5 items): “I need a long time familiarize with utilizing online tools”,
Uncertainty (5 items): “I feel like online tools are threatening my job”,
Insecurity (4 items): “Our work organization always uses the latest online tools”.
RESULTS
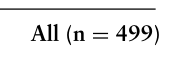
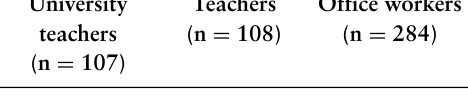
Table 1 shows the demographic distribution of the respondents’ age, gender, work experience years as well as the mean values of Tarafdar’s, Salanova’s and Cohen’s stress instruments. Also, the percentages of maximum values of measures are presented. The maximum sum of Tarafdar measure is 115 (23 items with 5-point likert scale) and respectively sum of Salanova is 112 (16 items with 7-point likert scale), and sum of Cohen is 16 (4 items from 0 to 4). The results show that stress measures of university teachers are higher than the other groups. That also was verified by Analysis of variance (ANOVA).
The internal consistencies of the models were assessed by computing their reliability (Table 2). All measures have high reliability. The Average Variance Extracted (AVE) values for all measures are higher than the threshold of 0.5, and both alpha and the Composite Reliability (CR) were over or very close to threshold value 0.7 and thus acceptable (Fornell and Larcker, 1981). A bit lower CR value regarding Tarafdar’s instrument may result for removing number of items from the tested model.
Table 1. Demographic distribution of the respondents.
The Table 3 shows that Tarafdar’s and Salanova’s instrument has a signi- ficant and high correlation between, whereas the correlations between them and Cohen’s stress instrument are significant but low. Obviously, Salanova’s 7-point measure and 3-point measure has a high correlation between. In addi- tion to tested instruments, the separate components of Tarafdar’s instrument were tested. All the components except uncertainty correlate with Salanova’s instrument well, and complexity has a high correlation with the whole Taraf- dar instrument. The result may suggest that also components of Tarafdar measure could be used in assessing technostress instead of 23-item measure.
Table 4 presents the model fit measures which are typical in CFA. The thresholds for CFA are suggested in various sources (Hu et al. 1999). All the tested stress instruments fulfill the model fit requirements of CFA. The tested stress models were modified excluding Cohen -4 measure. Tarafdar instrument was revised by removing the factors where a loading was under 0.7. In the final model the tested Tarafdar instrument included five items from complexity, three items from invasion and three items from uncertainty. In sum, the Tarafdar model was modified from the original 23 item measure to 11 item measure. The Salanova instrument was in the original setup except the original 7-point Likert scale was revised to 3-point scale. The 3-point scale worked better because the upper and lower classes were combined.
Table 4. Model fit measures (CFA) of stress instruments.
The tested instruments showed a good fit. The fit of the instruments was assessed using seven fit indices: Cmin/df, Goodness-of-Fit Index (GFI), Comparative Fit In-dex (CFI), Adjusted Goodness of Fit (AGFI), Tucker– Lewis index (TLI), Root Mean Square Error of Approximation (RMSEA) and PCLOSE value. Cmin/df ratios less than 3 are good, a CFI above 0.95 indicates great fit, and RMSEA should be below 0.08. TLI should be over 0.90, PCLOSE above 0.05, GFI above 0.95 and AGFI above 0.80. The thre- shold of indices in the model fit are still under debate and it is difficult to judge exactly when the model should be rejected. One common fact is that RMSEA should be below 0.08 and values below 0.05 indicate good fit (Xia and Yang, 2019).
Creators of technostress, technostress and work-related stress levels betw- een respondent groups were statistically significant. Work related stress levels were significantly higher on university teachers as compared to tea- chers F(2,496) = 28,74, p < ,001. Technostress levels were significantly higher on university teachers as compared to teachers and office workers F(2,496) = 7,99, p < ,001. Creators of technostress were significantly higher on university teachers as compared to teachers and office workers F(2,496) = 20,66, p < ,001.
DISCUSSION
Cohen-4 stress measure was not adequate for technostress assessments, whe- reas Salanova’s and Tarafdar’s modified technostress measures worked well. The study showed that technostress can be measured by different instruments. In the studied population the Salanova’s instrument worked better compared to Tarafdar’s or Cohen’s instruments. The study showed that Salanova’s and Tarafdar’s instruments had positive and significant correlation between, but Cohen’s instrument correlated poorly. The finding is logical because both Tarafdar’s and Salanova’s instruments are developed for assessing techno- stress, whereas Cohen measure is for assessing perceived stress overall. Even if Salanova’s and Tarafdar’s instruments measure different dimension of tech- nostress, both of them are adequate for assessing perceived technostress. However, the instruments seem to need revision for fulfilling the goodness of fit requirements. In this study, the Tarafdar’s instrument required more revision than Salanova’s instrument. Even if the Cohen’s instruments is valid
Comparison Between Technostress Instruments 189
as such and fits well for assessing perceived stress, it can be concluded that it is an adequate measure for assessing technostress.
The technostress level of university teachers was significantly higher com- pared to office workers or other teachers. The reason for that is that the online working hours of university teachers were relatively high compared to office workers and other teachers.
CONCLUSION
Covid-19 pandemic has had an impact on the use of online meetings tools. Even if tools have been useful and the relevant part of office work, the use of tools may affect technostress. The original technostress instruments consist of numerous items and survey questionnaires are rather long. The study showed that also the components of Tarafdar’s instrument correlated well between the whole measure and Salanova’s instrument. It can be stated that instead of using the whole instrument with 23 items, a component with 5 items can report technostress reliable. However, it can be concluded that technostress instruments should be researched more, and different item settings should be tested with various analyses such as CFA.
ACKNOWLEDGMENT
This study has been funded by The Finnish Work Environment Fund project #200130 on Technostress and Online Work.
REFERENCES
Ayyagari, R. Grover, V. Purvis, R. (2011) Technostress: technological antecedents and implications. MIS quarterly, 35:831-858. Brooks, S. Longstreet, P, Califf, C. (2017) Social media induced technostress and
its impact on Internet addiction: A distraction-conflict theory perspective. AIS Transactions on Human-Computer Interaction, 9:2, 99–122. Chen, Leida (2015) Validating the Technostress Instrument using a Sample of Chinese Knowledge Workers, Journal of International Technology and Information Management 24:1. Cohen, S. Kamarck, T. Mermelstein, R. (1994) Perceived stress scale. Measuring
stress: A guide for health and social scientists, 10, 1–2. Fornell, C. Larcker D.F. (1981). Evaluating Structural Equation Models with Unobservable Variables and Measurement Error. Journal of Marketing Research 18:1 39–50. Hu, L.T. Bentler, P.M. (1999) Cutoff Criteria for Fit Indexes in Covariance Structure
Analysis: Conventional Criteria versus New Alternatives, Structural Equation Modeling. A Multidisciplinary Journal 6:1, 1–55. Ragu-Nathan, T. S. Tarafdar, M. Ragu-Nathan, B. S. Tu, Q. (2008) The consequences of technostress for end users in organizations: Conceptual development and empirical validation. Information systems research, 19(4), 417–433. Salanova, M. Llorens, S. Ventura, M. (2014) Technostress: The dark side of tech-
nologies. The impact of ICT on quality of working life pp. 87-103. Springer, Dordrecht.
Salo, M. Pirkkalainen, H. and Koskelainen, T. (2019) Technostress and social networking services: Explaining users’ concentration, sleep, identity, and social relation problems. Info Systems J. 29: 408–435. Tarafdar, M. Bolman Pullins, E. Ragu-Nathan, T.S. (2014) Examining impacts of
technostress on the professional salesperson’s behavioural performance. Journal of Personal Selling & Sales Management, 34:1, 51–69. Tarafdar, M. Cooper, C.L. Stich, J.F. (2019) The technostress trifecta-techno eustress, techno distress and design: Theoretical directions and an agenda for research. Information Systems Journal, 29:1, 6–42. Vallejo, M.A. Vallejo-Slocker, L. Fernández-Abascal, E.G. Mañanes, G. (2018) Deter-
mining Factors for Stress Perception Assessed with the Perceived Stress Scale (PSS-4) in Spanish and Other European Samples. Front. Psychol. 9:37. Xia, Y. Yang, Y. (2019) RMSEA, CFI, and TLI in structural equation modeling with ordered categorical data: The story they tell depends on the estimation methods. Behav. Res. 51, 409–428.
LISTED IN THE AHFE DIGITAL BOOKSTORE CATALOGUE
Explore the complete digital volume
Human Factors, Business Management and Society
Read this individual research paper free through the original publisher, or explore the full digital proceedings book.
ISBN 978-1-958651-32-2
Explore this ISBN in the AHFE Bookstore ↗Listed in the July 2026 bookstore catalogue; search by ISBN to confirm current availability · Digital book purchase optional