Manolis Lourakis, Maria Pateraki (2022). Computer vision for increasing safety in container handling operations. In: Human Factors and Systems Interaction. AHFE Open Access, vol. 52, pp. 115–122. https://doi.org/10.54941/ahfe1002146
Workers in ports work with and in close proximity of heavy machinery. Quay cranes used for moving containers between ships and the dockside yard are one of the most accident-prone equipment types. For picking up containers, these cranes are equipped with spreaders, i.e. lifting devices which are lowered down on top of containers and lock on to them mechanically. We are concerned here with monitoring a moving quay crane spreader so as to make sure that safe clearance distances are maintained from the locations of dock workers in a port container cargo handling environment. The paper describes the application of computer vision techniques to develop a model-based, monocular spreader tracker. By tracking in three dimensions the position and orientation of the spreader during loading and unloading operations, a threat volume enclosing it can be defined. Constantly monitoring the distance of dock workers from this threat volume can improve the operator’s situational awareness and increase safety in the work environment. Quantitative experimental evaluation is also reported.
The practice of transporting raw materials and finished products in contai- ners of standardized dimensions has facilitated seamless and efficient cargo movement over long distances. Intermodal freight containers permit the rapid movement of cargo between road, rail and water transportation networks. Container vessels loaded and unloaded via quay cranes (Bartošek & Marek, 2013) have been one of the key factors behind the growth of the global mari- time industry in recent decades. This trend is intensified by the increasing number of container mega ships entering service each year. The ever-growing volume of containerized cargo demands its high-speed handling at ports, which however runs the risk of increasing the fatigue and stress of both the crane operators and dock workers over time. This can ultimately jeopardize the safety of dock workers in the vicinity of a crane. According to (PSS, 2019), vessels carrying containers are the most likely to have an accident, whereas (Budiyanto & Fernanda, 2020) report that human error is the most common cause of accidents during loading and unloading container operations. The following sections present our efforts towards improving the safety of dock port workers.
SPECIFICATIONS AND DESIGN To prevent struck-by injuries that are induced by a container, a spreader or a falling object, we monitor the position of a moving crane spreader relative to the location of dock workers. Using computer vision analysis of a video stream obtained from a camera mounted on the crane, we continuously track its spreader. Tracking aims to constantly estimate the location of the crane spreader in 3D space. The spreader is a rigid object, hence its location in space is specified by a rotation matrix for orientation and a translation vector for position, which are collectively referred to as its 6D pose.
Based on the estimated pose, a threat volume is defined around the crane spreader in the form of an oriented bounding box (OBB). The worker’s loca- tions relative to the moving spreader are also continuously monitored via dual-band Global Navigation Satellite System (GNSS) receivers integrated in their smartphones. Determining whether safe clearance distances are main- tained from all workers amounts to estimating the distance to the OBB from the location of each worker. If the spreader moves too close to a worker, posing an imminent threat to his safety, alerts directed to both the particular worker and the crane operator can be automatically triggered.
METHODOLOGY
To account for the lack of strong texture on the spreader, our tracking algo- rithm is based on straight line segments and is inspired by RAPiD (Harris, 1992). The algorithm can accommodate an arbitrary triangle mesh model without any pre-processing. This is achieved by using an object model toge- ther with rasterization rendering to produce a depth image and perform hidden line removal. Rendering automatically handles self-occlusions, thus permitting control points to be defined on visible wireframe segments. The 6D pose is evolved from frame to frame using robust regression techniques. The rest of the paper presents an overview of our approach whereas a detailed technical description can be found in (Lourakis & Pateraki, 2021).
The primary idea behind RAPiD-like tracking is that the difference betw- een the actual pose and its estimate is small. This allows linearization of the pose estimation and, in combination with the knowledge of the object’s 3D model, simplifies edge matching. Specifically, edge matching involves the definition of a sparse set of so-called control points (Harris, 1992) on the tracked 3D object, which are likely to project on high-contrast image edges. By measuring the perpendicular component of the displacement of these con- trol points projections on the image plane, the 3D motion of the underlying object between two consecutive frames can be estimated. The current pose estimate is then updated with the incremental frame pose change.
Control points in the original RAPiD were manually sampled offline along the edges of a 3D object model and in areas of rapid albedo change. In our case, they are generated dynamically by combining information from strai- ght line segments detected in the image and a rendered wireframe model. This increases significantly the applicability and flexibility of the developed tra- cker, as it does not impose any constraints on the form of the employed 3D
Computer Vision for Increasing Safety in Container Handling Operations 117
model, nor it presumes any sort of manual intervention for the definition and visibility management of the control points.
Straight Line Segment Detection Image straight line segments are detected in this work with the LSD detector (Grompone von Gioi, et al., 2010). It applies region growing to partition an image into line support regions with similar gradient orientation, appro- ximates each such region with a rectangle and validates its meaningfulness using the number of aligned orientations. LSD is employed in our pipeline to compute a binary image which classifies pixels as belonging to a straight line segment or not. This binary image along with the orientation of the line segments quantized in four bins form the basis for the perpendicular points matching that is required for tracking. To save computations, line detection is not applied to an entire image but rather a rectangular region centered on the spreader’s last known projection.
Depth Rendering and Object Models Depth rendering generates an image whose pixel values are depths rather than intensities. More specifically, provided with a triangle mesh model of an object and a camera pose, every pixel in the rendered depth image corresponds to the depth of the nearest point on the model’s surface that projects on the pixel in question. To deal with multiple triangles projecting on a pixel, the Z-buffering algorithm is employed (Akenine-Moller, et al., 2008). Z-buffering is a computer graphics technique that is used to deter- mine whether an object, or part of it, is visible in a scene. It uses a 2D Z buffer to compare the depths of a certain pixel for all triangles projecting on it and retains the smallest, as this corresponds to the closest triangle. In this manner, a solid object in the foreground will block the view of those behind it. Z-buffering is also employed to perform hidden line removal, as follows. Unoccluded projected triangle edges are specially marked in the Z buffer, excluding edges that are shared by pairs of triangles with parallel nor- mal vectors. Then, the visibility of edges is determined based on their depth comparison, as with all non-edge pixels.
A medium-level detail mesh model of the crane spreader was designed with CAD software, using its actual physical dimensions obtained from engine- ering drawings. Elaborate, high detailed models were avoided as they do not noticeably improve the accuracy of tracking, while incurring a larger computational cost to be rendered.
Line Segment Matching Starting with two binary line segment maps and their corresponding quan- tized orientation maps, line segment matching concerns the establishment of partial, perpendicular correspondences between line segment pixels. This is achieved by examining each segment pixel in the source (i.e., rendered) segment map and moving along the segment normal direction in the target (i.e., intensity) map, until either a segment pixel is found or a maximum dista- nce from the starting pixel has been traced. To declare a partial match, the
118 Lourakis and Pateraki
segment pixel found in the target map has to have an orientation compatible with that of the source pixel.
The search for a perpendicular match along the segment normal has linear rather than quadratic complexity, this being a crucial enabling factor for real-time tracking. The search for corresponding segment pixels has to be performed in both directions normal to a line segment, as it is not possi- ble to know in advance which side of the source line segment the target one has moved. In case that matches are found for both directions, the closest one is retained. Visited pixels are determined with Bresenham’s line drawing algorithm which involves integer coordinates only.
Pose Update Given a set of perpendicularly matched points in two line segment maps, pose update uses them to determine an estimate of the pose change giving rise to the two segment maps and then update the current pose estimate in an incremental fashion. A single perpendicularly matched point pair provides one linear constraint in the six parameters defining the incremental change in pose. Details on the mathematical derivation of this constraint can be found in Section 3 of (Lourakis & Pateraki, 2021).
In theory, six perpendicular matches along different directions suffice to yield a unique solution. In practice, many more segment matches are establi- shed, thus the change in pose can be estimated from all available constraints. However, various sources of error will cause certain perpendicular distances to be erroneous, therefore giving rise to outlying constraints with large resi- duals. Hence, pose estimation should be carried out using robust regression techniques. In this work, robustness is achieved with graduated optimization, specifically the graduated non-convexity (GNC) approach of (Yang, et al., 2020). This is a general-purpose approach that optimizes a sequence of surro- gate functions, which starts from a convex approximation of the desired cost function, and gradually becomes non-convex as it converges to the desired cost. A surrogate function may be chosen as a scaled version of the origi- nal robust cost function, which is easier to minimize as it induces fewer local minima than the original cost. The surrogate function is equivalent to the sum of two terms, a weighted least squares and a function of the weights. Thus, it is iteratively optimized by alternating between a variable update and a wei- ght update step. The variable update step solves the weighted least squares problem using non-minimal solvers, whereas the weights are then updated in closed form.
To align the local coordinate system of the tracking camera with a ground coordinate system, a camera georeferencing technique combining informa- tion from ground control points and low-cost GNSS receivers was developed (Lourakis, et al., 2020).
Single Frame Pose Initialization The approach described above estimates incremental pose updates which are integrated over time in order to yield the spreader’s pose in a certain image frame. To determine the spreader’s pose in a single frame so as to bootstrap
Computer Vision for Increasing Safety in Container Handling Operations 119
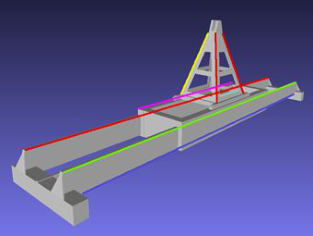
Figure 1: Characteristic lines in spreader model (left) and container with attached markers (right).
tracking, we developed the semi-automatic procedure described next. First, we delineate in the image in question a few characteristic lines whose preima- ges in the spreader’s mesh model are easily identifiable (see Figure 1 (left)). Then, a preliminary estimate of the spreader’s pose is computed from these lines with a Perspective-n-Line (PnL) solver (Wang, et al., 2019) embedded in RANSAC (Fischler & Bolles, 1981) for filtering out any outliers. Finally, the preliminary estimate is refined using the Levenberg-Marquardt non-linear least squares algorithm (Lourakis, 2004) to minimize the re-projection error between actual image line segments and their projected locations predicted with the pose estimate (Kamgar-Parsi & Kamgar-Parsi, 2004). PnL requires at least three lines; using a few more improves robustness. Only the orientati- ons of line segments matter in this process and not their actual endpoints. The task of defining the characteristic model lines is accelerated by a custom gra- phical tool that allows these lines to be overlaid on the image and interactively manipulated.
EXPERIMENTAL EVALUATION Experimental results from a prototype of the tracker are presented in this section. The input used consists of image sequences depicting a crane spreader during normal container vessel loading/unloading operations at Heraklion’s port container terminal. The sequences were acquired with a GigE camera installed next to the operator’s cabin of a pedestal quay crane at a height of approximately 20 meters from the ground. Intrinsic camera calibration was performed offline and lens distortion was removed from the acquired images using the estimated coefficients. The tracked spreader is of the single-lift type, measures around 12.2 m (40 ft) along its longest dimension and is suspended with wire ropes from the crane boom at locations several meters away from the camera.
Collection of Ground Truth To assess the accuracy of estimated poses, ground truth pose data must be available. To obtain such data, several marker patterns were attached on the
120 Lourakis and Pateraki
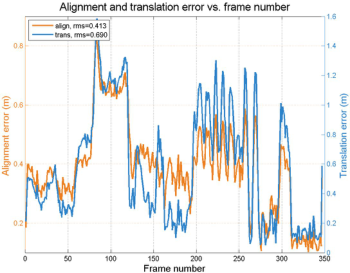
Figure 2: Alignment and translation pose tracking errors for two sequences.
surface of a container and then videos of this particular container being lif- ted and moved were acquired. The markers are installed on the container so that they do not interfere with the appearance of the spreader. Markers in the captured images are automatically localized and recognized with image processing techniques. By employing markers with distinct visual patterns whose physical locations on the surface of the container are accurately mea- sured, their 3D model coordinates and their corresponding image projections become available. Estimating pose essentially becomes a task of solving the Perspective-n-Point (PnP) problem (Terzakis & Lourakis, 2020) in a robust regression framework, followed by a minimization of the inlying points re- projection error with the Levenberg-Marquardt algorithm (Lourakis, 2014), (Lourakis & Zabulis, 2013).
For the experiments reported here, a total of 22 unique ArUco (Garrido-Jurado, et al., 2014) artificial markers were printed on A3 paper sheets. Each such marker has a distinct 2D binary pattern that uniquely iden- tifies it and can be automatically detected in images. Seventeen of the marker sheets were affixed to a large vertical face of a container and the remaining five to a small vertical face (see Figure 1 (right)). The markers were detected automatically in images and their corresponding 3D model coordinates were inferred from their identity and the knowledge of their actual location on the container’s surface. Not all markers can be detected in each image due to distance and perspective deformation. Still, around 15 of them were always detected with 3 being the sufficient minimum for determining pose.
Results
We report here two experiments performed using video sequences that depict a 40 ft high-cube container being moved, with the markers attached to two of its sides (cf. Figure 1). The employed camera lens had a medium focal length (f = 6.0mm), which, combined with the fact that the container is rela- tively close to the crane, provides close views of the container + spreader combination. This, in turn, facilitates the detection of the marker patterns. Graphs illustrating the tracking error with respect to ground truth are shown in Figure 2. Each such graph contains two curves, plotted using y-axis labe- ling with two vertical axes on the left and the right of the graph. One of the
Computer Vision for Increasing Safety in Container Handling Operations 121
curves depicts the alignment error (the ADD metric, see (Hinterstoisser, et al., 2012)) whereas the other corresponds to the translation (i.e. positional) error. The root mean square (RMS) errors are included in the plot legends. It is clear that the alignment error is always less than 1 m and around 0.5 m on average. The tracker’s running time depends on the size of images as well as the appa- rent size of the tracked spreader in them and is between 3 to 6 frames per second for the 1928x1448 images that were used. The bulk of the running time is spent by LSD in line segment detection. More experimental results can be found in (Lourakis & Pateraki, 2021).
Having applied the proposed tracker to several image sequences, we have empirically verified that it generally performs satisfactorily. The tracker is ini- tialized semi-automatically, using the previously described procedure based on the identification of characteristic line segments. We have observed that tracking is primarily challenged by large changes in the appearance and appa- rent size of the spreader. Another issue relates to rapid motions and crane vibrations as well as dropped image frames due to high network or host CPU latencies which can create jumps in an image sequence that hinder the establi- shment of matches. Tracking performance is less susceptible to impediments such as low resolution, illumination changes, shadows, overexposure and partial occlusions. A parameter that needs to be properly selected is that spe- cifying the maximum search range for potential matches along directions that are perpendicular to line segments.
CONCLUSION
Container terminals are high risk working environments. This paper has described computer vision techniques which address the problem of tra- cking a container crane’s spreader in 3D space during loading and unloading operations. In this manner, they improve the monitoring of risk zones and contribute to increasing occupational safety.
ACKNOWLEDGMENT
This work has received funding from the EU Horizon 2020 programme under GA No. 826506 sustAGE. The authors acknowledge the help of Heraklion Port Authority.
USA: A.K. Peters. Bartošek, A. & Marek, O., 2013. Quay Cranes in Container Terminals. Transactions on Transport Sciences, Volume 6, pp. 9–18. Budiyanto, M. A. & Fernanda, H., 2020. Risk Assessment of Work Accident in Con-
tainer Terminals Using the Fault Tree Analysis Method. J. of Mar. Sci. and Eng., Volume 8. Fischler, M. A. & Bolles, R. C., 1981. Random Sample Consensus: A Paradigm for Model Fitting with Applications to Image Analysis and Automated Cartography. Commun. ACM, June, Volume 24, pp. 381–395.
122 Lourakis and Pateraki
Garrido-Jurado, S., Muñoz-Salinas, R., Madrid-Cuevas, F. J. & Marín-Jiménez, M. J.,
2014. Automatic Generation and Detection of Highly Reliable Fiducial Markers Under Occlusion. Pattern Recognition, Volume 47, pp. 2280–2292. Grompone von Gioi, R., Jakubowicz, J., Morel, J.-M. & Randall, G., 2010. LSD: A Fast Line Segment Detector with a False Detection Control. IEEE Trans. Pattern Anal. Mach. Intell., Volume 32, pp. 722–732.
Harris, C., 1992. Tracking with Rigid Objects. In: A. Blake & A. Yuille, eds. Active Vision., pp. 59–73. Hinterstoisser, S. et al., 2013. Model Based Training, Detection and Pose Estimation of Texture-Less 3D Objects in Heavily Cluttered Scenes. In: Lee, K.M., Matsushita, Y., Rehg, J.M., Hu, Z. (eds) Computer Vision – ACCV 2012. Lecture Notes in Computer Science, vol 7724. Springer, Berlin, Heidelberg. https:/doi.org/10.1007/978-3-642-37331-2_42 Kamgar-Parsi, B. & Kamgar-Parsi, B., 2004. Algorithms for Matching 3D Line Sets.
IEEE Trans. Pattern Anal. Mach. Intell., May, Volume 26, pp. 582–593. Lourakis, M., 2004. levmar: Levenberg-Marquardt Nonlinear Least Squares Algorithms in C/C++. [Online] Available at: http://www.ics.forth.gr/~lourakis/levmar Lourakis, M., 2014. posest: A C/C++ Library for Robust 6DoF Pose Estimation
from 3D-2D Correspondences. [Online] Available at: http://www.ics.forth.gr/~l ourakis/posest Lourakis, M. & Pateraki, M., 2021. Markerless Visual Tracking of a Container Crane Spreader, 2021 IEEE/CVF International Conference on Computer Vision Workshops (ICCVW), Montreal, BC, Canada, 2021, pp. 2579-2586, doi: 10.1109/ ICCVW54120.2021.00291. Lourakis, M. et al., 2020. Pose Estimation of a Moving Camera with Low-cost,
Multi-GNSS Devices. Int. Arch. Photogramm. Remote Sens. Spatial Inf. Sci., Volume XLIII-B2-2020, pp. 55–62. Lourakis, M. & Zabulis, X., 2013. Model-Based Pose Estimation for Rigid Objects. In: Chen, M., Leibe, B., Neumann, B. (eds) Computer Vision Systems. ICVS 2013. Lecture Notes in Computer Science, vol 7963. Springer, Berlin, Heidelberg. https:// doi.org/10.1007/978-3-642-39402-7_9 PSS, 2019. Port Industry Accident Statistics 2019. [Online] Available at: https:// www.portskillsandsafety.co.uk/ Terzakis, G. & Lourakis, M., 2020. A Consistently Fast and Globally Optimal Solution to the Perspective-n-Point Problem. In: Vedaldi, A., Bischof, H., Brox, T., Frahm, JM. (eds) Computer Vision – ECCV 2020. Springer, Cham. https:// doi.org/10.1007/978-3-030-58452-8_28 Wang, P., Xu, G., Cheng, Y. & Yu, Q., 2019. Camera Pose Estimation from Lines:A Fast, Robust and General Method. Machine Vision and Applications, June, Volume 30, pp. 603–614. Yang, H., Antonante, P., Tzoumas, V. & Carlone, L., 2020. Graduated Non-Convexity for Robust Spatial Perception: From Non-Minimal Solvers to Glo-bal Outlier Rejection. IEEE Robotics and Automation Letters, Volume 5, pp. 1127–1134.
LISTED IN THE AHFE DIGITAL BOOKSTORE CATALOGUE
Explore the complete digital volume
Human Factors and Systems Interaction
Read this individual research paper free through the original publisher, or explore the full digital proceedings book.
ISBN 978-1-958651-28-5
Explore this ISBN in the AHFE Bookstore ↗Listed in the July 2026 bookstore catalogue; search by ISBN to confirm current availability · Digital book purchase optional