Wenjun Hou, Yuxin Han, Xinli Wei (2022). An interactive visualization system for urban cultural quantitative model. In: Ergonomics In Design. AHFE Open Access, vol. 47, pp. 609–615. https://doi.org/10.54941/ahfe1001989
Urban culture is a core component of a city’s humanistic characteristics and urban charm. An in-depth exploration of it will help deepen the cultural cognition of the city and enhance the joint force of the city’s cultural development. Under the background of emphasizing the deep integration of culture and technology, this research proposes a digital visualization system for the laws and connotations of Beijing's urban culture. For this purpose, data on Hutongs, time-honored brands, and literary landmarks were collected from three dimensions of residential areas, commercial areas, and urban landmarks. The concept of urban-culture-value was proposed, and corresponding indicators and an evaluation system were constructed. Besides, a visualization system was provided to show the distribution and relationship of urban culture in geographic space. Lastly, through case analysis, a model of Beijing Urban Cultural Belt was established, and the relationship between urban culture and political center was explored. Furthermore, three types of urban culture distribution models, centralized, conventional, and marginal, were proposed.
Culture is the manifestation of various explicit or implicit behavior patterns and the symbolization of human beings. In China, which pays special atten- tion to daily life, urban culture is integrated into the food, clothing, housing, and transportation that people are used to. As a historical and cultural city, Beijing has a traditional culture for thousands of years, profoundly influe- ncing people’s psychological characteristics and social customs. The urban culture originates from the unique spiritual connection between Beijingers and the city. The urban culture in Beijing has unique regional customs and culture.
Most of the existing digital expressions of Beijing’s urban culture are concentrated in a specific type. Such as the cultural communication of Hutong and Siheyuan, Culture Communication. Or in the Beijing histo- rical material. There is rarely an exploration of quantitative analysis of urban culture. Specifically, the researches mentioned above focus on the redesign and digital dissemination of Beijing’s material culture. Although
technologies such as digital modeling are essential for preserving historical data in Beijing, the spiritual connotations conveyed by cultural representati- ons are also important. In this research, we focus on quantifying Beijing’s urban culture, applying computing and related technologies to this field, exploring the internal connections of Beijing’s urban culture from multiple dimensions, and performing visual analysis and display of it.
According to the keywords “Beijing culture” and “urban culture”, this research first searches the corresponding literature from the public literature database. After analyzing the obtained literature through citespace, it is found that the following three aspects are highly related to urban culture: residen- tial areas, commercial areas, and urban landmarks. By focusing on these three aspects of Beijing culture, three dimensions of Hutong, time-honored brand, and literary landmark are obtained. Then we use the material dimension of the above-mentioned cultural space as the connecting carrier to implement a quantitative study on the Beijing urban culture. First, the Analytic Hiera- rchy Process is used to define three-dimensional cultural indicators, and then the entropy weight method is used to assign different weights to each indica- tor to design and develop an urban culture visualization system. The system supports inquiries about the cultural data and evaluation indicators of the urban culture in a specific location and the attributes and details. Finally, combining the symmetrical characteristics of Beijing’s layout and exploring the distribution of urban culture based on distance data, three modes of cen- tralized, conventional, and marginal are proposed to deepen people’s deep understanding of Beijing culture and geographic perception.
METHOD
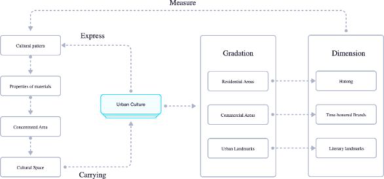
As described in Fig. 1, after literature research on cultural calculations and Beijing culture, we have summarized the quantitative system’s research methods and ideas. This research first collected relevant descriptions and attributed data on Hutongs, time-honored brands, and literary landmarks. Then through the Analytic Hierarchy Process, the evaluation indicators of the urban culture value of various places are defined. Under the guidance of the indicator framework, we used the entropy weight method to determine each indicator’s weight and calculated the cultural level of each location based on this.
Then we visualized the various attributes of each location in a three- dimensional geographic space. Finally, we extracted the geographic distance information between various locations and used the distance information to explore the distribution of urban culture around a specific location to study the distribution pattern of Beijing urban culture.
Data Preprocessing Data Overview
Yang Baoan defined an analytic hierarchy method in his research, and we adopted its composition method to design the evaluation system of the urban culture.
An Interactive Visualization System for Urban Cultural Quantitative Model 611
Figure 1: The composition and influencing factors of urban culture.
Hutong’s influence evaluation system consists of Hutong’s entry popula- rity, celebrity search index, and Celebrity Information Index. Encyclopedia entries represented by Baidu Baike have become one of the most commonly used knowledge sources in the Internet era. The page views of related entries can indicate their influence. Therefore, Hutong’s entry popularity and cele- brity search index are composed of the corresponding Baidu Baike search index. In the data collation of residential areas, this paper collected a list of residents with more significant influence in hutongs and took Hutongs where they lived as the research object.
This paper collects relevant data of time-honored brands through web crawlers. After removing irrelevant fields based on previous literature rese- arch results, it defines the influence of time-honored brands through three dimensions: number of branches, existence time, and celebrity relevance.
One hundred twenty-five representative literary landmarks were selected from the many Beijing-style literary works of Lao She and Deng Youmei. The types of literary landmarks were defined according to the descriptions in the works: symbolic type, living environment type, store type, route type, ethnic fusion type, elegant taste type.
The Entropy Weight Method There are different indicators in the geographical distribution of the three types of data of Hutong, time-honored brands, and literary landmarks. A comprehensive calculation of various indicators calculates urban culture’s value, but the weights of different evaluation systems’ weights are different. Therefore, it is necessary to evaluate each indicator as a whole to determine which indicator can better reflect the urban culture.
Considering that the subjective weight calculation method may have the risk of subjective factors, we adopt an objective weighting method based on the principle of difference driving to evaluate each indicator’s weight. This paper uses the entropy method to determine the influence weight coefficient according to the amount of indicator information. The weight calculation results of indicators are shown in Table 1.
Calculation of the Distribution Model of Urban Culture While calculating the value of urban culture, the latitude and longitude data of the location are also correspondingly linked. We know the latitude and
Hutong Entry Popularity 0.730 0.444 Celebrity Search Index 0.858 0.234 Celebrity Information Index 0.805 0.321 Time-honored Brands Number of Branches 0.666 0.512 Existence Time 0.903 0.149 Celebrity relevance 0.779 0.339 Literary landmarks Symbolic Type 0.685 0.097 Living Environment Type 0.517 0.148 Store Type 0.535 0.143 Route Type 0.584 0.127 Ethnic Fusion Type 0.239 0.233 Elegant Taste Type 0.177 0.252
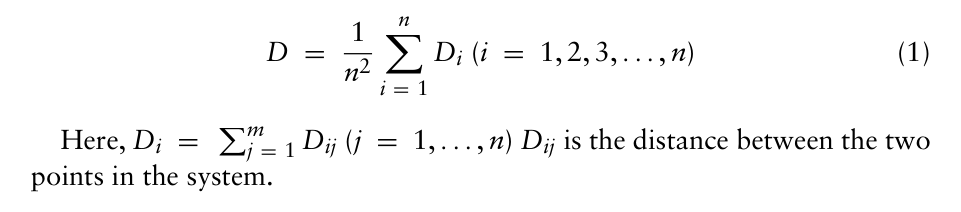
longitude of location A (LonA, LatA) and the latitude and longitude of loca- tion B (LonB, LatB), the geographic distance between each location in the system, and a specific location D, which is calculated by a distance calcula- tion formula. Analyzing the distance relationship between the collection of the urban culture value of a location in the database within a certain dista- nce and a specific point, the distribution of the value of urban culture around a specific location can be obtained. Then we visualized the urban cultural distribution patterns of specific locations.
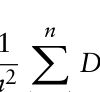
To make the urban culture distribution pattern data of a specific location more significant, combined with Beijing’s urban planning’s symmetry cha- racteristics, we use the sum of location data falling in a fixed-width circle instead of single location data. The average value of the distance between all locations in the system is obtained through calculation, and the average value is used as the interval width of the location data collection.
Equation reproduced from the original PDF.Equation reproduced from the original PDF.
Case Studies We conducted two case studies to demonstrate the exploration process of the system proposed in this paper and explain the practicality of the results of our study.
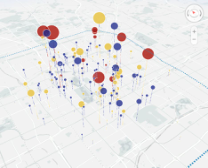
Case 1: The Discovery of Beijing Urban Culture Belt When we look down on all the data of the entire Beijing city (Fig 2.B), we can see several prominent landmark gathering areas: Although the number of locations in Region A is small, the locations’ cultural difference is quite apparent. The number of locations in area B is more massive than A, but
An Interactive Visualization System for Urban Cultural Quantitative Model 613
(A) (B)
Figure 2: Overview of Urban culture data.
the cultural value is average. In area A, the urban cultural value of a cer- tain Hutong makes an outstanding contribution to the whole. For area B, the concentrated distribution of time-honored brands indicates that it is an important business district in Beijing. Some of these areas where city culture is concentrated have more residents, and some have a more prominent busi- ness culture. When developing an urban culture in different areas, different plans can be customized for different cultural subjects. On the other hand, when we observe all landmark data in Beijing from the side (Fig 2.a), it can be seen that the cultural quantity of literary landmarks in the city is stratified significantly, and most of them are located at a lower position. This indicates little difference in the representation of urban culture among the landmarks covered by literary works, and the intensity of urban culture is lower than the other two types of places.
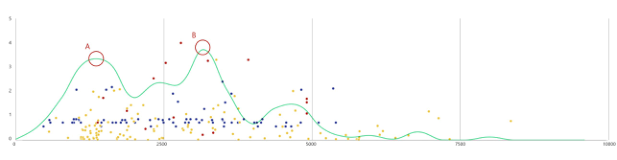
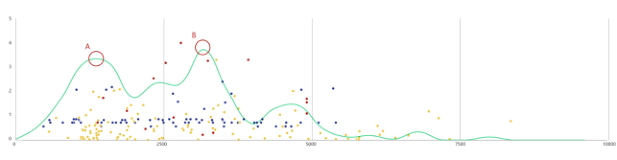
Case 2: Exploration of the Distribution Model of Urban Culture In the distance view, the location and the surrounding urban culture are displayed on a line graph. The horizontal axis represents the distance to a specific landmark, and the far left is the location of the specific landmark. The vertical axis of the line graph represents the aggregation result of the urban culture value. The higher the line’s vertex, the higher the total score of the urban culture value at this distance. The scatter chart also corresponds to different types of places in red, yellow, and blue. The height value of the point represents the urban culture value of the place. Through this figure, we can intuitively distinguish the distribution pattern of urban culture value.
Changes in Urban Culture Centered on the Political Landmark For hundreds of years, Beijing has always regarded its political center as its core function. Beijing’s urban planning also serves its status as a political cen- ter. Jingshan was built next to the Forbidden City, the political center, and is located in the very center of Beijing geographically. Therefore, we chose Jing- shan as the research object to explore the distribution pattern of urban culture in Beijing’s political center. In Fig. 3, as the distance increases, the urban cul- ture value reaches the first vertex A at 1.6 kilometers from the center, and the second vertex B appears at 3.2 kilometers from the center. According to Beijing’s urban planning study, these two vertices are just on the two core traffic loops of Beijing’s inner ring. The geographical location of the traffic arteries coincides with the prosperity of the urban culture. This phenomenon
Figure 3: A cultural distribution map of the political center.
(A) (B)
(C)
Figure 4: A cultural distribution map of the political center.
verifies the correctness of the distance algorithm used in this paper. It can be seen that although the political atmosphere and modern development have suppressed the development of urban culture in a relatively small area, this suppression has been resolved by the mobility of the city.
Three Distribution Modes of Urban Culture We have summarized three types of urban culture distribution patterns: the first type is the centralized model of urban culture. It can be seen from Fig. 4(A) that in the range closer to Xisi, the urban culture value continued to maintain a high level. This shows that the urban culture value in Xisi is signi- ficant. This is also consistent with the function of Xisi as the main traffic road and the busy commercial street in Beijing. The second type is the conventio- nal model Fig. 4(B). With Lu Xun’s former residence, Tazhuan Hutong, as the center, although the urban culture value peaked relatively short, the follow- up showed regular fluctuations. It reflects that the urban culture is evenly distributed around Tazhuan Hutong, with a relatively ordinary pattern; The third type is marginal model Fig. 4(C). Guixin Zhai is one of the time-honored brands in Beijing. It can be seen from the figure that in the vicinity of Guixin Zhai, the urban culture value keeps a very low level until the first peak appe- ars after 4.0km. Thus, it can be seen that the urban culture around Guixin Zhai is not prosperous and belongs to a place with weak urban culture.
CONCLUSION AND FUTURE WORK In this paper, a quantitative method of urban culture is studied. The quanti- tative results are visually designed to produce a visualization system of urban culture and three distribution models of urban culture to help users explore the spatial distribution characteristics and correlation of places with urban culture characteristics and multidimensional attributes.
An Interactive Visualization System for Urban Cultural Quantitative Model 615
1. Given the multidimensional attributes of the cultural landmarks of the city, an objective evaluation system was provided to effectively evaluate the urban culture value of the city in different types of places; 2. Using the distance algorithm and analyzing the results of visual display, we explored several distribution patterns of urban culture and studied the relationship between the political center in Beijing and the urban culture through case studies, verifying the rationality of the geographic algorithm; In future work, in terms of data research, we plan to introduce more attri- butes of locations in cities to meet different users’ exploration needs. In the visualization aspect, we will try to include the visual coding of the external environment related to urban culture. In terms of application, we will deve- lop distance relation algorithms from point to line and point to the region to explore more urban culture distribution patterns.
ACKNOWLEDGMENT
This study was supported by Beijing Social Science Foundation (18ZDA08).
REFERENCES
Han Lijuan. The Depiction of The Citizens’Life—a tentative analysis of Feng Lingzhi’S Beijing taste novel. Diss. 2011. Lu Qinghua, and Liu Wei. Research and Analysis for the Teaching Design Competi-
tion Based on Entropy Weight Method and TOPSIS Method. Journal of Ludong University (Natural Science Edition) 36.04(2020):312–320. Lu Wei. Five levels of Chinese culture. City culture. Five levels of Chinese culture.
City culture. Liaoning Education Press, 1993. Mao Qi. “The Digital Virtual Communication of Beijing Urban Cultural Resources: Taking Hutong and Siheyuan Cultural Communication as an Example.” Modern Communication (Journal of Communication University of China) 35.005(2013): 149–150. Qiu Guosheng. A comparative study on 20th century’s Beijing and Shanghai. 2003.
Sichuan University, PhD dissertation. Research on the Factors of Articles’ Perceived Quality in the Internet Encyclopedia from the Perspective of Cue Utilization Theory. Information Studies:Theory & Application. Wang Danyi. “Design features and advantages of new media applications in the
promotion of Beijing time-honored brands.” E-commerce Journal 000.005(2012): 30–32. Yang Baoan. Multi-objective decision analysis theory, Method and Application research. Donghua University Press, 2008. Yuanyuan Qian. The “Nostalgla” of “Beijing-style” Drama. Diss. Henan University. Zhao Botao. City Culture and Citizen Mentality. Hubei Education Press, 1996. Zhao Yuan. Beijing: City and People. Shanghai People’s Publishing House, 1991. Zhao Zhizhong. “On Folklore of “Under the Pure Red Banner”.Journal of Minzu
University of China: Philosophy and Social Sciences Edition 02(2004): 122–126.
LISTED IN THE AHFE DIGITAL BOOKSTORE CATALOGUE
Explore the complete digital volume
Ergonomics In Design
Read this individual research paper free through the original publisher, or explore the full digital proceedings book.
ISBN 978-1-958651-23-0
Explore this ISBN in the AHFE Bookstore ↗Listed in the July 2026 bookstore catalogue; search by ISBN to confirm current availability · Digital book purchase optional