Kristina Stojmenova, Grega Jakus, Sašo Tomažič, Jaka Sodnik (2022). Is less really more? A user study on visual in-vehicle information systems in automated vehicles from a user experience and usability perspective. In: Usability and User Experience. AHFE Open Access, vol. 39, pp. 449–457. https://doi.org/10.54941/ahfe1001741
Monitoring the environment is an essential part of driving, as it increases the driver's situational awareness and enables them to make appropriate decisions for safe and comfortable driving. This paper presents a study to investigate how much and in which way should information be displayed to the driver in a semi-automatic vehicle with a head-up display (HUD) to achieve optimal situational awareness. This was evaluated from two perspectives: the user's experience and perceived usability. It additionally explored the users preferences on which information should be displayed in such HUDs. For this purpose, four prototypes of a visual HUD were created, displaying different amounts of information (MIN vs. MAX) and presented in two different modes - as a two-dimensional (2D) projection on the windshield and using augmented reality (AR) to highlight the information directly in the environment. The obtained results gave a clear indication that the test participants preferred to have more information displayed on a HUD, regardless of whether it was presented in 2D or AR.
Driving is a dynamic task that involves not only operating a vehicle, but also interactions with other road participants, following traffic regulations, ada- pting to weather conditions and many more. Monitoring the environment is therefore a crucial part of driving, as it increases the driver’s situational awa- reness (knowing what is going on around you). Situational awareness (SA) plays an important role in any process of dynamic human decision making, as it provides the state of knowledge needed for making effective decisions and taking appropriate actions (Endslay, 1995). To ensure driving safety, it is necessary for drivers to still maintain a certain level of SA in any vehicle that is not fully autonomous or has Level 5 of automation as defined by the Society of Automotive Engineers (SAE, 2016). Based on the SA theory (Ends- ley, 1995), for achieving SA it is necessary to have perception on the elements of the environment (SA level 1), have a comprehension on their meaning (SA level 2) and be able to project their status in the near future (SA level 3). The three levels are set in hierarchical order, with SA level 3 being the highest.
The first level deals with perception of all relevant elements in the environ- ment, their status, attributes and dynamics. This is followed by the second level, which focuses on comprehending the environment and understanding the significance of the perceived elements and their attributes. The third and highest level of SA reflects the ability to be able to anticipate and predict the actions of the elements in the environment in the near future.
Motivation The study presented in this paper deals mainly with the first level of SA, and tries to answer two main research questions:
Research Question 1: Which, and how much information the driver is supposed to be presented during the whole drive in a semi-automated vehicle in order to maintain an appropriate level of SA and ensure highest level of perceived usability, provide best user-experience and satisfy driver’s personal preferences on in-vehicle information systems (IVIS)?
Research Question 2: How should information be presented to the driver in a semi-automated vehicle, so that they ensure highest level of perceived usa- bility, provide best user-experience and satisfy driver’s personal preferences on in-vehicle information systems (IVIS)?
METHODOLOGY
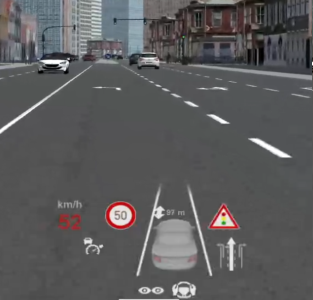
Experiment Design and Equipment We developed a visual head-up display (HUD) that intends to help the driver with the monitoring of the driving environment and maintaining appropri- ate situational awareness not only in critical situations but throughout the whole drive, in a manually or semi-automated vehicle. Four prototypes of the visual HUD were created, displaying different amount of information (MIN vs. MAX, see Table 1) and presenting in two-dimensional (2D) proje- ction on the windscreen (see Figure 1, left) and using augmented reality (AR) to highlight of information directly in the environment (see Figure 1, right).
Is Less Really More? A User Study on Visual in-Vehicle Information Systems 451
Table 1. Information presented in the four HUD prototypes.
Table available in the original PDF paper.
Information presented in HUD MIN MAX 2D AR 2D AR
✓ ✓
Speed limit visible at all times. ✓ ✓ Displays speed limit sign at each cross section 150 m before and up to 150 after the traffic/road sign.
✓ ✓
Vehicle speed visible at all times. ✓ ✓ Vehicle speed colour changes from white to red when driving over the speed limit (information on speeding).
✓ ✓
Active ADASs. ✓ ✓ ✓ ✓ Distance to vehicle in-front of ego vehicle. ✓ ✓ Distance to vehicle in-front changes from white to red when driving in TTC < 2s.
✓ ✓
Level of automation the vehicle is operating in. ✓ ✓ ✓ ✓ Displays surrounding traffic/road signs (for example bus stop, pedestrian crossing, traffic light, priority road, non- priority road, stop, etc.) 150 m before and up to 150 after the traffic/road sign.
✓ ✓
Highlights with green bounding box surrounding traffi- c/road signs with green bounding box (for example bus stop, pedestrian crossing, traffic light, priority road, non-priority road, stop, speed limit sign after each cross section, etc.)
Simple GPS directions in form of an icon. ✓ ✓ Using AR, displays GPS directions directly on the road. ✓ ✓ Short messages/email previews. ✓ ✓ ✓ ✓
The HUD was displayed throughout the whole trial regardless if the vehicle was manual or automated mode. The latter, for example, allowed the test participant to monitor the vehicle dynamics when in automated mode, which displayed that the vehicle would always drive within the speed limits and keep appropriate safety distance to the vehicle in front.
The HUDs were evaluated in a high-fidelity driving simulator (Vengust et al., 2017). The driving was completed using a vehicle with automation level 3 (SAE, 2016) and took place on a 13 km route in a city environment, which (if speed limits were followed), lasted ~16.5 minutes. The study had a within-subject design, meaning that each participant completed four trials – one with each HUD prototype.
Participants 30 participants (14 female) aged between 23 and 55 (M = 36.767, SD = 8.89) participated in the study. All of the participants had a valid driving license (driving experience M = 17.200, SD = 8.86). The participants were given written description of the study and its goals, detailed instructions about their tasks in study and information on the data collection and processing. This was followed by an informed consent, which further stated poten- tial risks and benefits participation in the study would have on the test
participants. For their participation in the study, the participants were entitled to a compensation of 10 €.
Tasks There were two main tasks in the study: operating a vehicle with automation level 3 (L3) and performing a non-driving related task (NDRT). The opera- tion of the level 3 vehicle or vehicle with conditional automation states that when operating such vehicle, the driver is a necessity but is not required to monitor the environment. However, it must be ready to take control of the vehicle at all times (SAE, 2016). In that regard, the driver’s task of operating the vehicle was to: a) drive manually when automation was unavailable, b) turn on automation when it became available and c) take over control over the vehicle when automation was no longer available.
The NDRT was playing the calculus game 2048, whose objective is to slide and combine numbers on a grid with the purpose of achieving a sum of 2048. The game was played on a mobile phone without internet connection to avoid disturbances. The score of the participants was not recorded; participants were asked to play the game as a simulation of potential activities drivers of semi-automated vehicles may engage into when in automated mode.
Variables Independent-Variables Two main independent variables were: amount (which and how many) and mode of information (presentation in 2D or AR).
Dependent-Variables In this study, three main dependent variables were observed: user experie- nce, perceived usability and personal preference. User experience scores were collected with the User Experience Questionnaire – UEQ (Laugwitz et al., 2008), and perceived usability with the System Usability Scale – SUS (Bangor et al., 2008) after each of the four trials (2D MIN, 2D MAX, AR MIN and AR MAX). Each participant completed the UEQ immediately after comple- ting the trial with a specific HUD. The questionnaire consists of 26 questions, which can be answered using a 7-point Liker scale (1 – Completely agree, 7 – Completely disagree). The answers are used to provide scores on six aspe- cts of user experience – Attractiveness, Perspicuity, Efficiency, Dependability, Stimulation and Novelty – which were analyzed with the UEQ Data Analysis Tool (UEQ, Germany).
After completing the UEQ, participants were asked to also complete the SUS for each specific HUD. The scale is often referred as a “quick and dirty” yet reliable tool for the assessment of usability of the evaluated system. It consists of 10 questions, which have been validated to be able to distinguish between a usable and unusable hardware, software, products, services and applications. The answers are provided using a 5-point Likert scale. To be consistent with the rest of the used questionnaires, in this study we used a 7-point Likert scale also for the SUS. The answers were than normalized to be able to use the scoring system developed for the 5-point scale.
Is Less Really More? A User Study on Visual in-Vehicle Information Systems 453
Table 2. UEQ scores Mean (M) and Standard Deviation (SD) for all four HUD prototypes.
Table available in the original PDF paper.
HUD 2D MIN 2D MAX AR MIN AR MAX UEQ aspect M SD M SD M SD M SD
Additionally, participants were asked to complete a user preference que- stionnaire, in which, using a 7-point Likert scale, they expressed their opi- nion on the necessity of displaying different visual information components presented in the 2D and the AR HUDs (see Table 1).
RESULTS
User Experience The UEQ scores scale ranges from −3 (horribly bad to +3 (extremely good), however because of the calculations of means the authors of the UEQ tool point out that it is extremely unlikely to get scores above +2 or below −2. Values between −0.8 and above +0.8 are considered as neutral, and scores above +0.8 represent a positive and scores below -0.8 represent a negative evaluation.
Based on the collected data, all four prototypes were rated positively for four aspects of the MIN versions and five aspects out of the six aspects for the MAX versions of the HUD prototypes. The AR MAX HUD obtained highest scores for attractiveness, perspicuity, efficiency, stimulation and novelty, whe- reas the 2D MAX HUD obtained highest score for dependability. However, there were no statistically significant differences between the scores obtained for the 2D MAX and AR MAX versions for any of the sic evaluated UEQ aspects.
The UEQ results for all the four HUD prototypes are presented in Table 2.
Percieved Usability The SUS results into scores ranging from 0-100. Despite its similarity of the scale, the final score does not represent a percentage. The score of 68 is set as a discriminatory limit – a score below 68 indicates below average, whereas a score above 68 indicates an above average perceived usability. For the evalu- ation of results collected in this study, we used a curved grading scale, which was developed by Lewis & Sauro (2018), presented in Table 3.
The obtained data for the perceived usability with SUS for the four HUDs and the corresponding grades proposed by Lewis and Sauro (2018) are pre- sented in Table 4. All four HUD prototypes were perceived to have very high levels of perceived usability, with the MAX versions obtaining the highest A+
Table 3. Curved SUS grading scale (Lewis and Sauro, 2018).
Table 4. SUS scores and curved SUS grade for all four HUD prototypes.
Table available in the original PDF paper.
HUD SUS score Grade 2D MIN 78.5 B+ 2D MAX 85.06 A+ AR MIN 79.72 A- AR MAX 85.17 A+
grade. Similarly to the UEQ scores, the perceived usability was also higher for the MAX versions, regardless of the HUD mode. There were no statistically significant differences between the 2D MAX HUD and AR MAX HUD.
Personal Preference The personal preference questionnaire was used to obtain an insight of which information participants would always like to have visible during a semi- automated vehicle in order to maintain an appropriate level of situational awareness. Participants rated different information from 1 to 7. The results are presented in Table 5.
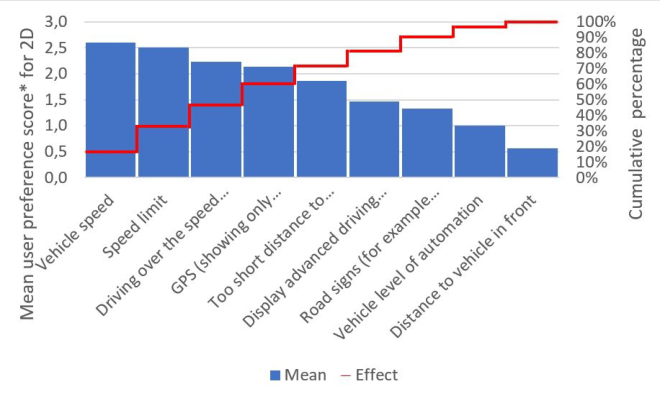
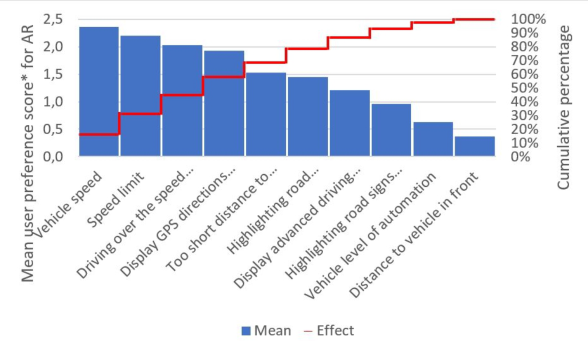
Since the scores from the Likert scale are defined as 1 – Completely disa- gree to 7 – Completely agree, values ranging from 1-3 can be considered as negative ratings, the value of 4 as neutral, and the values from 5-7 as positive ratings. Considering this, to present the actual effect of the obtained sco- res, Figure 2 and Figure 3 present the mean obtained scores, for the 2D and AR HUD respectively, after subtracting a value of four to represent only the positive ratings.
CONCLUSION
The results from all three questionnaires gave a clear indication that the test participants preferred the MAX version of the HUD which features more information, regardless of the mode they were presented in – 2D or AR. The positive ratings for each of the information featured in the HUD further sup- port the user’s preference for more information to be displayed in the HUD.
Is Less Really More? A User Study on Visual in-Vehicle Information Systems 455
Table 5. Personal preference scores obtained from a 7-point Likert scale.
Table available in the original PDF paper.
Information presented in HUD 2D HUD AR HUD M SD M SD
5.333 1.749 4.966 1.861
Vehicle speed. 6.500 1.192 6.367 1.542 Driving over the speed limit. 6.233 1.040 6.033 1.273 Speed limit. 6.500 0.731 6.200 1.400 Display ADAS which are active or available. 5.467 1.432 5.207 1.820 Vehicle level of automation. 5.000 1.640 4.633 1.938 Distance to vehicle in-front. 4.567 1.736 4.367 1.974 Too short distance to vehicle in front 5.867 1.479 5.533 1.907 Displays (2D) / Highlights (AR) surrounding traf- fic/road signs (for example bus stop, pedestrian crossing, traffic light, priority road, non-priority road, stop, etc.)
6.133 6.133 5.449 1.572
Simple GPS directions - in form of an icon (2D) / displayed on directly on the road (AR).
N/A N/A 5.931 1.646
Using AR highlight road participants, which can affect may driving
Figure 2: User preference scores on information displayed in the 2D HUD.
These results also indicate that the proposed selection of information (see Table 5) was appropriate.
The presentation of only the positive scores from the personal preference questionnaire and calculating the corresponding contribution of each piece of information to the desired effect provide an insight into which information contribute mostly to achieving higher situational awareness. Based on it, in order to obtain an effect of 80%, four pieces of information could be left in the 2D HUD and AR HUD: distance to the vehicle in front, displaying/high- lighting road signs, level of automation, and information about the advanced driving assistive systems.
Figure 3: User preference scores on information displayed in the AR HUD.
Given the importance the role of user-experience and perceived usability play in the acceptance and adoption of new technologies, the results from this study provide information, which should be considered when designing and developing in-vehicle human-computer interaction solutions for semi- automated vehicles.
ACKNOWLEDGMENT
The work presented in this paper was financially supported by the Slovenian Research Agency within the project Modelling driver’s situational awareness, grant no. Z2-3204, and the European Union’s Horizon 2020 research and innovation program for the project HADRIAN under grant agreement no. 875597. This document reflects only the authors view, the Innovation and Networks Executive Agency (INEA) is not responsible for any use that may be made of the information it contains.
REFERENCES
Bangor, A., Kortum, P. T., & Miller, J. T. (2008). An empirical evaluation of the system usability scale. Intl. Journal of Human–Computer Interaction, 24(6), 574–594. Bolstad, C. A. (2000, October). Age-related factors affecting the perception of
essential information during risky driving situations. In Human Performance Situ- ation Awareness and Automation: User-Centered Design for the New Millennium Conference, Savannah, GA. Endsley, M. R. (1988, May). Situation awareness global assessment technique (SAGAT). In Proceedings of the IEEE 1988 national aerospace and electronics conference (pp. 789–795). IEEE. Endsley, M. R. (1995). Toward a theory of situation awareness in dynamic systems.
In Human Factors Journal, 37(1), 32–64. Endsley, M. R. (2000). Direct measurement of situation awareness: Validity and use of SAGAT. In Situational Awareness (pp. 147–174).
Is Less Really More? A User Study on Visual in-Vehicle Information Systems 457
Johannsdottir, K. R., & Herdman, C. M. (2010). The role of working memory in supporting drivers’ situation awareness for surrounding traffic. Human factors, 52(6), 663–673. Laugwitz, B., Held, T., & Schrepp, M. (2008, November). Construction and evalu-
ation of a user experience questionnaire. In Symposium of the Austrian HCI and usability engineering group (pp. 63–76). Springer, Berlin, Heidelberg. 1057 Lewis, J. R., & Sauro, J. (2018). Item benchmarks for the system usability scale. Journal of Usability Studies, 13(3). Vengust, M., Kaluža, B., Stojmenova, K., & Sodnik, J. (2017, September). NERVteh
compact motion based driving simulator. In Proceedings of the 9th International Conference on Automotive User Interfaces and Interactive Vehicular Applications Adjunct (pp. 242-243).SAE, T. (2016). Definitions for terms related to driving automation systems for on-road motor vehicles. SAE Standard J, 3016, 2016. Scholtz, J., Antonishek, B., & Young, J. (2004, January). Evaluation of a humanrobot interface: Development of a situational awareness methodology. In 37th Annual Hawaii International Conference on System Sciences, 2004. Proceedings of the (p. 9). IEEE. Sirkin, D., Martelaro, N., Johns, M., & Ju, W. (2017, May). Toward measurement
of situation awareness in autonomous vehicles. In Proceedings of the 2017 CHI Conference on Human Factors in Computing Systems (pp. 405–415). UEQ online. Data Analysis Tools. Available from https://www.ueq-online.org/
LISTED IN THE AHFE DIGITAL BOOKSTORE CATALOGUE
Explore the complete digital volume
Usability and User Experience
Read this individual research paper free through the original publisher, or explore the full digital proceedings book.
ISBN 978-1-958651-15-5
Explore this ISBN in the AHFE Bookstore ↗Listed in the July 2026 bookstore catalogue; search by ISBN to confirm current availability · Digital book purchase optional