R Jordan Hinson, Amelia Kinsella, Ruth Propper (2022). So Much Information, So Little Screen Space: Assessing the usability of hierarchical data visualizations in Tableau. In: Usability and User Experience. AHFE Open Access, vol. 39, pp. 310–318. https://doi.org/10.54941/ahfe1001722
The purpose of this usability study was to determine the most effective of three ways to display hierarchical data using the interactive data visualization software, Tableau. Often, data visualizations contain large amounts of important information that users need to be able to manipulate and interpret. Viewing hierarchical data in an interactive data visualization software like Tableau has the advantage of allowing dynamic selection of the hierarchical level of detail of results displayed. This enables improved understanding and exploration of the material. However, individuals using such software do not necessarily have knowledge of a dataset and/or the data visualization software, resulting in an inability to fully investigate data relationships. It is therefore critical that research be conducted to determine which data presentation styles promote intuitive navigation within the data visualization. A within-subjects usability study was conducted to examine the most effective of three ways to display hierarchical data within a designated area of a Tableau visualization. Three distinct visualizations of hierarchical data were randomly shown to participants. Each visualization was bordered by identical contextual information with the centrally placed hierarchical data varying. One condition showed the data relying on filters. A second condition showed the data relying on users to expand and collapse the level of detail with scrolling. A third condition showed the data as a drill-down chart that only expands the level of detail selected by the user. Metrics of user-response time, the accuracy of responses to assessment questions, the subjective rank of usability for each data visualization, and open-ended user feedback were examined. Results are discussed.
The purpose of this usability study is to assess different designs to determine which portrays hierarchical data most effectively in a Tableau data visua- lization. The present study is an exploratory pilot study meant to provide insights into usability of data visualizations. Often data visualizations con- tain important information with which users need to be able to interact or
So Much Information, So Little Screen Space: Assessing the Usability 311
to interpret. When dealing with large, hierarchical datasets, the presentation of information in such a way as to promote clarity and investigation of rela- tionships is critical (Islam and Jin, 2019). Viewing hierarchical data in an interactive data visualization software, like Tableau, has the advantage of allowing the user to dynamically select the hierarchical level of detail of results displayed (Tableau, 2022). Furthermore, this type of format allows for the presentation of large amounts of information in a small screen space. However, if the end-user does not have an intimate knowledge of the dataset and/or of the data visualization software, the benefits of such a format are wasted. It is therefore important to focus on the best presentation for intuitive understanding of the data visualization which is constrained by the realistic challenge of designing within a limited screen area.
Tableau is marketed to users as relying on ‘click and drag’ programming methods, rather than as requiring intensive coding. While individuals with advanced knowledge of Tableau intricacies- called ‘Zen Masters’- may be able to produce ‘hacks’ on the software to develop highly sophisticated solu- tions for data presentation, the majority of individuals using Tableau have a much smaller skill set with the software. Therefore, the goal in the present exploratory pilot study was to limit the amount of visual and ‘programming’ complexity to examine differences between formats that would allow for a broadly applicable and accessible design solution set, with the goal, for exam- ple, that the visualizations used here could be built by those with even a limited Tableau skill set.
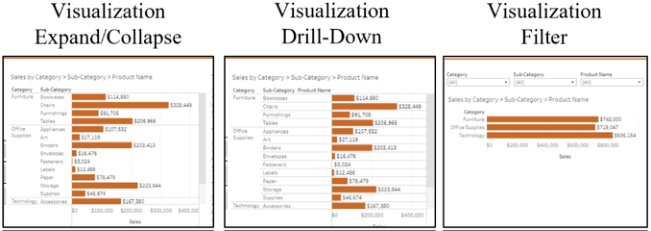
Given that screen space for the presentation of hierarchical information is limited, the current work compared differences in ‘user-friendliness’ betw- een three different forms of visualization. These three visualizations varied in the way the hierarchical data was presented. One condition utilized an expan- d/collapse functionality where participants could expand or collapse the view from category to subcategory to product name or vice versa—referred to as Visualization Expand/Collapse (VE/C). The second condition utilized a drill- down functionality where participants could select a specific sub-category to expand or collapse—referred to as Visualization Drill-Down (VD-D). The third condition utilized filters, where participants could select speci- fic categories, subcategories, and product names to view with a drop-down filter—referred to as Visualization Filter (VF).
It was hypothesized that the drill-down design (VD-D) would be preferred from both a performance and subjective perspective because of its ability to only display a select subset of data—less scrolling—as opposed to showing the entire data set—more scrolling (Reddish, 2007). Also, this method did not require users to locate controls for expanding and collapsing; rather, it always kept the headers for each column in the hierarchy visible (Norman, 1990).
METHODS
Participants The research was approved by a local IRB and followed all ethical responsibi- lities and requirements as directed by the Declaration of Helsinki. 18 partici- pants (8 female) between the ages of 27 – 67(M = 41.06 ± 12.5) participated.
Figure 1: Three visualization conditions, cropped to show design differences.
Participants were recruited via convenience and snowball sampling through word of mouth and email from a small business office. Participant requi- rements included access to a laptop or desktop computer with a wireless internet connection and web camera.
Materials
Materials consisted of 3 different Tableau data visualizations (Figure 1). The Visualizations can be accessed at the following hyperlinks:
VF: https://public.tableau.com/app/profile/jordan.hinson/viz/SuperstoreS alesTestCaseC/Dashboard3 The three designs relied on Tableau’s built-in functionality. As an addi- tional constraint, limited screen space was designated for each design to represent a common use case for presenting multiple data visualizations in one dashboard. Specifically, 25% (500-by-400-pixel area) of the area of a standard Tableau desktop browser (1000-by-800-pixel layout) was used for the variable data visualizations. Visualization functionality outside of this designated area remained consistent across all three Visualizations. To avoid prior user knowledge of an existing data set, a pseudo dataset down- loaded from Tableau online was used. A three-minute demonstration video showcasing different Tableau visualization functionalities was also constru- cted. Lastly, demographic questions, a technology-use survey, and factual questions, all of which were created for this present purpose, were also used. Additionally, two Likert-type subjective assessment questions asking about the user’s experience with each of the Visualizations and ranked user preference with open-ended feedback were used.
Procedure Participants were tested individually using the remote application Zoom. Two researchers were present during the meeting; the “Recorder” collected all data, the “Researcher” facilitated the study.
So Much Information, So Little Screen Space: Assessing the Usability 313
After obtaining consent, the Researcher gave participants an overview of the study. Participants were verbally asked survey questions. Next, par- ticipants watched the demonstration video. The Researcher then sent the participant a link within the Zoom chat to one of the Visualizations (quasi- randomization determined the order each participant viewed the visualiza- tions). Participants ‘shared’ their screen with Visualizations in full-screen mode so cursor movements could be observed. The Researcher and Recor- der disabled their cameras during this part of the study, while the participant remained on camera.
Each participant had 90 seconds to familiarize themselves with the Visua- lization, then they were told they would be asked three questions they should use the Visualization to answer. They were assured that there were no right or wrong answers and that only the usability of each Visualization was being assessed, not their performance.
After the familiarization period, the Researcher started a timer and asked participants three factual questions based on the specific information pre- sented in the Visualization. Two of the questions required participants to directly interact with the central view displaying the hierarchical data. The third question could be answered using either the central view or one of the secondary views. After the participant answered the third factual question, the Researcher stopped the timer and recorded response time. Participants then answered two Likert-type subjective questions based on the usability of the view. This process was repeated for all three visualizations.
Lastly, participants were asked to rank the three Visualizations on ease of use. Participants were asked to perform a think aloud during the experiment and were given the option to provide open-ended feedback at the end of the experiment.
Analyses A within-subjects experimental design, with three levels of Tableau Visuali- zation, was used. Dependent measures consisted of response accuracy and response time to objective questions, and survey responses, which were exa- mined per Visualization. The sample size and number of questions were not large enough to sufficiently power parametric analyses for all research questions. Therefore, descriptive data are reported.
RESULTS
Participant Demographics All participants indicated they use a computer at least a few days per week. To further understand computers experience, participants provided the number of keyboard shortcuts known. Three (16%) participants knew more than 10 keyboard shortcuts and 10 (56%) participants knew less than five keyboard shortcuts. Eleven participants (61%) had experience with Tableau or a simi- lar data visualization software. Finally, 12 (67%) participants had frequent experience interpreting data sets.
Table 1. Average of accuracy and average response time for each visualization.
Table available in the original PDF paper.
Average Accuracy Average Response [number of correct responses] Time [seconds] VE/C M = 2.28, SD = .75 M = 145.4, SD =65.2 VD-D M = 2.39, SD = .78 M = 119.8, SD = 47.8 VF M = 1.9, SD = 1 M =160.1, SD = 65.7
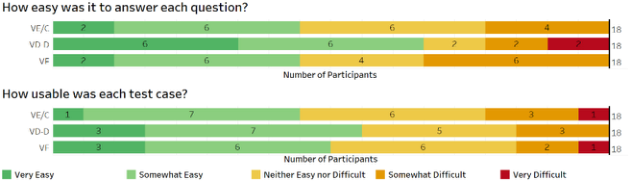
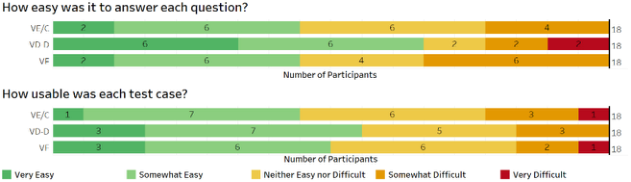
Figure 2: Subjective usability ratings for each visualization.Figure 3: Visualizations by Rank.
Objective Test Performance Accuracy: Table 1 shows average number of correct responses and ave- rage response time in seconds by Visualization. VD-D resulted in the most correct answers and the least incorrect answers compared to the other visualizations.
Response Time: Numerically, VD-D had the shortest average response time, with 119.8 seconds on average to answer all three quiz questions. VE/C had the second-fastest response time with an average of 145.4 seconds and VF had the longest response time with an average of 160.1 seconds (Table 1).
Subjective Questions Usability Questions: Figure 2 shows the subjective usability ratings for each visualization. Overall, although parametric tests were not conducted, VD-D was most frequently rated easy or very easy.
Overall Ranking: Figure 3 shows rankings of preference for each visuali- zation. Overall, although parametric tests were not conducted, VD-D was ranked “easiest” by the most participants.
Exploratory Analysis: How do user Experience and Performance Relate?
Experience Scores were calculated for each participant based on responses to demographic questions (Table 2). Tableau experience was weighted more than the other responses since it was a highly relevant experience that could
So Much Information, So Little Screen Space: Assessing the Usability 315
Table 2. Experience score calculation.
Table available in the original PDF paper.
Interview Questions and Experience Score Point Values(pts) Assigned Per Response D4. Have you ever used Tableau or interactive software for data visualization? Yes (5 pts), No (0 pts) D5. How often do you work with data visualizations? Never (0 pts), Once a month (1 pts), Once a week (2 pts), A few days per week (3 pts), Everyday (4 pts) D6. How many keyboard shortcuts do you know by memory? 0-5 (0 pts), 6-10 (2 pts), >10 (4 pts) D7. How often do you use a laptop or desktop computer? Never (0 pts), Once a month (1 pts), Once a week (2 pts), A few days per week (3 pts), Everyday (4 pts)
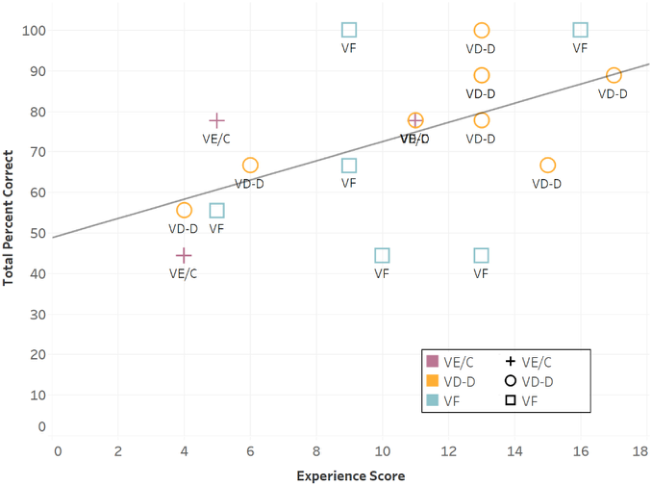
Equation reproduced from the original PDF.Figure 4: Correlation between Accuracy [Total Percent Correct] and Experience Score of participants. For each participant, the preferred—easiest to use—visualization is labeled.
likely provide a performance advantage to participants. The other question responses were assigned weights that at face value would further distinguish experience differences. Scores could range from 0 to 17.
Collapsing across Visualization, Experience Scores were correlated with accuracy (Figure 4). Accuracy here was calculated as Total Percent Correct (TPC). Experience Scores and TPC were positively correlated, r(16) = .52, p < .05.); increased experience was associated with increased accuracy.
Table 3. Participant Comments and Researcher Observations.
Table available in the original PDF paper.
Negative Comments/Observations
Visualization Positive Comments/Observations
-Expand/collapse buttons were difficult to find for many participants (many partici- pants clicked on the words or bars because they could not locate +/- buttons leading to frustration). -Design requires scrolling through many
VE/C -Straightforward functionality with fewer options/distractions helped participants learn functionality -simple, not overwhelming to look at
-Some participants had trouble reversing the drill-down functionality. -Some participants expressed the desire
records that might not be of interest. This is time-consuming and can lead to mistakes VD-D -Some participants appreciated the ability to only drill down to a specific sub-category in the hierarchy.
-Requires users to understand expand/col- lapse and filter functionality to properly view hierarchy; if participants were not paying close attention to the filters, they were often led to believe they were view- ing a different sub-category than the one showing. -Some participants were confused by
to aggregate the data at a higher level than the design allowed. VF -Some participants enjoyed the additional filtering functionality and liked being able to choose what data to display. -Some participants appreciated the ability to only filter to a specific category or sub-category in the hierarchy.
filter use, e.g., filters do not intelligently reset at the lower level when changed at the higher level in the hierarchy, resulting in no data displaying.
User Comments and Researcher Observations
Table 3 represents a combination of participant comments and researcher observations obtained through the think-aloud method and open-ended questions.
DISCUSSION
Overall, there is a clear preference for VD-D. VD-D had the highest ave- rage number of correct responses for factual questions, the fastest average response time, the highest average subjective usability ratings, and was ranked “easiest” the most.
VD-D VD-D employed the drill-down functionality where users click on either a word or mark in a specific hierarchical level to reveal an additional level of detail to a subset of that specific word or mark. Subsequently, clicking on that same word or mark will reverse the drill-down function. Building this functi- onality in Tableau may require an intermediate knowledge of the software.
So Much Information, So Little Screen Space: Assessing the Usability 317
Table 4. Design considerations for each Visualization.
Table available in the original PDF paper.
Visualization Design Considerations VE/C -Include clear instructions explaining where the +/- buttons are located. -Supply additional orientational cues that display where in the hierarchy the user has navigated. -Include additional cues to indicate the hierarchy is expandable. -Apply to use cases where data needs to be aggregated at every level of the hierarchy. VD-D -Include clear instructions for how to drill-down and reverse the drill-down function. -Apply to use cases where designers have at least intermediate Tableau experience as this design requires advanced techniques to build. VF -Demonstrate how to use the functionality of filters in combina- tion with the expand/collapse feature. -Include additional cues to indicate the hierarchy is expandable. -Apply to use cases where users may prefer to view data in different ways.
As previously described, this Visualization resulted in superior performance (objective and subjective). Half of the participants ranked VD-D as “easiest” (50%), only a few ranked it “second easiest” (11.1%), and some participants ranked it “most difficult” (38.9%). It also received a few subjective ratings of “very difficult” (5.6%). While these results suggest this design can be diffi- cult for some users, data and feedback associated with this Visualization was mostly positive. To accommodate more users, this Visualization may benefit from clear instructions.
VE/C VE/C employed Tableau’s default functionality of expanding and collapsing hierarchical data. While some users appreciated the simplistic design, it requi- red users to locate both “plus” and “minus” buttons which proved difficult for many participants. This Visualization also required participants to scroll through the expanded data to the appropriate section of the graph. VE/C was most frequently ranked as “second easiest” (55.6%). Fewer than half of the subjective ratings for this Visualization were “somewhat easy”or “very easy” (44%). While this Visualization had fewer visual elements to interact with, the simplistic design fell short of receiving a majority of positive usability ratings.
VF VF combined Tableau’s default functionality of expanding and collapsing data with drop-down filters. This allowed users to show more or less data based on their preferences. VF was evenly split in rank, with a third of partici- pants ranking it easiest, a third ranking it second easiest, and a third ranking it most difficult. Participants also had the longest response time for answering
questions when viewing VF. Using the filters at different levels of the hiera- rchy was not intuitive for all participants and some participants had trouble displaying the appropriate sub-category. When using this design, it is impor- tant to include clear instructions and potentially train participants how to use the Visualization so mistakes are avoided.
Design Considerations Since there is no “one-size-fits-all” solution, different Visualizations may be more appropriate for specific situations. Table 3 shows some design considerations for each visualization.
ACKNOWLEDGMENT
The authors would like to acknowledge Fort Hill Group for funding this research and allowing the authors to reach out to their employees for participation.
REFERENCES
Islam, M. and Jin, S., 2019, November. An Overview of Data Visualization. In 2019 International Conference on Information Science and Communications Technologies (ICISCT) (pp. 1–7). IEEE. Norman, D. A. (2013) The design of everyday things. London, England: MIT Press. Reddish, J., 2007. Letting go of the words. Tableau.com. (n.d.). Create Hierarchies. [online] Available at: https://help.tableau.com/current/pro/desktop/en-us/qs_hierarchies.htm [Accessed 13 Feb. 2022].
LISTED IN THE AHFE DIGITAL BOOKSTORE CATALOGUE
Explore the complete digital volume
Usability and User Experience
Read this individual research paper free through the original publisher, or explore the full digital proceedings book.
ISBN 978-1-958651-15-5
Explore this ISBN in the AHFE Bookstore ↗Listed in the July 2026 bookstore catalogue; search by ISBN to confirm current availability · Digital book purchase optional