Chunzhu Mi (2022). Colormap-Based Effectiveness of Basic Visualizations. In: Usability and User Experience. AHFE Open Access, vol. 39, pp. 405–413. https://doi.org/10.54941/ahfe1001735
When designing visual charts, effective color coding can help users access data information faster and more accurately. Colormaps are a commonly used method for scalar data visualization,which are usually designed using algorithmic techniques. However, the effectiveness of colormaps in mapping data to colors in visualization charts is not clear at present. In order to evaluate the effectiveness of colormaps application in visualization charts, this paper takes four basic visualization charts (bar chart, pie chart, scatter chart, and line chart) as the research object, and takes task completion time and accuracy rate as the index, quantitatively analyzing the application of blue, coolwarm, viridis, and jet in visualization charts. In addition, the Likert scale method was used to understand the subjective perception of users of the color maps.The results showes that the use of different colormaps had no significant effect on the participants' response time and correctness in completing the bar chart task, and a very significant effect on the pie and scatter charts. Participants were most accurate and took the shortest time on the graphs coded with viridis. The longest time was spent on the chart coded with blue and the accuracy was lower. The results of the Likert scale assessment showed that users found blue to be the least easy to read and the least aesthetically pleasing, and jet to be the most aesthetically pleasing and easy to read.
When people obtain information from visual diagrams, they first perceive the information through the visual system and then encode and form a perce- ption (Ma, 2019). One-dimensional encoding of visual information includes shape, color, size, angle, motion, position, and texture. Among them, color coding is one of the most commonly used coding methods and more pow- erful (Schloss et al., 2019; Shen, 2019). Kard, Mackinlay and Scheiderman indicated that a good application of colormaps in visualization can improve the efficiency and effectiveness of people’s perception of data , while inappro- priate colormaps can cause human perception errors and thus misinterpret data (Zhou and Hansen, 2016). Karim et al. (2019) investigated the use of colormaps in network visualization. The results showed that participants had faster response times when completing visualization tasks encoded with blue compared to viridis, RdYlBu, and jet. In addition, there were significant diffe- rences in accuracy using different colormaps, with users completing the task encoded in viridis being the least error-prone compared to blue, RdYlBu, and
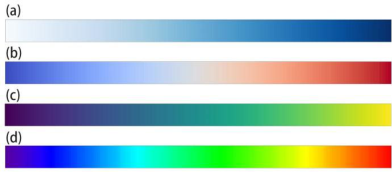
Figure 1: The color map used in the study. (a) blue (b) coolwarm (c) viridis (d) jet.
jet. Schloss et al. (2019) investigated the effect of background color on color quantity mapping in color map visualization design. The results showed that the effect of the background on the user’s inferred color quantity mapping depends on the transparency variation in the visualization map. When there is no change in color opacity, the inferred mapping is ‘dark-more’encoding regardless of the background. However, as opacity changes increase, the inferred mapping is increasingly influenced by anopaque-is-morebias. Zhang et al. (2021) studied the application of colormaps in industrial tomography. The results showed the highest accuracy of completing the task in MWT using autumn, virids and parula coding. Tominski, Fuchs and Schumann (2008) investigated the task-based selection of colormaps by applying diffe- rent color scales and introducing histogram equalization and Box-Whisker plot adaptation to improve the color distribution in certain visualization tasks. Although many scholars have investigated the application of colormap in various visualization types, few have studied the application of colormap in basic visualization diagrams.
Based on the work of Lee, Kim and Kwon (2017), Huang, Huang, T. and Zhang (2009) and others, as well as the research on the commonly used visualizations in some visualization tools (Microsoft Excel, Matlab, dych- art, hanabi, Adobe Analytics, etc.), four basic visualizations are incorporated into the study in the paper, including bar graphs, pie charts, scatter plots.
There are many types of colormaps, and each type contains multiple color- maps. For example, viridis, plasma, autumn, coolwarm, etc. Among them, single-hue, multi-hue, divergent, and rainbow ramps represent four types of traditional color map color design families (Reda and Szafir, 2021). In this paper, one representative color scheme is selected from each of these four categories, namely blue, coolwarm, viridis, and jet. As shown in Figure 1.
The use of colormaps depends not only on the data but also on the tasks they perform (Zhou and Hansen, 2016). Amar, Eagan and Stasko (2005) proposed 10 low-level analysis tasks based on various analysis problems that people usually encounter when reading visual data, including finding anomalies, finding clusters, finding correlations, calculating derived values, characterizing distributions, finding extremes, filtering and filtering, sorting, determining ranges, and retrieving values. Saket, Endert and Demiralp (2019) evaluated the effectiveness of five basic visualization types in five size datasets through crowdsourcing experiments based on a set of ten low-level analysis tasks proposed by Amar et al. The results showed that different visualization
Colormap-Based Effectiveness of Basic Visualizations 407
types showed significant differences in different analysis tasks. It is also pointed out that bar graphs are most suitable for cluster finding tasks, scatter plots are suggested to find outliers, and line graphs are used to find correlati- ons. Few (2009) suggests the use of basic visualization charts based on data type representations. He states that to show the proportion of a certain data to the overall, a pie chart is recommended. In order to reduce the cognitive load that the experimental task brought to participants, the impact of color- maps will be studied in the paper based on the task for which each type of chart is most appropriate. For example, participants are made to perform a cluster finding task in a bar chart, an outlier finding in a scatter chart, and a sorting task in a pie chart. In addition, the paper will use a 5-point Likert scale to understand users’ subjective evaluation of the use of color- maps, asking participants to rate the data legibility and color aesthetics of different colormaps.
METHODS
Participants There were 20 participants in this experiment, 11 males and 9 females. Their ages ranged from 23 to 29 years old, with an average age of 25 years old, with no color blindness and all having a corrected visual acuity of 1.0 or higher in both eyes. All participants had experience working with visual graphs, mostly using Microsoft Excel and Powerpoint, and five of them were design majors.
Stimuli First, the data set for the visualization design needs to be selected. In order to improve the efficiency of the experiment as well as to avoid experimen- tal errors caused by individual differences, we chose data types familiar to users. By querying the lists of major search sites (e.g., Baidu, Google, 360 web pages, etc.), five categories were selected from the types of information that the public is most concerned about, namely, film and television, music, economy, automobile, and winter Olympic medals. A portion of each dataset was then made into a questionnaire and distributed to 12 trial participants, including 7 females and 5 males. The participants were asked to select the most familiar type of data in the questionnaire, and six of them chose film and television and four chose music. Therefore, music-related data sets, such as music chart rankings, music genres, etc., were used in the exercise part of the experiment. Film and television related data sets, such as movie bud- gets, box office, etc., were used in the formal experimental part. In a study by Saket, Endert and Demiralp (2019) on visualization charts based on data points, it was concluded that too many data points led to an increase in stress for the subjects and took more than 2 minutes to complete the task. The size of the data points in the charts in this experiment was controlled to five, which was consistent with the daily use scenario and did not make the sub- jects feel information anxiety. In these visual charts, each visual marker (e.g., a bar in a bar chart) represents a data point.
408 Mi
After the data set was selected, each type of chart was colored sepa- rately using blue, coolwarm, viridis, and jet. In the bar chart, a set of monochromatic codes (all bars in one color) was added to serve as a control group. In the formal experiment, each participant saw a total of 17 samples, including 5 bar charts, 4 pie charts, 4 scatter charts, and 4 line charts. The color map coloring of the scatterplots was sampled using matlab from an inverse tangent curve with normal sampling noise added. The color sampling in the bar, pie, and line graphs comes from discretizing the arc-tangent curves into 5 storage cells corresponding to 5 colors for each colormap.
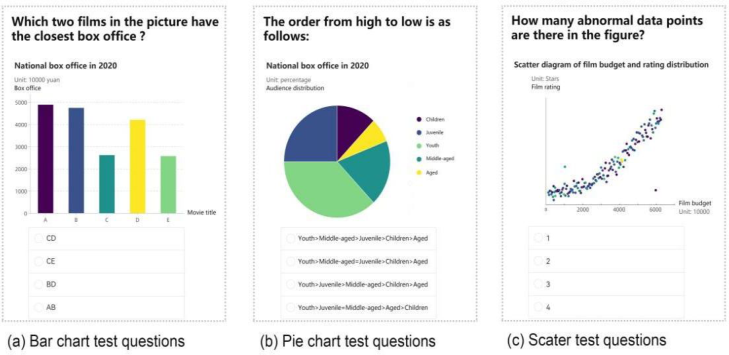
Procedure The entire experiment was conducted in a quiet, evenly lit laboratory. Before the experiment started, personal information of the subjects, such as age, gender, and experience in dealing with visualization charts, was first colle- cted, and then a color vision deficit test was performed with Ishihara plates. After the test, participants were asked to read the experimental instructions, informing them of the purpose of the study and the experimental task. Then practice experiments were conducted. After completing the practice experi- ment, a one-minute break was taken and the formal experiment was started. During the training portion and the formal experiment, questions about the visualization chart were presented on the screen and participants were asked to answer the experimental questions as quickly and accurately as possible. Screenshots of some of the experiments are shown in Figure 2.
The set task for the bar chart was to find clusters, asking participants to combine similar items together. The question posed in the text based on the movie dataset was, “Which two movies in the graph are closest to each other in terms of box office?”
The set task for the pie chart is ranking, which asks participants to rank the data based on percentages. For example, “What is the order of movie box office from highest to lowest?”
Scatter plots have a task that asks participants to identify any anomalies in a given data set. For example, “How many anomalous data points (points that are out of clusters) are in the graph?”
The task of a line chart is to find correlations and asks participants to deter- mine if there is a correlation between the variables in the graph. For example, “Do you think that movie cost and movie box office are correlated?”
Finally, participants were asked to rate the ease of reading and aesthetics of the data resulting from each type of color map coding from 1 to 5. A score of 1 was the worst, being extremely difficult to read or extremely aesthetically pleasing; a score of 5 was the highest, representing extremely easy to read or extremely aesthetically pleasing.
RESULTS
Task Completion Time The mean time for participants to complete each task was statistically 7.84 seconds. A repeated measures ANOVA test showed that the color
Colormap-Based Effectiveness of Basic Visualizations 409
Figure 2: Screenshots of the three trials used in this experiment.
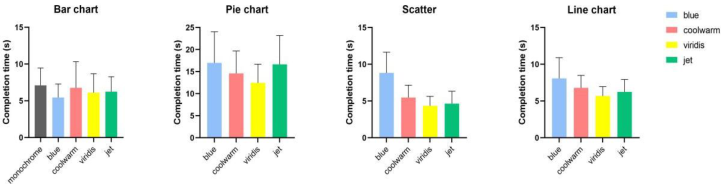
map had no significant effect on task completion time for the bar chart (p = 0.19>0.05), a statistically significant effect on the pie chart (p = 0.032<0.05), an extremely significant effect on the scatter (p = 0.000), and a statistically significant effect on the line chart (p= 0.042<0.05).
The results after correction using Bonferroni showed that in the bar chart, the longest time was spent when using monochrome coded colors, compa- red to blue, coolwarm, viridis and jet in the color map, with an average task completion time of 7.12 s. The shortest time was spent when using blue coded colors, at 5.45 s. The completion times from high to low were solid color>coolwarm>jet>viridis>blue.
In the pie chart, the chart coded in blue took the longest time, 16.99s. jet took longer time, and the difference between jet and blue was not signifi- cant. viridis took the shortest time, 12.46s. completion time was ranked as blue>jet>coolwarm>viridis.
In the scatter plot, participants spent the longest time in the blue chart, 8.83s. the shortest time in the viridis, 4.36s. the jet spent slightly more time than the viridis, 4.64. completion time was ranked as blue>coolwarm> jet>viridis.
In the line chart, using the blue code consumed the longest time for par- ticipants, 8.01s. viridis took the shortest time, 5.67s. completion time was ranked as blue>coolwarm>jet>viridis.
Among the four types of charts, participants spent the shortest time in the scatter chart and the longest time in the pie chart task, which was much longer than the other charts. the average time spent in the bar chart was 6.34s, in the pie chart was 12.13s, in the scatter chart was 4.66s, and in the line chart was 6.78s.
Correct Rate Overall, the average correct rate for the tasks in this experiment was 73.87%. The repeated measures ANOVA test showed that the color map had no
410 Mi
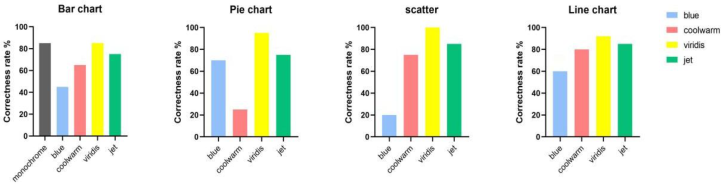
Figure 3: The average completion time of the visualization chart task in this experiment.Figure 4: The correct Rate of the visualization chart task in this experiment.
significant effect on the correctness of the bar chart (p = 0.13>0.05), an extremely significant effect on the pie chart (p = 0.001), on the scatter plot (p = 0.000), and a significant effect on the line chart (p = 0.036).
After Bonferroni’s post-test, the bar chart showed that using solid color coding and viridis had the highest accuracy rate of 85%, and using blue was the most error-prone, with an accuracy rate of 45%. The accuracy was ranked as solid color coding=viridis>jet>coolwarm>blue.
In the pie chart, using viridis has the highest accuracy rate of 95%. The dif- ference between the accuracy of blue and jet is not significant. The accuracy ranking is viridis>jet>blue>coolwarm.
In the scatter plot, the highest accuracy rate of 100% was achieved with viridis. The lowest accuracy rate was 20% using blue. The accuracy ranking is viridis>jet>coolwarm>blue.
In the line chart, the highest accuracy rate was 92% with viridis. The lowest accuracy rate was 60% using blue. The accuracy ranking is viri- dis>jet>coolwarm>blue.
Data Legibility and Color Aesthetics The cumulative variance explained value of the data legibility and color aesth- etics scales was 74.98% with good validity level by Bart’s sphericity test. In the reliability test, the Cronbach alpha value was 0.899, which was greater than 0.8, and the data had a good level of reliability.
The results showed that the color map had a significant effect on data legibility (p = 0.001) and aesthetics (p = 0.026). blue had the lowest mean legibility score of 2.8. jet had the highest legibility score of 3.85. The ranking of legibility from highest to lowest was jet>viridis>coolwarm>blue.
Colormap-Based Effectiveness of Basic Visualizations 411
In terms of aesthetics, blue had the lowest average score of 2.95. jet had the highest aesthetics score of 3.65. Aesthetics were ranked from highest to lowest as jet>viridis>coolwarm>blue.
DISCUSSION
The results of the aggregation of visualization types showed that blue was the most time-consuming color coding method compared to the other 3 color- maps, while viridis had the highest accuracy and took the least time. In the Likert scale assessment, blue had the worst legibility and lowest aesthetics, while jet had the highest aesthetics and was the most legible. This is in line with the discriminatory ability rainbow>viridis>coolwarm as indicated by Roxana (Bujack et al., 2018).
The statistical results showed no significant effect of colormaps on the response time and correctness of bar charts, which may be due to the fact that bar charts are a basic visualization method that people often use in report analysis (Huang, Huang and Zhang, 2009). Based on experience, people are more familiar with how to read the data in a bar chart and are therefore less affected by colormaps. Among the bar charts, monochromatic coding took the longest time but also had the highest accuracy rate, probably due to the fact that solid colors do not differentiate in hue, lightness, and purity to provide users with a color gap reference, so it took longer, but at the same time participants were more focused on the variation in the shape of the subject of the bar chart itself, resulting in a higher accuracy rate.
Among the pie, scatter and line graphs, blue takes the longest time and has a lower accuracy rate. This may be due to the low sensitivity of the human eye to perceive different gray levels (Pizer, Zimmerman, 1983), which prevents an efficient color-to-data mapping.
Viridis takes the shortest time and has the lowest error rate, probably because viridis color changes are sequential and progressive, from cool to warm in hue and from low to high in purity, and users are more familiar with this pattern of change and thus are more accurate in associating colors with data. Previous studies have also found that viridis performs better in terms of accuracy (Liu and Heer, 2018; Karim et al., 2019).
Jet has the second highest accuracy rate, which conflicts with some pre- vious studies (Spence, Kutlesa and Rose, 1999; Borkin et al., 2011; Bryant et al., 2014), suggesting that the same colormaps have different validity in different visualization domains. coolwarm also takes longer and is less cor- rect, which may be related to the color characteristics of coolwarm, which goes from high to low in brightness from blue to gray, and then from gray to red making the brightness higher. Such changes are not sequential and linear, and the multidimensional changes confuse the user about color distances.
The results of the Likert subjective scale assessment indicate that jet is the most readable and aesthetically pleasing, which may be due to the extremely high purity and brightness of the color pickup in jet, which captures people’s attention more easily. However, jet was not as good as viridis in the accuracy and completion time assessments, suggesting that the perceived legibility of the user and the actual results do not necessarily coincide. blue was the least
412 Mi
legible and aesthetically pleasing, which is consistent with the findings obtai- ned in the bar and scatter charts. It shows that blue is not used in visual charts in accordance with people’s perception system.
CONCLUSION
The purpose of this paper is to explore the effectiveness of colormaps in mapping data to colors in basic visualization charts. Four basic visualization forms were evaluated by recording the response time, correctness rate and Likert’s subjective scale of the task. The results showed that in bar charts, the use of different colormaps did not have significant differences in the efficiency of task completion.When doing sorting tasks in pie charts, finding exceptions in scatterplots, and finding in line charts, viridis is the most effective, which means it has the highest accuracy and takes the shortest time. blue takes the longest time and has a lower accuracy.In the subjective evaluation test, blue has the worst legibility and aesthetics, and jet has the highest legibility and aesthetics. Based on the above findings, it is recommended to give preference to multi-tone over monochrome when doing color design for visual charts, and to minimize the application of blue in visual charts. In particular, avoid using blue when doing the task of finding anomalies in scatter diagrams.
REFERENCES
Amar, R., Eagan, J. and Stasko, J. (2005). ‘Low-level components of analytic activity in information visualization’, in IEEE Symposium on Information Visualization, 2005. INFOVIS 2005. IEEE Symposium on Information Visu- alization, 2005. INFOVIS 2005., Minneapolis, MN, USA: IEEE, pp. 111–117. doi:10.1109/INFVIS.2005.1532136. Borkin, M. et al. (2011). ‘Evaluation of Artery Visualizations for Heart Disease
Diagnosis’, IEEE Transactions on Visualization and Computer Graphics, 17(12), pp. 2479–2488. doi:10.1109/TVCG.2011.192. Bryant, B. et al. (2014). ‘Usage of color scales on radar maps’, Journal of Operational Meteorology, 2(14), pp. 169–179. doi:10.15191/nwajom.2014.0214. Bujack, R. et al. (2018). ‘The Good, the Bad, and the Ugly: A The- oretical Framework for the Assessment of Continuous Colormaps’, IEEE Transactions on Visualization and Computer Graphics, 24(1), pp. 923–933. doi:10.1109/TVCG.2017.2743978. Few, S. (2009). ‘Now You See It: Simple Visualization Techniques for Quantitative
Analysis’, Distribution, p. undefined-undefined. Huang, M.L., Huang, T.-H. and Zhang, J. (2009). ‘TreemapBar: Visualizing Additional Dimensions of Data in Bar Chart’, in 2009 13th International Confere- nce Information Visualisation. 2009 13th International Conference Information Visualisation, IV, Barcelona, Spain: IEEE, pp. 98–103. doi:10.1109/IV.2009.22. Kard, S.T., Mackinlay, J.D. and Scheiderman, B. (1999). ‘Readings in Information
Visualization, Using vision to think’, p. 14. Karim, R.M. et al. (2019). ‘A Study of Colormaps in Network Visualization’, Applied Sciences, 9(20), p. 4228. doi:10.3390/app9204228. Lee, S., Kim, S.-H. and Kwon, B.C. (2017). ‘VLAT: Development of a Visualiza-
tion Literacy Assessment Test’, IEEE Transactions on Visualization and Computer Graphics, 23(1), pp. 551–560. doi:10.1109/TVCG.2016.2598920.
Colormap-Based Effectiveness of Basic Visualizations 413
Liu, Y. and Heer, J. (2018). ‘Somewhere Over the Rainbow: An Empirical Assessment of Quantitative Colormaps’, in Proceedings of the 2018 CHI Confere- nce on Human Factors in Computing Systems. CHI ‘18: CHI Conference on Human Factors in Computing Systems, Montreal QC Canada: ACM, pp. 1–12. doi:10.1145/3173574.3174172. Reda, K. and Szafir, D.A. (2021). ‘Rainbows Revisited: Modeling Effective Color-
map Design for Graphical Inference’, IEEE Transactions on Visualization and Computer Graphics, 27(2), pp. 1032–1042. doi:10.1109/TVCG.2020.3030439. Saket, B., Endert, A. and Demiralp, C. (2019). ‘Task-Based Effectiveness of Basic Visualizations’, IEEE Transactions on Visualization and Computer Graphics, 25(7), pp. 2505–2512. doi:10.1109/TVCG.2018.2829750. Schloss, K.B. et al. (2019).’Mapping Color to Meaning in Colormap Data Visua-
lizations’, IEEE Transactions on Visualization and Computer Graphics, 25(1), pp. 810–819. doi:10.1109/TVCG.2018.2865147. Spence, I., Kutlesa, N. and Rose, D.L. (1999). ‘Using color to code quantity in spatial displays.’, Journal of Experimental Psychology: Applied, 5(4), pp. 393–412. doi:10.1037/1076-898X.5.4.393. Tominski, C., Fuchs, G. and Schumann, H. (2008). ‘Task-Driven Color Coding’,
in 2008 12th International Conference Information Visualisation. 2008 12th International Conference Information Visualisation (IV), London, UK: IEEE, pp. 373–380. doi:10.1109/IV.2008.24. Ma, X. (2019), ‘Study on the dynamic presentation strategy of releva- nce of big data information’, M.S., Southeast University. Available at: https://kns.cnki.net/KCMS/detail/detail.aspx?dbcode=CMFD&dbname=CM FD202001&filename=1020801421.nh&v=. Pizer , S., Zimmerman, J. (1983). “Color display in ultra-sonography,” Ultrasound Med. Biol, 9(4), pp. 331–34. Shen, Z. (2019). ‘Study of visual cognitive behavior patterns in informa- tion visualization interfaces’, M.S., Southeast University. Available at: https://kns.cnki.net/KCMS/detail/detail.aspx?dbcode=CMFD&dbname=CM FD202001&filename=1020612020.nh&v=. Zhang, Y. et al. (2021). ‘Affective Colormap Design for Accurate Visual Comprehension in Industrial Tomography’, Sensors, 21(14), p. 4766. doi:10.3390/s21144766. Zhou, L. and Hansen, C.D. (2016). ‘A Survey of Colormaps in Visualization’, IEEE
Transactions on Visualization and Computer Graphics, 22(8), pp. 2051–2069. doi:10.1109/TVCG.2015.2489649.
LISTED IN THE AHFE DIGITAL BOOKSTORE CATALOGUE
Explore the complete digital volume
Usability and User Experience
Read this individual research paper free through the original publisher, or explore the full digital proceedings book.
ISBN 978-1-958651-15-5
Explore this ISBN in the AHFE Bookstore ↗Listed in the July 2026 bookstore catalogue; search by ISBN to confirm current availability · Digital book purchase optional