Franziska Braun, Fabian Edel, Antonio Ardilio (2022). Enhancing driver’s experience through emotion sensitive lighting interaction. In: Usability and User Experience. AHFE Open Access, vol. 39, pp. 371–379. https://doi.org/10.54941/ahfe1001731
The vehicle has become an intelligent product by innovative technologies. However, most of the new technologies address human safety, such as lane keeping or emergency brake assistance. The smart optimization of the driver’s well-being through sensitivity of the technology has been neglected so far. Thus, this study investigates the influence of emotion-sensitive lighting on the driver. Individual light interactions are based on detected emotions of the driver to enhance the individual driving experience. IntroductionLight and colors have an archaic effect on humans (Goldstein 2015). They trigger the human diencephalon to release the serotonin as well as cortisol. For example, light blue components in the light suppress melatonin release. This driver feels awake or concentrated. (Sabine Harrasko-Kocmann) Different factors such as traffic jams, aggressive driving behavior of other road users and challenging weather conditions have a negative impact on the driver’s feeling (Bitkina et al. 2019). The consequences are negative emotions such as anger, fear and worry, which in turn lead to inattention and insecurity. Also factors like tiredness and physical exhaustion can impact the human well-beeing. As a result, the driver is unfocused and annoyed after the ride or agitated and restless. Furthermore, stress for example, increases the risk of accidents because people become inattentive (Evers 2011). To counteract this and positively influence the driving experience, specific lighting interactions are intended to enhance the driver's feelings. In this work, lighting is used to influence the driver's mood. The aim of the study is to investigate whether the targeted use of light contributes to increase the well-being and which use-cases are particularly suitable.ApproachFig.1 shows the scientific approach for this work. Firstly, requirements are defined. They are based on a literature review on the psychological effects of light, an investigation of the target groups and a reflection on highly emotional driving situations. For testing, three use cases are defined in detail. The first deals with increasing the driver's concentration, the second with targeted stress reduction and the third with positive reinforcement of emotion. They include the emotional level of the driver, his or her journey start and destination, the target emotion, and the light interaction to achieve this emotion. A vehicle-prototype is modified to test the individual scenarios. Besides LED strips along the windscreen, the door frames and interior ambient lights, screens are installed in the doors and the roof [Fig.2]. In this way, not only individual light colors and intensities can be visualized, but also more complex, dynamic movements. To get a uniform effect the interior lights are synchronized with the visualization of the screens.Fig.2: CAD rendering of the prototype. One screen is placed in each of the doors and one in the roof. LED strips run along the windscreen and door frame. Ambient lights at the whole interior.For the qualitative study, 35 test persons are interviewed by using the prototype [Fig.3]. All test persons passing though the three use-cases. In order to measure the success of the light effect, the pulse and surface moisture of the skin are measured. In addition, there is a discussion before and after each use case. ConclusionThe prototype has been built and the lightning interaction implemented. During the preparation of this abstract, the user testings are conducted. The full paper and also the oral presentation will show more details about the methodology and the evaluation of the testing.
70% of the Germans spend up to 30 minutes commuting in vehicles every day; 22% even up to 60 minutes (Statistisches Bundesamt, 2020). During the commuting, the driver is exposed to multiple stress factors. The most common are increased traffic density, reduced visibility of other road users, aggressive driving behavior of other road users and poor concentration, for example due to lack of sleep (Magaña u. a., 2021). Due to the stress, nega- tive feelings such as nervousness, anger and fear are stimulated, which have a negative impact on the driver’s attention (Bitkina u. a., 2019). As a result, the risk of road accidents increases. In addition to the life-threatening effects of the lack of concentration, the general well-being during and after the journey is also a relevant factor. Many people are typically more relaxed when they enter the vehicle then when they get out again. One way to turn the driving process into a more pleasurable and safe experience, is to use light interacti- ons. In the human-centric lighting research, light is known as an influencing factor for the performance and well-being of humankind (Houser/Esposito, 2021).
Light has a very archaic effect on humans. Darkness, for example, has a tiring effect because it is associated with bedtime (Haikonen/Sumla, 2006). On the other hand, bright, warm light reminds us of the sunrise and has a stimulating effect on human beings. This light color effect is used on long-haul flights in planes to wake up the passengers before landing in a pleasant and natural way. In 2018, Lufthansa won the German Design Award with this lighting concept for the Airbus A380. In addition to the above-mentioned wake-up lighting, they have created different mood scenarios for various use cases, like a private restaurant atmosphere or adapting the lighting to the biorhy- thms of the passengers (Maeder, 2018; Schröter u. a., 2018). Thereby, light color plays a decisive role. In the study “The influence of color on student emotion, heart rate and performance in learning environments” from 2017, Prof. Dr. Banu Manav examines the influence of color in cognitive demanding tasks (Manav, 2017). The test persons were placed in different colored rooms where they had to read a text and to answer comprehension questions. The evaluation of the study revealed that light blue and white colors have a posi- tive impact on the motivation and concentration, whereas red colored light has a distracting and annoying effect. Pale yellow light increases attention, whereas lively yellow light is distracting and creates a feeling of heat.
In office spaces, white and blue light tones are already being used in a tar- geted way to increase concentration (Cajochen u. a., 2011). Light with an increased blue percentage is used to stimulate the biological production of melatonin. As a result, the person is more wakeful and concentrated. Resea- rch has shown, that through natural light atmosphere and a simulated moving cloud ceiling, it was possible to significantly increase the attention of the people in the room (Moving clouds on a virtual sky affect well-being and subjective tiredness positively, 2012). In addition to commercial products and services, light interaction is also applicated in medical use cases. Light thera- pies are used especially in the northern hemisphere to treat seasonal affective disorder (Markus Canazei/Elisabeth Weiss, 2013). To reduce the melatonin production, light pulses with a high blue content are used. This makes the patients more wakeful and motivated, and it counteracts winter depressions. In cars, the targeted use of light for stimulating the driver’s mood has been mostly neglected, so far. Our study will examine the influence of light on the driver’s physical and psychological condition. Furthermore, it will be investi- gated, how light intensity and light color can be used specifically to trigger drivers’ moods. To evaluate the effects and differences, the effect of light color and intensity will be applied to both, negative and positive situations.
APPROACH AND METHODOLOGY Research
The study is divided into four main work packages. Figure 1 shows the scien- tific approach for this work. As the perception and feeling of the driver is in the center of the investigation, a user-centered approach was chosen. Based on a literature review on the psychological effects of light, an investigation
Enhancing Driver’s Experience Through Emotion Sensitive Lighting Interaction 373
Figure 1: Scientific approach.
of the target group and a reflection on general requirements for highly emo- tional driving situations are defined. An excerpt of the research is given in chapter 2). For testing, three use cases are defined in detail. The first deals with increasing the driver’s concentration, the second with targeted stress reduction and the third with positive reinforcement of emotion.
Ideation As starting point for investigating the effects of light on the driving experi- ence, three scenarios were set up. The first use case (“dense urban traffic”) shows a situation in a city center with heavy traffic and aggressive driving behavior of other road users, while chaotic traffic sounds reinforce the men- tal situation. The second use case (“rainy evening ride”), focuses on a driving situation in the evening where it is raining heavily underlined by the sound of rain. For comparing the results with the effect on positive scenarios, the last and third use case (“coast ride”) was defined as ride along the coast on a sunny afternoon during a holiday trip. Music is playing and the ocean can be heard. Based on the literature review, different lighting scenes were developed for the use cases. The first lighting scene for the use case “dense urban traf- fic” has the aim to lower stress level and to increase concentration. Thus, the lighting starts with green and blue colors to increase concentration and ends up in warm shades light of orange and red for de-stressing. The second ligh- ting scene aims to support the use case “rainy evening ride” and focusses on supporting concentration, by showing the colors blue and white dynamically changing. The last light interaction should support the positive emotions for the use case “coast ride”and implements warm colors of light yellow, orange, and pink.
Building Prototype For allowing fast and lean but meaningful testing of the use cases, an Early- Prototype was built and used by test-persons in a pretest. An Early-Prototype is defined as an easy- and fast-to-build but incomplete type of a prototype as it focusses on those aspects that are necessary for a defined test. Unlike a com- monly known prototype, an Early-Prototype only includes properties which are necessary to realize a prototype at an explicit moment for the develo- pment of new technologies and to reach the defined testing goals. The main goal of our early prototype was to immerse the test drivers into the above mentioned three use cases. After getting the test persons drenched into the
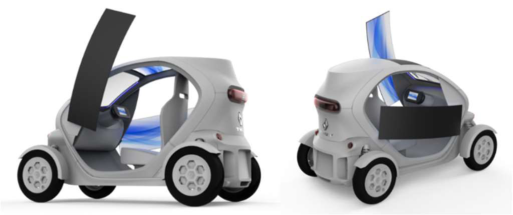
Figure 2: CAD rendering of our early prototype.
situations, we initialized our lighting scenario and covered the vehicle inte- rior with colored light to analyze the changes of his health condition during the pretest-phase.
To give the driver (test-participant) the feeling of a surrounded color and light environment in a vehicle, different technical devices were installed inside the prototype vehicle. In our case we equipped a Renault Twizy, a micro car. This vehicle was particularly suitable for our early prototypes, because of its very low technical substance. We replaced both doors of the vehicle by two 49” curved video screens. The vehicle roof was also replaced by a 32” video screen to intensify the experience. Aim of the third screen was to give color and light stimulation from above. All monitors, both the side monitors and the roof monitor, are designed to help illuminate the driver with color and light. Figure 2 shows a CAD rendering of the prototype.
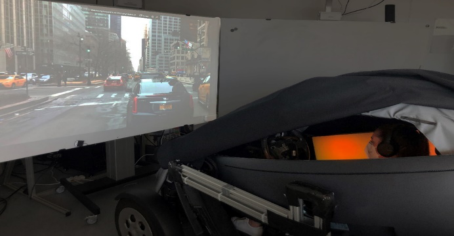
To increase the effect of light and color, ambient lights are located at the lower side of the screens, behind the driver and at the footwell. In addition to the video screens, a neon light strip and four light bars were installed in the vehicle to simulate the ambient light. The neon light strip was installed around the windshield to enable the chance of a very direct, but also steamed light and color influence on the driver’s field of view. At the same time the driver’s view is directed to the driving action in front of the car. The ambient lights were directly connected to the screens to amplify the color and their intensity. For the technical realization a smart home system is used, which allows to relate signal of the screens to the color of the ambient lights in an automated way. All components are controlled by a computer, which is located in the rear of the vehicle. The exterior of the test-vehicle was replaced by textile to allow a fast removal of exterior parts for different investigations and to create a dark inside of the vehicle. For the test environment, the Twizy was placed in front of a wide screen video projector. Figure 3 shows the test vehicle and the test environment.
User Testing We had analyzed 17 participants in total. The applicants run through all the above mentioned three use cases. The test was conducted twice, one time without light interaction and one time with it. After each use case, the test subject was asked how he or she assessed his or her personal change in mood by lightning. For the description of their mood, the participants received a
Enhancing Driver’s Experience Through Emotion Sensitive Lighting Interaction 375
Figure 3: The test-environment and the test vehicle (Early Prototype).
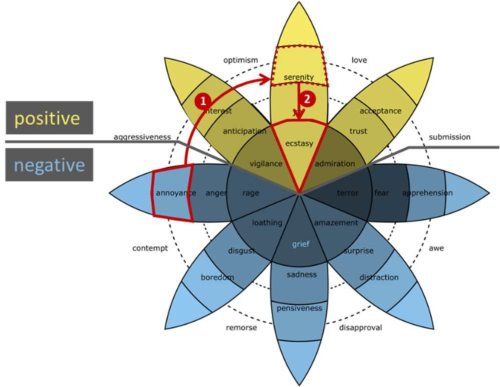
questionnaire and had to orientate themselves within the Plutchiks’s Wheel of Emotions (Plutchik, 1982). Plutchik suggested eight primary emotions and scaled them according their intensity from the outside to the inside of the wheel (inside: strong intensity, e,g, rage, outside low intensity e.g. anno- yance). The questionnaire also includes several demographic questions like gender and age of the participants, as well as questions about the participants’ frequency of using vehicles. Based on those questions, correlations between the demographic factors and the change of mood at the Plutchik Wheel can be identified and analyzed. For analyzing the change of mood by means of Plutchik’s Wheel, a dedicated approach was developed. We divided the Wheel of Emotion in positive and negative emotions. Vigilance, ecstasy and admira- tion and its gradations were assigned as positive emotions (Figure 4, yellow), rage, loathing, grief, amazement, terror and its gradations as negative emo- tions (Figure 4, blue). The participants had the task to choose their state of mood at the beginning of the use case and after the end of the test. In this way it was possible to detect, a positive change, a negative change, or the perpetuation of emotions (Figure 4, Step 1). We defined four different values of change: negative to positive (np): Color and light change the emotion from a negative beginning to a positive final.
positive to positive (pp): Color and light don’t change the emotional state. Positive emotions are not changing.
positive to negative (pn): Color and light change the emotion from a positive beginning to a negative final.
negative to negative (nn): Color and light don’t change the emotional state. Negative emotions are not changing.
Supplementary, the level of intense of the change of emotions can also be figured out by means of the Wheel of Emotions. The emotion gets amplified from the outside to the inside of the wheel. The emotion level can be of a maximum value of +/-2 (Figure 4, Step 2). Figure 4 shows an example. The initial state is annoyance (which is negative). The final state is ecstasy, which is positive. The difference of the intense of the positive emotion is about two steps from serenity to ecstasy. Summarized there is a change of the emotion from negative to positive (np) with the level of intense of +2 (np++).
Figure 4: Evaluation proceeding at the Plutchik’s Wheel of Emotions.
To validate the test persons statements about their subjective feelings, a smart wristband collects data about the heartbeat (Hz) and the Electro Der- mal Activity (EDA). Rising pulse equals rising activity. Rising EDA means an increase in negative stress. Decreasing Hz and EDA means relaxation. Incre- asing Hz and decreasing EDA means that attention is increasing. Decreasing Hz and increasing EDA means increasing tension. Increasing Hz and increa- sing EDA means negative stress. By combining the Wheel of Emotions and the vital data, conclusions can be drawn about the effect of light during driving.
CONCLUSION AND OUTLOOK The results show the impact of lights and colors to the mood of car drivers by their emotional change. 17 participants were tested. 9 participants were males and 8 females. The average age was 25 years and therefore young driver. Just one person is using a car daily, the majority is using the car several times per week (7 Persons) or less often than once a week (6 Persons). Three of the participants use a car only about once a week. The evaluation of the results about the emotional change, originating from the assessment based on the questionnaire and the Wheel of Emotions, revealed the following:
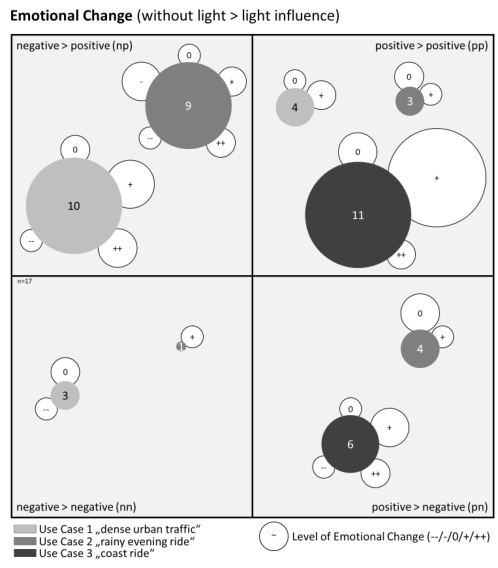
Questionnaire Results for Use Case 1 (“Dense Urban Traffic”) By applying our lighting scenario 10 persons experienced an emotional change from negative to positive. The majority of participants with an incre- asing level of intense with +1 (np+). 4 persons remained at their positive emotional state and had a change into a higher level of intense of the emo- tional mood (pp+). 3 persons stayed at their negative emotional state and had a change into a lower level of intense of the emotional mood (nn-). None of the participants started with a positive emotional state and ended with a negative.
Enhancing Driver’s Experience Through Emotion Sensitive Lighting Interaction 377
Most participants started with negative emotions and got better with the impact of light and color. Thus, it can be assumed that the chosen light and color scenario helped them to achieve a more positive emotional state.
Questionnaire Results for Use Case 2: (“Rainy Evening Ride”): 9 persons experienced an emotional change from negative to positive, the most with a decreasing level of intense with -1 (np-). 3 persons stayed at their positive emotional state and had a nearly equal level of intense of the emotion (pp0). One person stayed at its negative emotional state and had a change into a higher level of intense of the emotional mood (nn+). 4 persons started with a positive emotional state and ended with a negative one, most with an equal level of intense of the emotion (pn0).
The light and color choice helped the participants to get into a more posi- tive mood in general. People who stayed in a positive mood, had no change of their intense level of emotion.
Questionnaire Results for Use Case 3 (“Coast Ride”): No persons had an emotional start with negative emotions. All participants had a positive emotional state at the beginning. 11 persons stayed at their positive emotional state and the most of them had a change into a higher level of intense of emotional mood (pp+). 6 persons started with a positive emotional state and ended with a negative. The level of intensity of the emo- tion arises greatly. The highest level of agreement was identified for a slightly higher level of intensity of emotion (pn+).
The results of this use case show, that the choice of light and color can raise the emotional state to an even higher level. even though the initial emotional situation is positive. For some participants, additional influences by light and color were not seen as necessary in positive situations as i those have been perceived as superfluous or annoying. Figure 5 shows all results of all use cases at the test series.
All participants indicated that light intensity and color influenced their emotions during the driving scenarios. As an important finding for future scientific work can be named that according to the results, a change of the emotional mood can occur in both ways, positive as well as negative.
Vital Data Analysis for Use Cases Striking differences were found by comparing the results of the vital signs that were detected by the bracelet with those results based on the answers the participants indicated about their personal perception of a changed mood. The comparison of the emotional progression shows the following matches (Table 1):
As shown in the table, the personal assessment of emotional change by the participants compared to their vital signs are not consistent. The results of the measured vital data and the more subjective assessment by the test persons only correspond to only 45.1%. There is a discrepancy between the subjective assessment and objective measurement.
Figure 5: Results of emotion change in the use cases based on the test persons assessment.Table 1. Comparison of the results on emotional change.
Table available in the original PDF paper.
Outlook The influence of colour and light applications in cars on the perceived expe- rience of emotional moods had been shown by our experiment. Nevertheless, the poor match between the self-estimation of the participants and the dete- cted vital signs analysis needs to be studied in further steps and reasons for this dis-match needs to be found and eliminated. We conducted following hypotheses, which in future needs to be analysed:
The heat dissipation of the video screens may cause “hidden” stress to the participants or/and increased the electro dermal activity of the user. Both would falsify the results.
The narrow interior of the used micro car and the obscuration due to the textile may cause “claustrophobia effects” to the user.
Enhancing Driver’s Experience Through Emotion Sensitive Lighting Interaction 379
The participants may be excited at the beginning of the tests. As a relati- vely small amount of time was scheduled from “arrival of the participant” to “testing” this effect could have falsified the results, too.
Maybe the “wrap up” time - the time between first test (without applying light scenario) and second test (applying light scenario) - was too short and the participant could not reach the initial emotional state.
Maybe heartbeat and/or EDA were not the best-fitting vital signs for our analysis, other vital signs may should be considered (e.g. pupil size, respiration rate, blood pressure, oxygen saturation, etc.).
Future investigations are necessary to test and validate the above- mentioned hypotheses drawn from this study.
REFERENCES
Bitkina, Olga Vl u. a. (2019): Identifying Traffic Context Using Driving Stress: A Longitudinal Preliminary Case Study, in: Sensors (Basel, Switzerland) 19 (2019), S. 2152, https://doi.org/10.3390/s19092152 Cajochen, Christian u. a. (2011): Evening exposure to a light-emitting diodes
(LED)-backlit computer screen affects circadian physiology and cognitive perfor- mance, in: Journal of applied physiology (Bethesda, Md. : 1985) 110 (2011), S. 1432–1438 Haikonen, H./Summala, H. (2006): Effects of darkness on traffic accidents, 2006 Han, Liu u. a. (2017): The intention to adopt electric vehicles: Driven by functional and non-functional values, in: Transportation Research Part A: Policy and Practice 103 (2017), S. 185–197, https://doi.org/10.1016/j.tra.2017.05.033 Houser, Kevin W./Esposito, Tony (2021): Human-Centric Lighting: Foundational
Considerations and a Five-Step Design Process, in: Frontiers in neurology 12 (2021), S. 630553 Maeder, Dominik (2018): Light itself: Medienästhetik des Hintergrunds in der Flugzeugkabine, in: Jens Schröter/Gregor Schwering/Dominik Maeder/Till A. Heilmann (Hrsg.), Ambient: Ästhetik des Hintergrunds, 2018, S. 147–165, https: //doi.org/10.1007/\hbox{978--3}-\hbox{658--19752}-0_8 Magaña, Víctor Corcoba u. a. (2021): Beside and Behind the Wheel: Factors that
Influence Driving Stress and Driving Behavior, in: Sustainability 13 (2021), S. 4775, https://doi.org/10.3390/su13094775 Manav, Banu (2017): Color-emotion associations, designing color schemes for urban environment-architectural settings, in: Color Res. Appl. 42 (2017), S. 631–640, https://doi.org/10.1002/col.22123 Markus Canazei/Elisabeth Weiss (2013): The influence of light on mood and emo-
tion, in: Changiz Mohiyeddini/Michael W. Eysenck/Stephanie Bauer (Hrsg.), Handbook of psychology of emotions: Recent theoretical perspectives and novel empirical findings : Volume 1, 2013, S. 297–306 Mohiyeddini, Changiz/Eysenck, Michael W./Bauer, Stephanie (Hrsg.) (2013): Handbook of psychology of emotions: Recent theoretical perspectives and novel empirical findings : Volume 1, New York: Nova Publishers, 2013 (2012): Moving clouds on a virtual sky affect well-being and subjective tiredness
positively, 2012 Plutchik, Robert (1982): A psychoevolutionary theory of emotions, in: Social Science Information 21 (1982), S. 529–553, https://doi.org/10.1177/ 053901882021004003 Schröter, Jens u. a. (Hrsg.) (2018): Ambient: Ästhetik des Hintergrunds, Wiesbaden: Springer VS, 2018
LISTED IN THE AHFE DIGITAL BOOKSTORE CATALOGUE
Explore the complete digital volume
Usability and User Experience
Read this individual research paper free through the original publisher, or explore the full digital proceedings book.
ISBN 978-1-958651-15-5
Explore this ISBN in the AHFE Bookstore ↗Listed in the July 2026 bookstore catalogue; search by ISBN to confirm current availability · Digital book purchase optional