Sylvain Bruni (2022). Introducing PATI: The Pareto Analysis for Technology Insertion - A Human-Centered Methodology to Identify and Prioritize Innovation in Complex Systems. In: Creativity, Innovation and Entrepreneurship. AHFE Open Access, vol. 31, pp. 64–74. https://doi.org/10.54941/ahfe1001508
The commoditization of artificial intelligence (AI), machine learning (ML) algorithms, and automated agents (AA) affords innovators and entrepreneurs myriad opportunities for the creative pursuit of new business endeavors. This abundance is, however, overwhelming, and no adequate methodology currently exists to identify and select what technologies to insert into existing systems or processes to create value. In particular, there is a lack of techniques that drive such decision-making towards desireability and utilization, two critical factors that entrepreneurs and innovators must diligently consider in their efforts. To bridge this gap, we propose the simple, human-centered “pareto analysis for technology insertion,” or PATI, as an approach to identify and prioritize the insertion of AI, ML, or AA into complex systems. Through the application of PATI to the use case of aircraft maintenance, we demonstrate how this straightforward methodology yields artifacts that are both useful and comprehensive for most stakeholders in the innovation entrepreneurship ecosystem, thereby accelerating and making more resilient their creative pursuits.
The commoditization of artificial intelligence (AI), machine learning (ML) algorithms, and automated agents (AA) affords innovators and entrepreneurs myriad opportunities for the creative pursuit of new business endeavors that solve critical problems and serve consumer needs (Iansiti and Lakhani 2020). Because of this, it can be overwhelming to figure out how to start such a jour- ney: Even for seemingly straightforward use cases, such as the digitization of maintenance manuals, many options to innovate are readily imaginable. One could choose to simply convert a paper manual into the standardized and ubi- quitous Portable Document Format (PDF); or possibly into a set of interactive videos; or yet again into situated instructions in augmented reality (AR). But which option should an entrepreneur pursue first? Which one might result
Introducing PATI: The Pareto Analysis for Technology Insertion 65
in better, faster, more sustainable adoption and usage, resulting in a stronger business case and technical product?
Current best practices in empathetic design thinking (Koppen and Meinel 2012, Scully and Montilus 2018) typically advocate for a “focus on the user,” which has yielded an expansion of the traditional fields of human factors engineering into user experience design and product management (Jordan 2000, Schmitt et al. 2015). But the research-oriented and academically defi- ned methods for human factors engineering may not always align with the goals of innovators and entrepreneurs, or the constraints under which they operate (Bruni 2020).
In this paper, we report on how we sought to bridge this gap. First, we review the state-of-the-art methodologies for technology insertion and useful current perspectives, as well as their limitations. Then, we propose a sim- ple, human-centered methodology to overcome these limits: the user-driven “pareto analysis for technology insertion,” or PATI. We further provide a step-by-step use case and discuss the lessons learned from that initial instan- tiation. Ultimately, we demonstrate how PATI yields artifacts that are both useful and comprehensive for most stakeholders in the innovation entrepre- neurship ecosystem, thereby accelerating and making more resilient their creative pursuits.
BACKGROUND
One critically documented issue in the domain of technology insertion is that of paralysis by analysis in relation to the process of selecting what and when to insert new or updated technology in novel or existing systems (Sharif 2008). Coined as a “dilemma of choice” by Sharif (2008), paralysis by analy- sis exists insofar as designer, developers, and technologists get stuck in the assessment of candidate technologies. This evaluation becomes a risk when over-analyzing the potential advantages and drawbacks of course-of-action in technology insertion preempts or prevents the decision making. Sharif conclu- des that the “act and […] process of evaluation must not take precedence over the decision” that they are expected to inform.
In manufacturing and industrial engineering, a handful of techniques have been researched academically or proposed as operational best practices. The concept of “viability”has been introduced as a measure of producibility, sup- portability, and evolvability to augment the traditional metrics employed in manufacturing sustainment (such as performance, reliability, environmental impact, cost, logistics, or affordability) and to ensure that evolving systems could continue to be manufactured effectively under evolving requirements (Sandborn et al. 2003). Similarly, the Mitigation of Obsolescence Cost Analy- sis or MOCA methodology aims to determine the impact of electronic parts becoming obsolescent to define the optimal design refresh plan (Singh 2004). In both cases, the context of use is that of determining and planning design refresh for existing technologies. In a similar context, a human-centered approach has been proposed in recent years, which seeks the direct input of experts and focuses on research and development (R&D) applications (Kalitventzeff and Maréchal 2020); however, this work is (a) highly specific
66 Bruni
to one particular domain (energy savings); (b) similarly to previous meth- ods, focuses on industrial considerations (e.g., compatibility, profitability) rather than end-users; and (c) proposes extensive tools requiring wide- ranging inputs from experts, thereby focusing on comprehensiveness and accuracy of quantitative input to compute technology insertion recommen- dations. Ultimately, this approach is heavy, static, waterfall-structured, and thus misaligned with current agile best practices employed by entrepreneurs and innovators.
A similar misalignment exists in research fields that examine the selection and insertion of technology into critical environments like defense or health- care. In the defense domain, the use of influence diagrams has been proposed to support the identification of opportunities for technology insertion (Curtis and Dortmans 2001). A conceptual model of a system (such as how an Army force works to accomplish a specific set of objectives) is built whereby conce- pts are related by how they influence one another (positively or negatively). Then, controllable technology-based variables (TBVs) are defined for each concept and key technology features (KTFs) expand the TBVs. The influe- nce diagram is then reshaped to illustrate how KTFs influence TBVs and, in fine, measures of performance as driven by those. Ultimately, such influe- nce diagrams can support the identification of which KTF may best improve performance metrics. However, this approach seems purely qualitative and would require extensive effort to become qualitative. Furthermore, it does not provide specifics for recommending one particular course of action versus another.
In the healthcare domain, the lack of guidance in “responsible digital selection technology” for the purpose of research endeavors leads to one- off creations typically tailored to a single application (Nebeker et al. 2020). For example, Nebeker and colleagues built their own framework for defi- ning what technology to insert, where and when, as part of their research into digital health tools. Based on the American Psychiatric Association (APA) framework’s four components (interoperability, usability, evidence, and privacy), they added a fifth layer for ethical principles and generated a query-based checklist for researchers and technologists to employ. However, this methodology features dozens of questions seeking mostly quantitative inputs to enable decision-making. Such an approach, albeit comprehensive and scientifically grounded, appears too heavy and resource-consuming in the entrepreneurial and innovation world (Bruni 2020).
Finally, an insightful combination of methods has been recently sugge- sted to examine technology insertion in tightly coupled systems of systems (SOS): By combining the diamond approach (Shenhar and Dvir 2007) and the Dependency Structure Matrix (DSM) analysis of complex SOSs (Ulrich and Eppinger 2003), researchers have explored how quantitative measures of complexity and integration risks support decision making (Moreno and Fortin 2020). This methodology, which assembles techniques from the pro- ject management and product design domains, has only been applied to the conceptual design stage, however. It remains unclear whether it can apply to existing, operational SOSs.
Introducing PATI: The Pareto Analysis for Technology Insertion 67
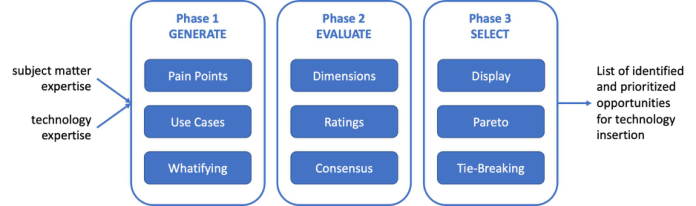
Figure 1: Overview of the PATI methodology.
Consequently, there exists a critical lack of methodology for iden- tifying and selecting technology insertion in complex systems that is human-centered, light, and focused on desireability and utilization – two critical factors that entrepreneurs and innovators must consider in their efforts.
METHODOLOGY
To answer this unmet need, we leveraged best practices in human factors engineering and product design to form a three-step methodology, the Pareto Analysis for Technology Insertion (PATI; Figure 1). Each step requires the involvement of subject matter experts (SMEs), familiar-enough with the domain of interest and current practices, and technologists with a cur- sory knowledge of the fields of human-machine teaming, human-computer collaboration, data science, or software engineering in complex systems.
Phase 1: Generate Pain Point-Driven Insertion Opportunities The first phase consists in generating targeted Insertion Opportunities (IOs) in three steps:
1. Identifying pain points. Based on the domain SMEs’ knowledge and experiences and using any human factors method such as focused inqui- ries, the critical incident technique, direct observation, or other forms of insight surfacing, we elicit critical pain points for end-users in the domain. 2. Creating use cases. Then, for each pain point, a use case is built to reflect a concrete example of work where such pain point might sur- face. Note that it is possible to create use cases that incidentally cover multiple pain points. Use cases may take the form of plain English para- graphs, bullet-pointed lists of successive descriptions of performance, or any other method, provided it instantiates a written or visual rendering of activities performed by the end-user. 3. Whatifying. The last step of Phase 1 consists in a paired review of the use cases, where technologists and domain SMEs are probed in turn to ima- gine how each item, step, detail, or aspect of the use case may be swapped for a version that includes AI, ML, or AA. We call this step “whatifying” because it heavily relies on asking each member of the pair “what if”- formulated questions. SMEs may be asked probes such as “What if this
68 Bruni
activity were not done by the human but by some form of automation?” In such case, they may identify opportunities as well as barriers to such imagined case. Similarly, technologists may be prompted “What if AI were capable of performing this instead?” In that case, they may identify AI, ML, or AA components available, or other pointers to existing or upcoming capabilities. This interactive step is iterative and incremental. By so doing, a set of specific IOs are catalogued and contextualized with the use case and pain points to which they are linked.
Phase 2: Evaluate Against Assessment Dimensions The second phase consists in evaluating the IOs from Phase 1, following three steps:
1. Defining dimensions. The first step of Phase 2 is to select and agree to a minimal set of Assessment Dimensions (ADs) that capture the essence of what entrepreneurs and innovators are seeking. We recommend no more than three dimensions to be identified, so they may be easily visualized in Phase 3. Our initial practice of this methodology has identified the following three dimensions as critical to evaluate IOs against desireabi- lity, utilization, and other aspects of the innovative deployment of AI, ML, and AA: utility (to the end user), frequency (of use by the system or the end user), and value (in terms of business and commercialization). For each selected dimension, a key question is defined as well as a Likert scale with three (min) to five (max) anchors, so as to keep discussions in a later step manageable. 2. Rating IOs against ADs. Then, subject matter experts are tasked with individually rating each IOs against each AD, by answering the key questions with one of the anchors from the corresponding scale. 3. Reconciling through consensus. Phase 2 concludes by a reconciliation step wherein assembled subject matter experts discuss their individual ratings from the previous step and defining a consensus-based rating for each AD for each IO. This step is critical in weeding out outliers or, conversely, convincing the group by highlighting blind spots. The output of this step is a multi-dimensional assessment of the opportunities.
Phase 3: Select Priorities with a Pareto Visualization The last phase of the PATI methodology involves representing the consensus- rated IOs of Phase 2 and deciding which ones make the cut, in three steps:
1. Displaying ratings. Phase 3 starts with visualizing the IOs in a multi- dimensional space where the axes are the ADs and markers for each IO are positioned with the consensus-based ratings as their coordinates. Our practice has showed that a common 2D graph (with two ADs as the x and y axis) augmented with colored markers for a third AD does an effective job of meaningfully and understandably representing where IOs stand against all ADs, and against one another. 2. Selecting Pareto IOs. Once all IOs are visualized in the previous step, we highlight the Pareto front, that is, the set of IOs such that no item in that
Introducing PATI: The Pareto Analysis for Technology Insertion 69
set can be bested on all ADs by any other IO. In other words, it is the set of items that have the best combination of ratings, such that all other IOs have at a minimum one worse rating. In situations where all ADs are positively scaled (i.e., “greater is better”), the Pareto front is the outer surface of the sphere of IOs. 3. Breaking ties. Invariably, there will be ties between IOs rated the same, within the Pareto set. Again, consensus-based discussions between SMEs and technologists are employed to break (removing one or more IOs from the final set) or not (keeping all tied IOs) these ties. The remaining Pareto IOs are selected as the output of this methodology.
By blending cognitive engineering methods of analyzing and understan- ding how humans work and make decisions with product design approaches that drive impact and value, we generated crisp, prioritized, desired inser- tion opportunities, defined within their context of use and motivated by their related pain points.
EXAMPLE APPLICATION We applied the PATI methodology to the general domain of aviation mainte- nance, which is ripe for augmentation using AI, ML, and AA, in consideration of the vast array of existing sensors, models, modalities, and smart automa- tion being researched, developed, and deployed to aviation hangars around the world (European Union Aviation Safety Agency 2020). In the following sections, we summarize our application of the PATI method to this domain, for each Phase and Step.
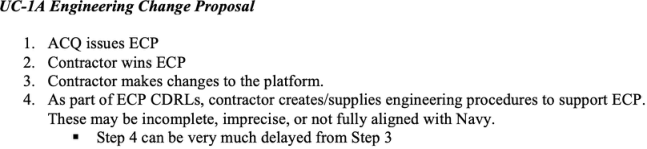
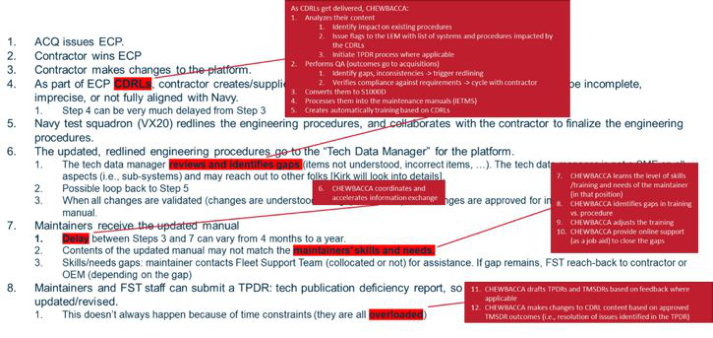
Phase 1 We completed step 1-1 by holding elicitation session with SMEs who have experience as military aircraft maintenance and inspection, both in hangars and on the line (that is, under open skies). Five critical pain points were identified: data access, data dynamicity, data siloes, data distribution, and data levels. Step 1-2 was performed using the Short Creative Briefing method (SCB; Spool 2018). The key scenarios from the SCBs became our four use cases, as defined in Table 1 and exemplified in Figure 2. The whatifying of Step 1-3 was performed as a moderator-led group exercise with our avia- tion maintenance SMEs and our team’s technologists, who have decades of experience in data science and human-machine teaming. A scribe provided live annotation of the use cases based on feedback from all stakeholders, as exemplified in red in Figure 3.
Altogether, 35 IOs were generated across the four use cases. Examples include “#3 Use AI, ML, AA to convert CDRLs to S1000D,” “#16 Use AI, ML, AA to support voice-based annotation of procedures, remarks, and comments,” or “#27 Use AI, ML, AA to identify missing replacement procedures.”
70 Bruni
Table 1. Uses cases in the aviation maintenance domain.
Table available in the original PDF paper.
Use Case Title Related Pain Points UC1- Issuing an Engineering Change Proposal PP-1 (data access) - PP-2 (data dynamicity) - PP-5 (data level) UC2- Redlining during On-Wing Engine Maintenance
PP-1 (data access) - PP-5 (data level)
PP-3 (data siloes) - PP-4 (data distribution) UC3- Schedule Maintenance of a Landing Gear UC4- Maintenance Triggered by a Bird Strike PP-1 (data access) - PP-3 (data siloes) - PP-5 (data level)
Figure 2: Partial (truncated) example of a use case written out as part of PATI step 1-2.Figure 3: Partial (truncated) example of an annotated use case during whatifying. Red boxes include the IOs brainstormed by stakeholders, in relation to specific elements of the use cases.
Phase 2 Phase 2 commenced with the definition and agreement within our team of the ADs and their related key questions and anchors. Those are presented in Table 2. Then our team tasked three external SMEs to rate all 35 IOs against these three dimensions. This activity generated a total of 315 indivi- dual ratings, which were then collated and reviewed for consolidation in a single table. When all raters agreed, the corresponding cell (IO x AD) was marked as such. A moderator-led consensus-oriented discussion was held with all SMEs (those who participated in the generation of IOs and those who rated them against ADs), to finalize ratings across the table.
Introducing PATI: The Pareto Analysis for Technology Insertion 71
Table 2. Assessment dimensions with their key questions and anchors.
Table available in the original PDF paper.
Dimensions Key Questions Anchors Utility of support provided Compared to other IOs, how useful is the technology enabling this IO?
Very High, Above Average, Average, Below Average, Very Low Frequency of usage How often will maintainers use or need the technology enabling this IO?
High, Medium, Low
Very Frequently, Frequently, Occasionally, Rarely, Very Rarely Value for business and science
From a technical and transition perspective, what is the priority for creating the technology enabling this IO?
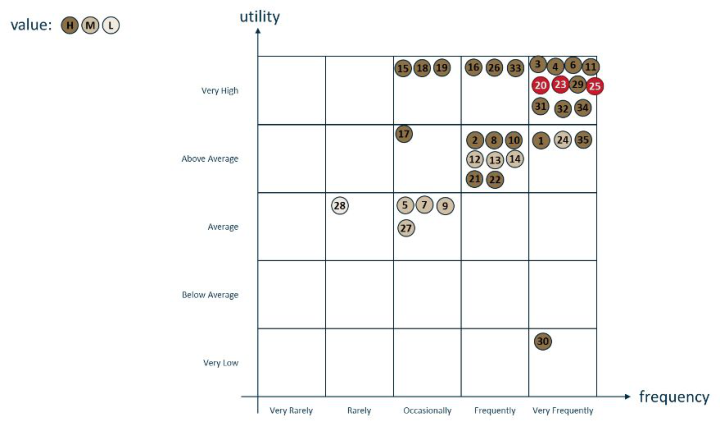
Figure 4: Multi-dimensional representation of the 35 IOs, from our four use cases in aviation maintenance, against the three ADs. The selected IOs are identified in red.
Phase 3 Finally, we represented all 35 IOs in a 2D graph, with the x axis represen- ting the Frequency AD, the y axis representing the Utility AD, and colors representing the Value AD (Step 3-1, Figure 4). Although we have not per- formed a formal analysis of correlation, a tendency seemed to emerge in this particular case with strong relations between ADs. The Pareto front (Step 3-3), in this instance, includes the eleven IOs located in the top right corner of the visualization (all rated Very High on Utility, Very Frequently on Fre- quency, and High on Value). This eleven-way tie between IOs (!) was broken through further discussions with the team. Three IOs were selected as making the final cut:
1. #20 – Use AI, ML, AA to identify all tools and materials needed for the procedures in advance
72 Bruni
2. #23 – Use AI, ML, AA to augment inspection tasks using augmented rea- lity for parts identification, displaying overlayed diagrams to separate components and parts, provide contextual information (such as war- nings, critical items), and highlight common problems areas of wear as identified by others or from manuals. 3. #25 – Use AI, ML, AA to recommend replacing parts that are nearing their lifetime limit during routine inspections rather than soon afterward to avoid duplicating procedures
LESSONS LEARNED Throughout this effort of developing and applying PATI, we collected insi- ghts, observations, and lessons learned from our team members. We report them here:
Lightweight – The process was reported as simple, straightforward and low-friction by team members, in particular our SMEs and technologists. All that is essentially needed are the human experts and their time to go through each step.
Desireability and utilization – Our leadership team, which adopted the mindset of innovative entrepreneurs in this effort, reported satisfaction at seeing the two critical criteria of desireability and utilization “baked into the process,” at multiple levels. For example, those are explicitly included in the shaping of the ADs and implicit within the pain point elicitation and use casing.
Traceability and tractability – Finally, our team reflected upon the benefits afforded by the PATI method in traceability (i.e., comprehensive linking of the origin of IOs and of the decisions made about them along the way) and tractability (differentiation and organization of all data items within the process). Those benefits were not targeted at the onset of these activities and naturally emerged as incidental advantages.
CONCLUSION AND FUTURE WORK We presented a simple methodology to identify and prioritize technology insertion, based on a multi-dimensional pareto analysis of opportunities to leverage concretely and specifically AI, ML, and AA in complex systems. This approach accounts for the needs of innovators and entrepreneurs: It is lightweight, focused on desireability and utilization, and fully traceable and tractable for justifying roadmap choices.
Our ongoing and future work applying PATI to adjacent and radically dif- ferent domains, which will be reported in separate contributions, is tackling the insertion of AI, ML, and AA in intelligence analysis, technology fore- casting, and clinical support. In particular we have prototyped new means of devising the IOs in Phase 1, relying on the hybrid cognitive task analysis (Tappan et al. 2011). Finally, we are exploring other sets of ADs in Phase 2, as well as novel display means for the PV in Phase 3.
Introducing PATI: The Pareto Analysis for Technology Insertion 73
ACKNOWLEDGMENT
The author would like to thank and acknowledge the contributions of Ms. Mary Freiman, Mr. Mark Bunn, and Mr. Aaron From in the instanti- ation of PATI for the referenced use case. This material is based upon work supported by the Naval Air Warfare Center under Contract No. N68335- 19-C-0765. Any opinions, findings, and conclusions or recommendations expressed in this material are those of the author and do not necessarily reflect the views of NAVAIR or the Department of Defense.
REFERENCES
Bruni, S. (2020). Balancing Innovation and Tangibility Using the Spiraled Agile Design Sprinting Approach (SPADES). Proceedings of the 11th International Conference on Applied Human Factors and Ergonomics (AHFE). Virtual. Curtis, N.J. and Dortmans, P.J. (2001). A semiquantitative construct to iden-
tify opportunities for technology insertion using a generic description of the Land Forces. Proceedings of the 2001 Land Warfare Conference, Sydney, Australia. European Union Aviation Safety Agency (2020). Artificial Intelligence Roadmap: A human-centric approach to AI in aviation [online]. Cologne: EASA. Available at easa.europa.eu/ai [accessed 02/10/2022]. Iansiti, M., and Lakhani, K. R. (2020). Competing in the Age of AI: Strategy and
Leadership When Algorithms and Networks Run the World. Boston: Harvard Business Review Press. Jahan, A., Edwards, K.L., and Bahraminasab, M. (2013). Multi-criteria Decision Analysis, Amsterdam: Elsevier, pp. 63–65. Jordan, P.W. (2000). Designing Pleasurable Products: An Introduction to the New
Human Factors. CRC Press. Kalitventzeff, B. and Maréchal, F. (2020). Optimal insertion of energy saving technologies in industrial processes: a web-based tool helps in developments and co-ordination of a European R&D project. Applied Thermal Engineering, 20(15-16), pp. 1347–1364. Koppen, E. and Meinel, C. (2012). Knowing People: The Empathetic Designer,
Design Philosophy Papers, 10(1), pp. 35–51. Moreno, C. and Fortin, C. (2020). Early Assessment Dashboard of Complex Systems for New Technology Insertion. Proceedings of the 2020 IEEE International Symposium on Systems Engineering, Vienna, Austria. Nebeker, C., Bartlett Ellis, R.J. and Torous, J. (2020). Development of a decision-
making checklist tool to support technology selection in digital health research. Translational Behavioral Medicine, 10(4), pp. 1004–1015. Sandborn, P.A., Herald, T., Houston, J. and Singh, P. (2003). Optimum Technology Insertion into Systems Based on the Assessment of Viability. IEEE Transactions on Components and Packaging Technologies, 26(4), pp. 734–738. Schmitt, R., Falk, B., Stiller, S. and Heinrichs, V. (2015). Human Factors in Product
Development and Design. Advances in Production Technology, p.201. Scully, E. and Montilus, K.D. (2018). Empathetic Design Thinking to Fuel your Learning Experience Design, The Emerging Learning Design Journal, 5(2), pp. 18–20. Sharif, A.M. (2008). Paralysis by analysis? The dilemma of choice and the risk of
technology evaluation. Journal of Enterprise Information Management, 21(1), pp. 8–12.
74 Bruni
Shenhar, A.J. and Dvir, D. (2007). Reinventing Project Management: The Diamond Approach to Successful Growth and Innovation. Boston: Harvard Business Review Press. Singh, P. (2004). Forecasting technology insertion concurrent with design refresh
planning for COTS-based obsolescence sensitive sustainment-dominated systems. Doctoral Dissertation, University of Maryland, College Park, MD. Spool, J. (2018). The Magical Short-Form Creative Brief [online]. Available from: https://articles.uie.com/short_form_creative_brief/ [accessed 02/10/2022]. Tappan, J.M., Pitman, D.J., Cummings, M.L. and Miglianico, D. (2011). Display
Requirements for an Interactive Rail Scheduling Display. Proceedings of the 14th International Conference on Human-Computer Interactions. Orlando, FL. Ulrich, K.T. and Eppinger, S.D. (2003). Product Design and Development. Boston: McGraw-Hill/Irwin.
LISTED IN THE AHFE DIGITAL BOOKSTORE CATALOGUE
Explore the complete digital volume
Creativity, Innovation and Entrepreneurship
Read this individual research paper free through the original publisher, or explore the full digital proceedings book.
ISBN 978-1-958651-07-0
Explore this ISBN in the AHFE Bookstore ↗Listed in the July 2026 bookstore catalogue; search by ISBN to confirm current availability · Digital book purchase optional