Evangelos Markopoulos, Kwame Ofori, Hannu Vanharanta (2022). Understanding corporate innovation readiness and frequency factors with the Democratic Survival, Mirrored and Compulsive (DSMC) Framework. In: Creativity, Innovation and Entrepreneurship. AHFE Open Access, vol. 31, pp. 83–92. https://doi.org/10.54941/ahfe1001510
Innovation, and technological innovation in particular, seems to be the driving force in the modern entrepreneurial revolution that stated at the beginning of this century. The .net phenomenon with the rise of the internet active users made the word flat, increased the business opportunities but also decreased the success rate. Blue oceans strategies have been replaced by Green and Pink oceans strategies in a continuous effort to stay current with the global innovation trends, needs and expectations. Most of the businesses across all industries seek micro-innovations to improve their product or services delivery but not necessarily to make a breakthrough. However, their innovation rate and pace differ from one another ranging from a year to five years. The distance to deliver innovation is related with the distance organizations have from democratic organizations cultures that ignite and utilize internal knowledge contributions which can lead to innovative processes, products, and services. The company’s DNA and philosophy is primarily responsible for the innovation pace and effectiveness, but this is also affected by internal and external factors. The ability or inability to create democracy organizational cultures has positive and negative consequences that need to be assessed in relation to the company’s’ finances, workforce knowledge and maturity, industry readiness and openness, and other factors. To understand the reasons and the business innovation frequency, an academic and critical literature review has been conducted. The results led to the formulation of a framework taking into consideration several weighted internal and external factors. Furthermore primary research has been conducted to better understand their innovation motives innovation frequency by gathering and analysing data from 66 individuals such as university innovation hub coordinators, entrepreneurs and product developers.This paper introduces the Survival, Mirrored and Compulsive (SMC) Framework, a step-by-step guide to help businesses understand their innovation readiness status. The framework calculates several attributes and plots the results on a graph indicating the factors to be considered in at the company’s innovations strategy. The primary findings indicate factors that impact the innovation frequency such as the available R&D facilities, financial position and stability, cumulative organizational knowledge, policy direction, and the industry the organizations operate, among others. The analysis of these factors in the SMC framework revealed that survival mode is what impacts organizational innovation frequency. Organizations tend to either reduce or postpone innovation initiatives until they feel comfortable for their existence or learned from their mistakes, neglecting however the fact that innovation driven by democratic internal development and utilization of the human intellectual capital costs less, is more likely to succeed, and can be attempted continuously. Therefore, the paper extends the SMC framework to the Democratic SMC (DMSC) that aligns the SMC phases with the Company Democracy Model innovation evolution levels by relating and categorizing the SCM innovation factors to the CDM levels. This helps to understand the organizational innovation DNA and also the culture and philosophy that impacts the company’s human intellectual capital production frequency and the utilization frequency of this capital as well. The paper refers limitations on both the SMC framework and DSMC model at their current development stages and identifies areas of further research for their maturity through applications and optimization.
Innovation, and technological innovation, in particular, seems to be the driving force in the modern entrepreneurial revolution that started at the beginning of this century. The .net phenomenon with the rise of the internet active users made the word flat, increased business opportunities, and decrea- sed the success rate. Therefore, Blue Ocean strategies (Kim and Maubourgne, 2005) have been replaced by Green Ocean (Markopoulos et al., 2020a), and Pink (Markopoulos et al., 2020b) Ocean strategies in a continuous effort to stay current with the global innovation trends, needs, and expectations.
Most businesses across all industries seek micro-innovations to improve their product or services delivery but not necessarily to make a breakthrough. However, their innovation rate and pace differ from one another, ranging from one year to five years. The distance to deliver innovation is related to the
distance organizations have from democratic organization cultures that ignite and utilize internal knowledge contributions, leading to innovative processes, products, and services. The company’s DNA and philosophy are primarily responsible for the innovation pace and effectiveness, but this is also affected by internal and external factors. The ability or inability to create democratic organizational cultures has positive and negative consequences that need to be assessed with the company’s finances, workforce knowledge and maturity, industry readiness and openness, and other factors.
RESEARCH METHODOLOGY An academic and critical literature review has been conducted to under- stand the reasons and the business innovation frequency. The results led to the formulation of a framework considering several weighted internal and external factors. Furthermore, primary research has been conducted to bet- ter understand their innovation motives innovation frequency by gathering and analyzing data from 66 individuals such as university innovation hub coordinators, entrepreneurs, and product developers.
The questions asked were a combination of qualitative and quantitative. Survey criteria used for sampling were primarily product and service develo- pers and managers of innovation hubs. This approach was selected as this category of people are continuous innovators, or part of product develo- pment teams, thus making them a prudent choice. The survey was categorized into six main features: Demographics, Government Interventions and Sup- port for Innovation, Sources of Innovation, Workforce, and Immigrants, Factors that Drive Innovation, Industry, and Life Cycle.
EUROPEAN INNOVATION ECONOMIC DOWNTURN AND GOVERNMENTAL SUPPORT Allocation of resources and government policies on critical sectors within the economy make it conducive for industries to have the confidence to expand and invest more into innovation. This can be considered as a tool for competing interests, with the scientific community to consistently argue for increased funding (Richardson et al., 2004). After the 2008 global reces- sion, Eurostat reports that many European Union (EU) economies allocated increasing resources to their Science & Technology (S&T) budgets. Before the financial crisis, only Sweden and the United Kingdom had a negative gro- wth pace compared to 12 other countries that indicated negative results after the crisis struck. In general, Science & Technology follow similar trends of government expenditure (Makkonen, 2013). Concerning budget allocation, the 2008 crisis had an adverse effect, especially on Southern European econo- mies and their counterparts Eastern European, including Ireland. However, this effect is far more significant than other EU member states.
According to the OECD, the Organisation for Economic Co-operation and Development reported the adverse effect of the economic downturn in 2008 and its impact on the banks, markets, and investors (OECD, 2013). This economic downturn made investors extremely risk-averse to secure external
Understanding Corporate Innovation Readiness and Frequency Factors 85
funding and champion innovation for local industries and firms. Further- more business becomes risk-averse due to lack of business expenditure in Research and Development (R&D) and reductions from government funding (Guellec and Ioannidis, 1999). Governments need to grow the support and provide adequate resources for S&T investments and help firms the manage the negative impacts of economic crises on innovation (Pannov, 2012).
It must be noted that the key element to come out of an economic down- turn, particularly in developing countries, is the reaction of both the private and public sectors, with significant support from the public sector. Negative political reactions during an economic crisis hamper the recovery rate; thus, when the public sector realizes that the private sector is having difficulty in addressing R&D, it is incumbent that to provide the needed support at least for a short period (Stiglitz, 1999).
Renewed and developed innovative mechanisms arise when the public sector offers incentives. The Finnish industry can be an example as it experienced an increase in productivity when knowledge-based informa- tion and communications industries replaced resource-based heavy industries as the leading sector of its national economy (Jonung et al., 2009). This did not happen overnight, but with the careful intervention by the Fin- nish government on deliberate interventions that increased the government spendings to support innovative activities after going through the econo- mic crisis in the 1990s (OECD, 2021). When the government support or allocate sufficient resources to innovation in ordinary times when a crisis arises, there is a high probability that the crisis will not have a huge impact (Makkonen, 2013).
The results of this research indicate that none from the industries stu- died directly influenced the need for product and service developers to innovate their outputs. Research and development still seem to be a quite expensive. Releasing impactful radical innovation into the market requires infrastructure, human capital, and finances. Businesses within the MSME category lack the financial strength to invest in R&D and deliver signifi- cant innovations. They prefer to imitate their competitors while making by modifying their products and services to suit their customers’ needs and expectations. They are more likely to reactively respond to the needs of their customers than to proactively produce technology that can lead into innovations.
Governments should invest much more into Micro, Small & Medium Enterprises (MSMEs) by allocating resources that encourage innovation at the base of the innovation pyramid. Additionally, large organizations should collaborate and drag MSMEs into their fold by engaging them, as suppliers or sub-contractors, and/or equipping them with the needed skills to innovate and deliver impactful innovations. There are several reasons for large organi- zations to deliberate attempt to invest MSMEs, equip them with knowledge from research and development, and build their capacity. MSMEs deal pri- marily with the average person, which is what large organizations need to directly interact when introducing new products and services.
THE SURVIVAL, MIRRORED, AND COMPULSIVE (SMC) FRAMEWORK The Survival, Mirrored, and Compulsive (SMC) framework proposed in this paper derives from the research results that identified the need for three the- oretical approaches on innovation managers whose integration becomes the SMC framework. Each theory is viewed as a phase of the framework.
The first theory from the research is the “Survival Continuity,” which can primarily be identified amongst MSMEs. It suggests that innovation is typi- cally deprioritized amongst businesses whose primary concern is to thrive in the competitive world of business and the industry in which they operate. Their existence is based on surviving the stages of recovering from losses, breaking even, and eventually making and sustaining profit. Two categories of businesses go through the Survival Continuity stage. The first notes the les- sons learned with the hope of capitalizing on them when they eventually exit the stage. Additionally, they learn from their successes and those of others in the industry and other disciplines. The second category becomes overwhel- med by the idea of survival and does not notice their surroundings and make observations. They implement many ideas to survive but take little notice of the factors that facilitated the process.
The research also proposed the theory of Mirrored Innovation. Businesses that thrive after successfully passing through the Survival Continuity phase to become financially stable tend to look at industry best practices and imitate what competitors are doing; however, the application process is not sacrosa- nct but is customized to suit the business following their financial position and more importantly, their process delivery and their customer base. Ano- ther factor that is highly considered is the culture of the market setting. As the Mirrored Innovation stage business is unable to make similar investments, it would rely heavily on user-generated content to build up its repository of vendors. It will then have a small team authenticate its information before making it accessible to its users. To cope with the rate of innovation, these businesses assess their financial position, human resource capacity, and the adoption rate of their customer base. When all these factors align seamlessly, the business proceeds to innovate.
This study also sheds light on the theory of Compulsive Innovation. This is the phase where businesses feel the urge to constantly innovate due to seve- ral factors, mainly to gain market share, gain monopolistic profits, and be industry leaders. Although there is the general urge to innovate continually, two types of businesses usually operate at this phase. The first is those that innovate more regularly, for example, every six months to once a year, and those that innovate less frequently, for instance, every 3 to 5 years.
The frequency would be based on strategic and managerial decisions based on intrinsic and extrinsic factors. Internally, leadership and human and fina- ncial resources are critical determinants of the rate to innovate. Externally, the customer base is the vital factor. That is, their ability to switch to or accept innovations would depend on whether their customer base would remain loyal through the process. Therefore, the frequency of innovation at this phase is determined by fierce competition and the drive to gain an advantage
Understanding Corporate Innovation Readiness and Frequency Factors 87
in the areas as mentioned above. If the leaders within this phase innovate frequently, other leaders would be compelled to follow suit to maintain their position or keep up.
MODELING THE SURVIVAL, MIRRORED, AND COMPULSIVE (SMC) FRAMEWORK A simple model to demonstrate the SMC framework would be helpful to conceptualize the differences between the various phases discussed.
This would help businesses to locate themselves in which phase they are in, as displayed in the model below.
Thus, let δ represent the business’s turnover for the previous year, that is y1 – y2.
Whereas y2 is the current financial year minus the 2, y1 is the current financial year minus 1. Thus, y2 in this instance will be 2021 – 2 = 2019. Y0 is always the current financial year.
If there is a reduction in revenue between y2 and y1 or y1 and y0, the results are always multiplied by −1.
For instance, if the turnover of y2 is USD 100 and y1 is USD 90, y1 will have to be multiplied by −1.
This is expressed in USD terms. Let @ represent the turnover for the current year. This is also expressed in USD terms.
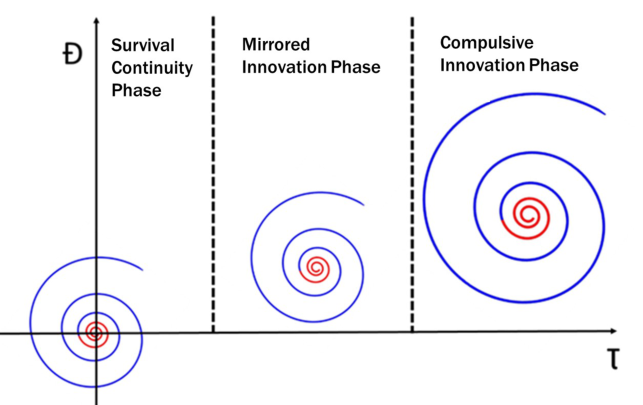
Therefore Ð= ( , @ ) However, and @ are firstly expressed as / 10n1+n2. Where n1 is always six and n2 is either 0 or +1. N2 becomes +1 whenever and or @ > 108 - 1 τ denotes the strength of the organization’s workforce on a scale of −10 to +10, denotes the loyalty of customers. Implementation of new features on a scale of −10 to +10, Therefore = (τ, ). The answers are plotted on the graph, which determines the organization’s phase and helps decide what actions needed to be done (see Figure 1).
THE DEMOCRATIC SURVIVAL, MIRRORED AND COMPULSIVE (DSCM) FRAMEWORK The SMC framework can be extended to the Democratic SMC Model (DSCM), which aligns the SMC phases with the Company Democracy Model (CDM) innovation evolution levels by relating and categorizing the SCM innovation factors to the CDM levels. This helps to understand the orga- nizational innovation DNA and the culture and philosophy that impacts the company’s human intellectual capital production frequency and the utilization frequency of this capital.
The Company Democracy Model is a Y-theory model based on the democratic knowledge elicitation in an organization for innovation com- petitiveness and extroversion (Markopoulos and Vanharanta, 2014). The model is based on establishing a democratic organizational culture where knowledge can be generated from any employee and shared with anyone in the organization. Furthermore, the model has been extended to include shared value innovation principles. Finally, it involves the society and the
Figure 1: The SCM theoretical framework.
economy (markets) for collecting, validating, and verifying knowledge that can be developed into more meaningful and valuable innovations for all (Markopoulos and Vanharanta, 2015).
The integration of the Survival, Mirrored, and Compulsive (DSMC) with the Company Democracy Models presents a practical methodology for implementing the SMC in a democratic context, as SMC relies heavily on organizational knowledge elicitations efforts.
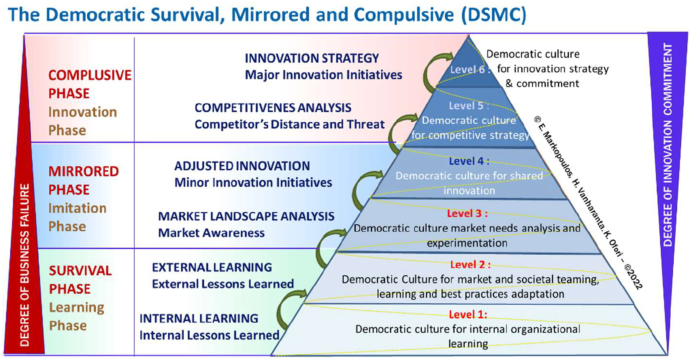
The integration between the two models is done in a paired way (see Figure 2). The Survival Phase is implemented with the first two levels of the adjusted Company Democracy Model. The Mirroring phase is implemented with levels 3 and 4, and the Compulsive phase with levels 5 and 6.
Figure 2: The democratic SCM model.
Understanding Corporate Innovation Readiness and Frequency Factors 89
The Survival phase of the SMC involves learning processes from internal knowledge, which are the organization’s employees, and external know- ledge, which is knowledge gathered to form the market, the society, and the economy, such as the clients, the suppliers, and the competitors. This know- ledge is collected and analyzed at the first two levels of the CDM. At level 1, the knowledge is gathered individually and at level 2 collectively. The- refore, at Level 1, there is a need to develop a democratic organizational culture where everyone can contribute, while at level two, a similar culture can be in place to establish thinking teams between employees and external entities.
The Mirrored phase of the SMC involves understanding the market needs and the development of minor innovation initiatives based on replication or adjustment of existing innovations, which reduce innovation costs and risk. This process can be achieved with either frugal or architectural light-form innovations. The activities of the Mirrored phase are implemented with levels 3 and 4 of the CDM. The 3rd level is based on the collective knowledge gath- ered and analyzed in level 2. This provides the input for level 3 to understand the market’s needs and proceed at level 4 with controlled innovation activities in terms of costs, human resources, and risk.
The Compulsive phase of the SCM involves the need to invest in innovati- ons due to the severe competition the organization is into practically. In such a situation, light innovation activities do not help, and there is a need for actual innovation commitment and investment. As the models target the MSMEs primarily, such decisions can be costly and risky; therefore, it is important to deeply understand the actual distance and threats from the competitors before making any decision and investment. The Compulsive phase is imple- mented with Levels 5 and 6 of the CDM. Level 5 analyses the competitors and measures the distance from what the organization has achieved at level 4 with minor innovations and the competitors’ advantages. This distance reveals the threats that form the basis of the competitiveness strategy and the innovation requirements to be implemented at level 6. Level 6 builds on the input from level 5 executes the innovation development strategy, and commercializes the results.
The time and efforts placed by an organization to move from one level to the other depending on the market threats and organizational strategy to invest in innovations even without the existence of any threat. On the other hand, MSMEs rarely invest without a severe reason other than the threat of their existence. Therefore, the integrated model is used to guide such a strategy when needed.
SMC AND DSMC METRICS AND INDEXES The efforts needed to implement the phases of the SMC and the associated levels of the DSMC can be measured by several performance metrics. Table 1 presents an initial set of such metrics, which can be developed further to track every activity of each level. The number of metrics is related to the number of activities executed in each level and the depth of their execution in terms of data collection and analysis.
Table 1. DSCM Metrics.
Table available in the original PDF paper.
SMC Phase D-CDM Level Metrics Survival Level 1: Internal Learning. Internal Lessons Learned Number of employees involved Number of ideas gathered. Validity and relativity of the ideas with company Frequency of ideas submission in time Frequency of ideas submission per person-time Level 2: External Learning. External Lessons Learned
Number of external entities involved Types of external entities involved Frequency of participation Frequency on knowledge contribution Quality of knowledge contribution Partnerships established to address common targets Mirrored Level 3: Market Landscape Analysis. Market Awareness
Survey’s and conducted to validate level 1insights Survey’s and conducted to validate level 2insights Frequency of markets research Frequency of competitors analysis Prototypes developed Prototypes testes in the market Level 4: Adjusted Innovation. Minor Innovation Activities
Number of Frugal innovation activities Number of Architectural innovation activi- ties New products/services developed Market response on the new products/se- rvices Number of clients gained Number of competitors surpassed Compulsive Level 5: Competitiveness Analysis. Competitors’ distance and threat
Number of critical partners Depth of partners analysis Strategic partnerships established Number of innovative ideas to consider Innovation readiness assessment Level 6: Innovation Strategy. Major Innovation Activities
Innovation development cost tracking Innovation technical quality tracking Commercialization strategy updates Communication and marketing strategy updates Intellectual property rights activities
LIMITATIONS AND AREAS OF FURTHER RESEARCH The two models (SMC and DSMC) presented in this paper form the basis for further research in innovation management. Researchers, academics, industry experts and practitioners are encouraged to investigate this area for future research on the socio-economic environment in which a product or service
Understanding Corporate Innovation Readiness and Frequency Factors 91
operates. The research did not look at this environment in which innovators and product developers operate to understand the impact of their innovation.
Challenges to be addressed are for example the identification of the consumption rates of innovative products, on the influence of innovative products have on other products, the social impact of innovative products to reach Pink Oceans (Markopoulos et al., 2020a), the environmental impact of innovative products to reach Green Oceans (Markopoulos et al., 2020b) their alignments with the UN 2030 alignment (Markopoulos et al., 2020c), their adaptation ability to the new market demands to maintain their com- petitiveness and on other challenges based on the level of innovation at the DSMC pyramid, and the organizational strategy of the innovator.
CONCLUSION
The research presented in this paper intends to establish some new innovation triggers and drivers. The main research question of this research was whether the industry in which a business operates influences its urge to innovate. The results indicate that although the industry in which a business operates is suitable for innovation, the desire to innovate depends on the phase at which the business is in terms of sustainability or planning. Businesses operating at the survival mode have the much less chances to strategically innovate.
The theories developed from the findings demonstrate that a business in the Survival Continuity phase feels a positive urge to continue to operate because of the support they receive from industry players. Businesses in the Mirrored Innovation phase are positively influenced by observing the activi- ties of industry players and other organizations from other disciplines. Their rate of innovation is also determined by how those they mirror in innovation. Those in the Compulsive Innovation phase are usually industry leaders. This conclusion was evident from the Literature Review. They have the financial power and the resources to innovate, seeking however the organizational culture for knowledge generation.
The integration of the SCM with CDM has been developed to help orga- nizations understand the red ocean they are into and innovate to survive or reach blue oceans, based on their commitment to follow more aggressive innovation strategies. CDM develops knowledge based organizational cultu- res for SCM to be applied effectively. In brief, both the SCM and the CDM in this work provide the DSCM, a framework through which organizations can survive in a red ocean which is mostly occupied by MSMEs and legacy MNEs that refuse to change without a serious reason.
REFERENCES
Chan, Kim W., and Renee A. Mauborgne. (2005). Blue Ocean Strategy. Boston, MA: Harvard Business Review Press. Guellec, D. & Ioannidis, E., (1999). Causes of fluctuations in R&D expenditures: a
quantitative analysis. OECD Economic Studies, 29(2), pp. 124–138. Jonung, L., Kiander, J. & Vartia, P., (2009). The Great Financial Crisis in Finland and Sweden: The Nordic Experience of Financial Liberalization. Cheltenam: Edward Edgar Publishing.
Makkonen, T., (2012). Government science and technology budgets in times of crisis.
Research Policy, 42(2013), pp. 817–822. Markopoulos E., Ramonda M.B., Winter L.M.C., Al Katheeri H., Vanharanta H.
(2020a) Pink Ocean Strategy: Democratizing Business Knowledge for Social Gro- wth and Innovation. In: Markopoulos E., Goonetilleke R., Ho A., Luximon Y. (eds) Advances in Creativity, Innovation, Entrepreneurship and Communica- tion of Design. AHFE 2020. Advances in Intelligent Systems and Computing, pp. 39–51, vol 1218. Springer, Cham. https://doi.org/10.1007/978-3-030-51626- 0_5 Markopoulos E., Kirane I.S., Piper C., Vanharanta H. (2020b) Green Ocean Strategy: Democratizing Business Knowledge for Sustainable Growth. In: Ahram T., Karwowski W., Pickl S., Taiar R. (eds) Human Systems Engineering and Design II. IHSED 2019, chapter 20, pp.115-125. vol 1026. Springer, Cham. https://doi.org/10.1007/978-3-030-27928-8_19 Markopoulos E., Kirane I.S., Gann E.L., Vanharanta H. (2020c) A Democratic,
Green Ocean Management Framework for Environmental, Social and Gover- nance (ESG) Compliance. IHIET 2020. Advances in Intelligent Systems and Computing. pp. 21–33, vol 1152. Springer, Cham. DOI: https://doi.org/10.1007/ 978-3-030-44267-5_4 Markopoulos E., Vanharanta H., (2014). ‘Democratic Culture Paradigm for Organizational Management and Leadership Strategies - The Company Democracy Model.’ In: Charytonowicz J. (ed) Advances in Human Factors and Sustaina- ble Infrastructure. 5th International Conference on Applied Human Factors and Ergonomics. vol 20. pp. 190–201. Markopoulos E., Vanharanta H., (2015). ‘Company Democracy Model for Deve-
lopment of Shared Value’, Elsevier, Procedia Manufacturing, Volume 3, Pages 603-610. OECD, (2009). OCED Website: http://www.oecd.org/dataoecd/59/45/42983414.pdf OECD, (2021). OECD Website: https://www.oecd-ilibrary.org/sites/7a7891a5-en/i ndex.html?itemId\protect$\relax=$/content/component/7a7891a5-en Paunov, C., (2012). The global crisis and firms’ investments in innovation. Research
Policy, 41(1), pp. 24–35. Stiglitz, J., (1999). Responding to economic crises: policy alternatives for equitable recovery and development. Manchester School, 67(5), pp. 409–427. Richardson, J., Matson, W. & Peters, R., (2004). Innovating science policy: Restru-
cturing S&T policy for the twenty-first century. Review of Policy Research, 21(6), pp. 809–828.
LISTED IN THE AHFE DIGITAL BOOKSTORE CATALOGUE
Explore the complete digital volume
Creativity, Innovation and Entrepreneurship
Read this individual research paper free through the original publisher, or explore the full digital proceedings book.
ISBN 978-1-958651-07-0
Explore this ISBN in the AHFE Bookstore ↗Listed in the July 2026 bookstore catalogue; search by ISBN to confirm current availability · Digital book purchase optional