Soraia Felicio, Joana Hora, Marta Maria Campos Ferreira, Camila Dangelo, Paulo Costa, Diogo Abrantes, Jorge Silva, Miguel Coimbra, Maria Teresa Galvão Dias (2021). Characterizing soft modes’ traveling in urban areas through indicators and simulated scenarios. In: Human Systems Engineering and Design (IHSED2021): Future Trends and Applications. AHFE Open Access, vol. 21. https://doi.org/10.54941/ahfe1001121
1 Faculdade de Engenharia da Universidade do Porto, Portugal ↗
2 Faculdade de Engenharia da Universidade do Porto, Portugal; INESC TEC - Institute for Systems and Computer Engineering, Technology and Science, Porto, Portugal ↗
3 Faculdade de Ciências da Universidade do Porto, Portugal ↗
5 INESC TEC - Institute for Systems and Computer Engineering, Technology and Science, Porto, Portugal; Faculdade de Ciências da Universidade do Porto, Portugal ↗
Nowadays, online route planners for soft modes are provided by several platforms such as Google Maps, OpenStreetMap, Here, or Waze. Itineraries are usually built using Shortest Path Problem algorithms that minimize the travel time or distance. In this work, we aim to identify and quantify the main features that influence itineraries’ choice by soft modes users in urban areas, able to support multi-objective routing, using simulated scenarios. We propose a set of 21 indicators, grouped into five dimensions: Safety-Security, Comfort, Air Quality, Accessibility and Time-Distance. Another contribution of this work is the simulation of scenarios to study soft modes’ multi-objective routing within urban areas.
Human Systems Engineering and Design (IHSED 2021) https://openaccess.cms-conferences.org/#/publications/book/978-1-7923-8987-0
INTRODUCTION
The sustainability of the transport sector has been identified as a primary goal by the European Union, particularly with regard to the reduction of greenhouse gas emissions. One aspect that can significantly contribute to this goal is the promotion of soft modes usage, particularly in densified areas. Soft modes include cycling, walking, skating, or scooters (among others), either mechanical or electric. Soft modes are increasingly popular in large metropolitan areas due to their association with environmentally-friendly transportation and an active, healthy, and responsible lifestyle. The increasing use of soft modes is also associated with an attempt to reduce commuting costs in densified areas or escape mostly congested routes and streets. They are used mainly in short distances, usually the last mile.
Nowadays, several platforms such as Google Maps, OpenStreetMap, Here, or Waze provide online route planners for soft modes. Itineraries are built using shortest path algorithms which minimize the travel time or distance. However, recognizing other features to quantify soft modes’ traveling effort can lead to more sophisticated approaches in choosing urban itineraries.
In this work, we sought to identify and quantify the main features influencing the choice of urban routes by soft modes users intending to support the design of multiobjective routing in this context. The methodology adopted to identify the main features influencing the choice of soft modes routes included: focus groups designed for this purpose and literature review. This research resulted in the identification of a set of 21 indicators, grouped into the following main dimensions: Safety-Security, Comfort, Air Quality, Accessibility and Time-Distance.
Another objective of this work is to provide a way to study the influence of each feature in multi-objective routing. This objective was pursued with the construction of scenarios. Each scenario considers a road network with georeferenced data for each indicator on each street. The data for most indicators were simulated considering aspects of their statistical characterization and the available literature. Considering these scenarios a multi-objective routing using the A-star algorithm was implemented in PostgreSQL (alongside PostGIS, PGrouting, and QGIS extensions) and different weights were assigning to each feature.
The results include different routes resulting from the assignment of different weights to each feature. Future research may include studying the impact of each feature in the routes obtained.
METHODOLOGY
This section describes the methodology adopted in this work. It starts with the choice of a set of indicators, resulting from the analysis of focus groups and interviews as
Human Systems Engineering and Design (IHSED 2021) https://openaccess.cms-conferences.org/#/publications/book/978-1-7923-8987-0 described in (Abrantes et al. 2021), and supported by the literature review.
The next step aimed to calculate multi-objective routes from the set of indicators previously described. To that end, a road network was considered, represented by a digraph where the vertices refer to turning points and directed edges to directed streets. Two vertices connect each directed edge.
Considering the absence of real-world data to perform the proof of concept of this approach, we resort to scenarios simulation. Each scenario consists of a network taken from OpenStreetMap (OpenStreetMap, n.d.) framed at a defined time point (one hour in a day), to which values were assigned for each indicator on each road. Values were assigned accounting for the georeferenced variability of each indicator, the history of each indicator when available, and the expected values for the corresponding time frame. The simulated data were applied to calculate multi-objective routes following the methodology described in (Hora et al. 2021). Accordingly, each indicator was normalized to an ordinal scale of five levels. Then, the values of each dimension on each road were calculated. For each dimension, equal importance was given for all the indicators composing it. The normalized values of each dimension are then used as criteria, to which different weights are assigned for the calculation of the road cost to be considered as input for the shortest path algorithm.
The algorithm was implemented as described in (Felício et al. 2021), which includes a georeferenced approach to calculate routes using the A-star algorithm and their visualization in real-world maps.
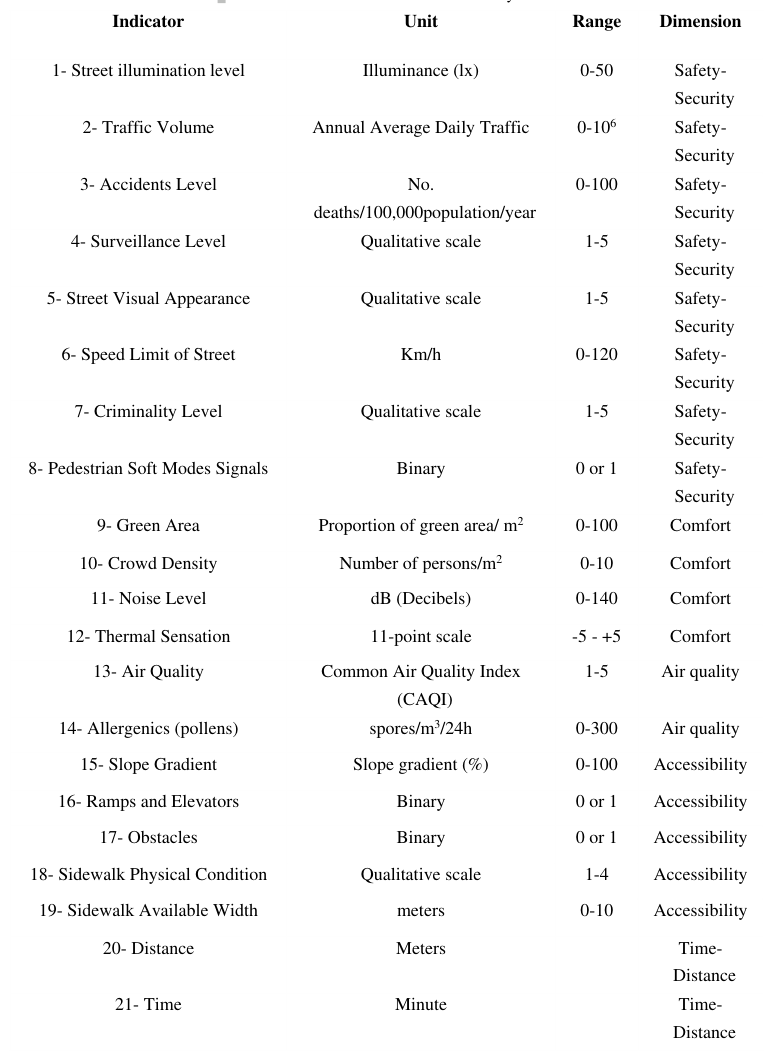
Choosing indicators to characterize soft modes' traveling This section details the set of indicators proposed in this work. The choice of these indicators results from the analysis of focus groups and interviews (Abrantes et al., 2021), and supported by literature review. Table 1 summarizes the set of 21 indicators proposed, with their description, units, range, and dimension. The following paragraphs describe each indicator alongside the corresponding literature.
The indicator Street illumination level quantifies street lighting in Illuminance (lx), which is a standard measure (Fotios and Castleton, 2016). We considered five categories of Illuminance, from very poor to very good, using thresholds aligned with the qualitative classification shown in (Fotios and Castleton, 2016). There are different approaches to quantify street lighting in urban areas, considering the presence of street lighting, the level of street lighting, or the quality of street lighting (Mattoni et al. 2017).
The indicator Traffic Volume refers to the Annual Average Daily Traffic (AADT) measure (Schroeder, 2016). Deserted streets are associated with fear, while an excess of vehicles is related to congestions and increased volumes of road accidents, noise, and air pollution. Ideal conditions revolve around not congested streets, green energy, and responsible driving behaviors, among other aspects.
Human Systems Engineering and Design (IHSED 2021) https://openaccess.cms-conferences.org/#/publications/book/978-1-7923-8987-0
The indicator Accidents Level considers the number of road traffic deaths per year per 100,000 population (i.e., from pedestrian, bicycles, car, or other vehicles accidents). This indicator was adopted in other studies such as (WHO, 2021) and (Alvarez, 2020). The Surveillance Level is a new indicator, measured with a qualitative scale accounting for i) the number of security patrols in the field per m2 (e.g., police, private security), and ii) the number of surveillance cameras per m2. Surveillance and policing are important aspects contributing for security (Nemeth and Schmidt, 2007).
The Street Visual Appearance is a new indicator using a qualitative scale which accounts for: i) amount of trash on the streets or street cleaning and ii) signs of vandalism in each street impacting the perceived sense of security such as deterioration in buildings and public space, broken glass, graffiti, inscriptions on the walls, abandoned or unoccupied areas.
The indicator Speed Limit of Street refers to the maximum speed limit in each street, which is associated with the number of pedestrian and soft modes accidents. In this work we apply the reference values from (ANSR, 2021).
The Criminality Level considers the number of crimes in each location. The Portugal 2020 Crime & Safety Report affirms which Portugal has a relatively low crime rate, but non-violent street crime is common. According to this report, petty thefts and other crimes of opportunity, e.g., vehicle break-ins, pickpocketing, surreptitious bag snatching frequently occur, particularly in the major cities (Portugal 2020, 2020). The Pedestrian and Soft Modes Signals is a new indicator considering the adequacy of road signs in each location, including signs of crosswalks, bicycle paths, or schools. Road signs adequacy is an essential aspect to prevent pedestrian and soft modes accidents. A similar but not equal indicator was used in the study of (Carter et al., 2006). The indicator Green Areas refers to the proportion of green area/m2, which is associated with the pleasantness of each zone. A similar indicator was adopted in the study (Poelman, 2021).
The indicator Crowd Density refers to the number of persons/m2. Deserted streets are related to fear; crowded streets are also associated with security and safety issues. Balanced values for this indicator may also vary depending on the location. More recently following the COVID-19 pandemic, specific values for Crowd Density have been defined, for example in (ESI, 2021). Other studies using similar indicators include (Marisamynathan and Vedagiri, 2018), (Lukowicz and Blanke, 2015).
The indicator Noise Level considers a scale between 0 and 140 dB. Many studies show the importance of sound to the comfort of humans (Corbisier., 2003).
The indicator Thermal Sensation is applied following the 11-point scale as proposed in (Enescu, 2019) ranging between -5 and+5, where -5 is intolerably cold, and+5 is intolerably hot.
Human Systems Engineering and Design (IHSED 2021) https://openaccess.cms-conferences.org/#/publications/book/978-1-7923-8987-0
The indicator Air Quality applied the Common Air Quality Index (CAQI) proposed in (Van den Elshout et al. 2008), which quantifies the exposure of citizens to different air pollutants in each location, such as NO2, PM10, O3, CO, and SO2. The indicator Allergenics assesses the exposure of allergenics in each street, including pollens and molds, with the concentration of spores by m3 in 24h as proposed by (Ianovici et al. 2011).
The indicator Slope Gradient quantifies the slope gradient (or steepness) of each street as described in (NWCG, n.d.). This indicator is most relevant for people with reduced mobility, but also very important for pedestrians and cyclists.
The indicator Ramps and Elevators identifies ramps or elevators that allow pedestrian transition in some situations: between the curb and the street at pedestrian crossings and in the vicinity of building entrances (UN, 2021). In work as (WSDOT, 2020) and (UN, 2021) treat the characteristic of this indicator to an evaluation of quality. In our work, we need to know if there are or no ramps or elevators to use this information as input of our routing algorithms. We are not interested in evaluating the characteristic of these ramps or elevators.
The indicator Obstacles includes all features that can prevent the passage of wheelchairs and prams in streets ‘sidewalks, including urban equipment such as electricity pylons, electricity boxes, parking meters, badly parked cars, among others. Some obstacles are permanent, while others are temporary. In the future, the app also can allow users to identify the barriers they cross in real-time. Thus, in our work, we consider if there is or no of this indicator.
The indicator Sidewalk Physical Condition based on the work of (Shaaban, 2019) which propose the use of field observations makes the method a more reliable and powerful tool to measure actual walkability conditions, physical Condition, for example: (1) Many cracks/breaks (2) Some cracks/breaks (3) Few cracks/breaks (4) No cracks/breaks. They developed a method that can use to accomplish several goals, including the creation of a detailed record of sidewalks and corridors and the identification of priority areas in need of improvement. Based on this study, we suppose a qualitative scale with an interval between 1 (conditions awful for sidewalk) and 4 (perfect conditions for sidewalk) to input in the routing algorithm. The indicator Sidewalk Available Width is one of the indicators developed in the work of (Shaaban, 2019). This work treats of a method that uses direct observations and street measurements to obtain a score that represents the walkability of aside walk and a score that represents the walkability of a corridor. In our study, we suppose a range between 0 and 10meters. We consider without comfort values less than 1.51 meters sidewalk wide and values greater than 1.52 meters a sidewalk width comfortable for the accessibility dimension. The indicators Time and Distance depend on the soft mode. Furthermore, the cost data in the OpenStreetMap (OpenStreetMap, n.d.) considers this indicator.
Human Systems Engineering and Design (IHSED 2021) https://openaccess.cms-conferences.org/#/publications/book/978-1-7923-8987-0
Table 1. List of indicators selected for the case study. Indicator Unit Range Dimension 1- Street illumination level Illuminance (lx) 0-50 Safety-
Human Systems Engineering and Design (IHSED 2021) https://openaccess.cms-conferences.org/#/publications/book/978-1-7923-8987-0
Case Study: scenarios simulated.
The case study considers the geographical area of the city center of Porto, Portugal. (OpenStreetMap , n.d.) provides the road network. Real network and data We used the Openstreemaps repository (OpenStreetMap, n.d.) to extract the road network for this study. We simulated and standardized the data of each indicator within an ordinal scale of five levels: very poor (0); poor (1); fair (2); good (3), and excellent (4). The indicators normalization and indexes calculation and normalization were implemented in C++. The simulation of georeferenced data was performed using PostgreSQL (PostgreSQL, n.d.) with PostGIS (PostGIS. N.d.) and pgRouting (pgRouting, n.d.) extensions. Figure 1 shows the network applied in one scenario (i.e., Cais da Ribeira at Porto, Portugal), with the streets considered highlighted in blue.
Figure. 1. Real network - Cais da Ribeira, Porto region, Portugal Routes We used the algorithm A-Star, implemented by pgRouting (pgRouting, n.d.) extension of the PostgresSQL (PostgreSQL, n.d.) for the calculus of the routes and the QGIS tool (QGIS, n.d.) to show the outcome of the routes (Felício et al. 2021). Different routes were obtained for each pair of origin and destination by considering different weights in each dimension. Two examples are shown in Figure 2. The route (a) has an overall weight of 50% to the distance indicator compared to all other indicators, while route (b) has an overall weight to the distance indicator of 0%. We note that figure (b) has the longest route related to figure (a), because we do not consider the time and distance to calculate (b), 0% to time and distance, but we consider all other indicators. On the other hand, figure (a) considers all indicators with the weight of 50% to time and distance, consequently, the route is shorter.
Human Systems Engineering and Design (IHSED 2021) https://openaccess.cms-conferences.org/#/publications/book/978-1-7923-8987-0
Figure. 2. Two routes obtained for the same pair of origin destination.
CONCLUSIONS
The methodology developed encompasses identifying 21 indicators grouped in the main dimensions: Safety-Security, Comfort, Air Quality, Accessibility and Time- Distance, intending to support multi-objective routing related to selecting urban routes, mainly using soft modes to reduce greenhouse gas emissions. Another task pursued in this work was implementing the methodology in the real-world network by OpenStreetMap, calculation using PostgreSQL with PostGIS and PGrouting extensions, and QGIS application. The contribution of this work is twofold: a) a proposal of a set of indicators characterizing urban areas regarding the most relevant aspects for traveling with soft modes, and b) a realistic scenario simulation to study the impact of each feature in the choice of itineraries.
Future work includes the collection and processing of real data for the various indicators, the research of more sophisticated methods to quantify each dimension, the gathering of data (e.g., with surveys) which can ground an improved segmentation of user groups, and the research of strategies that can enhance the user groups segmentation alongside the definition of its effort functions. Additionally, future work may include encompassing unforeseen events, which would allow avoiding geographic points or streets in real-time and allow users to include interest points to be incorporated in the route. This feature would enable avoiding unanticipated closure of a zone, road, or building (e.g., construction works, festive events, incidents). Possible techniques for this purpose include dynamic routing. There is also the possibility of assigning future research to allow the algorithm to receive information directly introduced by users. This research could improve the classification process of each user into the most suitable group of users.
Human Systems Engineering and Design (IHSED 2021) https://openaccess.cms-conferences.org/#/publications/book/978-1-7923-8987-0
ACKNOWLEDGMENTS
This paper is a result of the project Safe Cities - Inovação para Construir Cidades Seguras, with the reference POCI-01-0247-FEDER-041435, co-funded by the European Regional Development Fund (ERDF), through the Operational Programme for Competitiveness and Internationalization (COMPETE 2020), under the PORTUGAL 2020 Partnership.
REFERENCES
Abrantes, D., Ferreira, M., Costa, P., Felício, S., Hora, J., D’Angelo, C., Silva, J., Galvão, T., Coimbra, M. (2021) Considering the need for new aspects in route planners. Human Systems Engineering and Design IV Proceedings of the 4rd International Conference on Human Systems Engineering and Design (IHSED2021): Future Trends and Applications, September 23-25, 2021, University of Dubrovnik, Croatia Alvarez, M. (2020). Predicting Traffic Accident Hotspots with Spatial Data Science,
available at https://tinyurl.com/2ar3vy3x. ANSR, Autoridade Nacional de Segurança Rodoviária, (2021). Speed limits in Portugal (in km/h), available at https://tinyurl.com/4tdmczk Carter, Daniel L., Hunter, William W., Zegeer, Charles V., Stewart, J. Richard, and
Huang, Herman F., 2006. Pedestrian and Bicyclist Intersection Safety Indices: Final Report. Available at https://tinyurl.com/3pcxm8cf, accessed last time in Feb 2021. Corbisier, C. (2003). Living with noise. Public roads vol 67, nº 1. US. Departament of Transportation. Available at https://tinyurl.com/t5va295n. Enescu, D. (2019). Models and Indicators to Assess Thermal Sensation Under
Steady-state and Transient Conditions. MDPI Journal. Energies,12, 841; doi:10.3390/en12050841. Available at https://tinyurl.com/y3ydzmra Dumbaugh, E., & Rae, R. (2009). Safe urban form: Revisiting the relationship between community design and traffic safety. Journal of the American Planning Association, 75(3), 309-329. Echo Credits. An average person’s walking speed/distance. Available at
https://tinyurl.com/5snd8c, accessed last time in Fev. 2021. Eluru, N., Bhat, C. R., Hensher, D. A. (2008). A mixed generalized ordered response model for examining pedestrian and bicyclist injury severity level in traffic crashes. Accident Analysis Prevention, 40(3), 1033-1054. ESI (2021). Keep your distance! How crowd safety management can help us control
the Corona crisis. Event Safety Institute. Online article retrieved at 01/10/2020. Available at: https://www.eventsafetyinstitute.nl/en/en-blog/keep-your- distance-how-crowd-safety-management-can-help-us-control-the-corona-crisis Felício, S., Hora, J., Ferreira, M. C., Abrantes, D., Costa, P., D’Angelo, C., Galvão, T. (2021). An architecture to treat georeferenced data from the OpenStreetMap to plan routes. 24th EURO Working Group on Transportation Meeting, EWGT 2021, 8-10 September 2021, Aveiro, Portugal.
Human Systems Engineering and Design (IHSED 2021) https://openaccess.cms-conferences.org/#/publications/book/978-1-7923-8987-0
Fotios, S., Castleton, H. (2016). Specifying enough light to feel reassured on pedestrian footpaths. Leukos, 12(4), 235-243. Hora, J., Felício, S., Hora, J., Ferreira, M. C., Abrantes, D., Costa, P., D’Angelo, C.,
Galvão, T. (2021). Quantifying soft modes’ traveling effort in urban areas. 24th EURO Working Group on Transportation Meeting, EWGT 2021, 8-10 September 2021, Aveiro, Portugal. Lukowicz, Franke, T., and Blanke, P. U. (2015). Smart crowds in smart cities: real life, city scale deployments of a smartphone based participatory crowd management platform. Journal of Internet Services and Applications, 6(1), 27. Ianovici, N., Dumbrav ̆a-Dodoac ̆a, M., Filimon, M. N., Sinitean, A. (2011). A
Comparative Aeromycological Study of the Incidence of Allergenic spores in Outdoor Environment. Analele Universitatii din Oradea, Fascicula Biologie, 18(1). Lipfert, F. W., Wyzga, R. E., Baty, J. D., Miller, J. P. (2006). Traffic density as a surrogate measure of environmental exposures in studies of air pollution health effects: long-term mortality in a cohort of US veterans. Atmospheric Environment, 40(1), 154-169. Marisamynathan, S., Vedagiri, P. (2018). Estimation of pedestrian safety index value
at signalized intersections under mixed traffic conditions. Transportation in Developing Economies, 4(1), 5. Mattoni, B., Burattini, C., Bisegna, F., Fotios, S. (2017, June). The pedestrian’s perspective: How do illuminance variations affect reassurance? In 2017 IEEE International Conference on Environment and Electrical Engineering and 2017 IEEE Industrial and Commercial Power SystemsEurope (EEEIC/ICPS Europe) (pp. 1-5). IEEE. Nemeth, J., Schmidt, S. (2007). Toward a methodology for measuring the security of
publicly accessible spaces. Journal of the American Planning Association, 73(3), 283-297. NWCG. 4.5Slope. The National Wild fire CoordinatingGroup(NWCG). Available at https://tinyurl.com/4nmshupx, accessed last time in April 2021. OpenStreetMap - Maps of the world, available at https://tinyurl.com/dcnwfjbh,
accessed last time in Jan2021. OpenStreetMap Wiki - Key:width. Available at https://tinyurl.com/dn4rhfn8, accessed last time in Fev. 2021. pgRouting; available http://pgrouting.org/, accessed last time in Jan 2021. Poelman, H. A Walk to the park? Assessing access to green areas in Europe’s cities
update using completed copernicus urban atlas data; available at https://tinyurl.com/e8ct8w, accessed last time in April 2021. PostGIS; available at http://postgis.net/, accessed last time in Jan 2021. PostgreSQL; available at http://www.postgresql.org/, accessed last time in Jan 2021. Portugal 2020 Crime Safety Report. Available at https://tinyurl.com/fx5u6cwx, accessed last time in April 2020. QGIS application. availablehttps://plugins.qgis.org/plugins/QuickOSM/, accessed
last time in Jan 2021. Shaaban, K. (2019). Assessing sidewalk and corridor walkability in developing countries. Sustainability, 11(14), 3865. Schroeder, B. J. (2016). Part 2 - Transportation Planning. In D. J. Findley, B. J.
Schroeder, C. M. Cunningham and T. H. Brown, Highway Engineering, pages 17-88, Butterworth-Heinemann.
Human Systems Engineering and Design (IHSED 2021) https://openaccess.cms-conferences.org/#/publications/book/978-1-7923-8987-0
UN (2021). Report. Accessibility for the Disabled - A Design Manual for a Barrier Free Environment. United Nations enable. Available at https://tinyurl.com/58h9ej7s, accessed last time in Fev 2021. Van den Elshout, S., Leger, K., Nussio, F. (2008). Comparing urban air quality in
Europe in real time: A review of existing air quality indices and the proposal of a common alternative. Environment International, 34(5), 720-726. WHO (2018). Report. Global status report on road safety 2018. 17 June 2018.
Available at https://www.who.int/publications/i/item/9789241565684 World Heath Organization (WHO), 2021.FACT SHEET 1 Road safety: Basic facts.
Available at https://tinyurl.com/xp3nkn9u, accessed last time Mar. 2021. WSDOT Washington State Department of Transportation, September 2020, Report.
Design Manual Pedestrian Facilities, Chapter 1510. Pages 1510-1 - 1510-48. Available at https://tinyurl.com/ytf3eccc.
Human Systems Engineering and Design (IHSED 2021) https://openaccess.cms-conferences.org/#/publications/book/978-1-7923-8987-0
LISTED IN THE AHFE DIGITAL BOOKSTORE CATALOGUE
Explore the complete digital volume
Human Systems Engineering and Design (IHSED2021): Future Trends and Applications
Read this individual research paper free through the original publisher, or explore the full digital proceedings book.
ISBN 978-1-7923-8987-0
Explore this ISBN in the AHFE Bookstore ↗Listed in the July 2026 bookstore catalogue; search by ISBN to confirm current availability · Digital book purchase optional