O Buttelli, R Parry, M Jabloun, Ph Ravier, H P Ma, N Ferveur, E Lalo (2020). Methodological Considerations about Motor Activity Tracking In Real Life Settings. In: Advances in Science, Technology, Higher Education and Society in the Conceptual Age: STHESCA. AHFE Open Access, vol. 10. https://doi.org/10.54941/ahfe100395
1 Laboratory for Reliable Computing, National Tsing Hua University, Taïwan d Technologie Ergonomie Application SME rue du Bois Chêne le Loup 54500 Vandoeuvre les Nancy, France ↗
2 National Tsing Hua University, Taïwan, d Technologie Ergonomie Application SME, rue du Bois Chêne le Loup 54500 Vandoeuvre les Nancy, France ↗
We discuss the development of innovative methods for evaluating motor activity in patients with Parkinson’s disease. Incorporating both biomarkers (heart rate variability, electromyography, inertial sensors) and phenomenological components, this programme is designed for use in the patient’s home, during normal daily activities and is, as such, readily transferrable to other ergonomic applications. Our presentation will focus particularly on wireless and multi-sensor technology developed as an integrated system allowing us to collect multi-dimensional data sets. Procedures adapted for such ecological situations will be presented, including robust analysis with regard to impulsive noise and artefacts; analysis of nonstationary signals
With a view towards personalized medical solutions, the aim of the ECOTECH project is to develop innovative technology for monitoring human motor activity in real-life situations. Using an integrated approach, with multiple collaborators from biomedical, technological and human sciences, this system is designed to support a holistic approach to patient assessment. Ultimately, this tool may serve to determine risk of falls; provide accurate measures of patient response to treatment and; inform the planning of other interventions—from the use of compensatory strategies to environmental adaptation. To that end, a portable system of biosensors with onboard acquisition technology is currently under development. The integration of biomechanical and electrophysiological data in this way will be used to identify correlates between locomotor patterns (gait activity), neurophysiological activity (electrocardiogram) in daily life activities. Such methodology and technology will be transferable to (i) aging and other neurological disorders, and (ii) activity conditions impacting motor control (workplace, ergonomics applications).
Studying complexity of human activities induce different constraints for data acquisition and signal processing as well as articulation of different types of data. Compromise between number of sensors and size of equipment has to be found on pertinent criteria. Sensors have to be reduced in size and selected on their pertinence for accurate pattern recognition of motor activity. The development of automatic data processing represents a critical problem related to the large real life activities studies. Moreover, in these non-standardized conditions, data collecting leads to different problems of signal processing. Amongst these, we mention the nonstationarity of the time series data (i.e. statistical properties of a process change with time) and the disturbance of its measurement which leads to reduce the signal-to-noise ratio and generate artefacts.
Gait activity and its disturbances will be monitored by means of: kinematic sensors, combining three orthogonal gyroscopes (angular velocity), accelerometers (acceleration and tilt orientation) and magnetometers (compass) to form an inertial unit; the data fusion from these complementary sensors allows to offset and to remove the span drift by continuous correction of the position and orientation of each sensor data (Bachmann, 2000); placing inertial unit on each human body combined with radio frequency communication , it allows tracking orientation and location of these segments;
electromyography (EMG), providing a measure of the bioelectric manifestation events that controls the motor activity; this signal is sensitive to different factors including neural control strategies (recruitment/derecruitment of the functional units of the muscle) and local fatigue (Farina et al., 2004); Moreover, the relative shift of electrode with respect to the location of the active muscle fibre has to be taken into account in dynamic measurement conditions (Farina, 2006); in these condition the degree of nonstationarity of the signal is high and require proper signal processing approach when spectral analysis is planned (Merletti et al., 2004).
heart rate variability (HRV), providing information about the overall state of the organism; indeed, HRV is sensitive to the autonomic nervous system modulation and hence sensitive to different factors including health, general fatigue, exercise, stress etc. (Rajendra et al., 2006; Task Force, 1996). HRV is obtained from the measurement of the electrocardiogram (ECG) and it refers to variation of the beat intervals. In a similar way to EMG, a proper signal processing of the HRV has to be implemented: the conditions of data acquisition induce particular characteristics of the observed signals (nonstationarity, artefact etc.) which have to be taken into account in any development and application of signal processing methods.
In the present document, we briefly outline the current technology which allows the portable collection of electrophysiological data and its wireless transmission; and then beyond that we will propose methodological procedures and alternative computations of classical EMG and ECG signals processing in order to reduce the errors of the estimators extracted during dynamic conditions with the aim to automate the calculations.
THE WIRELESS PHYSIOLOGICAL SIGNAL RECORDING MICROSYSTEM
Figure 1a. is the scenario of the proposed wireless physiological signal recording microsystem. The system includes wireless sensor nodes for sensing ECG, EMG, EEG and kinematics signals, and the mobile phone or laptop for the information hub, controlling the data acquisition procedure and recording data. Figure 1b. shows the functional block diagram of the universal sensor node. The physiological signal measured from the signal probe will first be amplified (Signal Amplification), and then be filtered out signals beyond interesting bandwidth (Filter). Finally, after signal digitization (analog to digital converter, ADC), a wireless interface transmits the measured signal back to the information hub for further signal processing and recording. The sensor node is implemented configurable with tuneable amplification gain and variable filter bandwidth. A micro-controller (µP) controls the measurement procedure and parameter setting. (Lin et al., 2013; Chan et al., 2012)
Figure available in the original PDF paper.
EEG EMG ECG kinematic
μP
Signal Probe Signal, Amplification Filter
Wireless, Interface ADC
(a) (b) Figure 1. Scenario for the wireless physiological signal recording microsystem
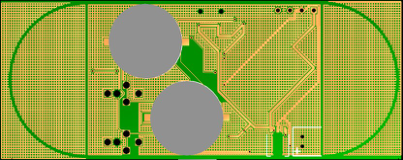
The proposed universal sensor node is implemented with a printed circuit board (PCB) for sensor node circuits and battery integration (sensor node board). Button batteries are adopted (The grey circles in Figure 2.). The form factor for one sensor node board is 8cm x 3.2cm x 0.6cm. The power consumption is about 1mW, and the sensor node can last for 3-4 hours continuous recording.
Figure 2. Implementation of the proposed sensor node (sensor node board).
ELECTROMYOGRAPHY Surface EMG is a non-invasive means (no-traumatizing and no-cumbersome) to study the neuro-muscular system. Information on coordination, force production, motor command or fatigue can be extracted about it. This is the reason why EMG is usually used within the framework of studies on human motor and in particular concerning neuromuscular fatigue. To this end, the spectral EMG analysis has been widely used. The classical parameters used to track the fatigue in the spectral domain are the mean (MNF) or the median frequencies (MDF, splits the spectrum into two parts of equal power). These parameters shift to lower frequencies during fatigue (De Luca, 1984). Technology, Higher Education and Society (2020)
However, surface EMG is a complex signal depending on many factors. That is why it is not always easy in giving a physiological interpretation, especially when EMG recording is performed during motion (dynamic contraction).
Muscle Fibre Motion During dynamic activities, many confounding factors intervene in the surface EMG generation/detection process (Merletti et al., 2004). Among them the relative shift of the muscle fibres with respect to the electrodes is not adequate to ensure a proper location of the electrode over the entire angular range of the joint. Hence, it is recommended that the electrodes be placed as far away as possible from the innervation (defined by the neuromuscular junction locations) and tendon zones (the atlas of innervation zones from Barbero et al., 2012 provides clarification on this issue). Moreover, the simple act of muscle fibres motion creates variation of the surface EMG induced by the modification of the conductivity of the tissues (Farina, 2006) and those irrespective of physiological consideration. So the first disposition is on the methodological level and it was recommended that the EMG analysis should be done with respect to the angular position of the joints (Farina, 2006). The inertial unit measurements will be supplied synchronously with those of the EMG in order to provide information concerning the positions of the body segments.
Nonstationarity The representation of the frequency domain is given by the spectrum representation. The energy distribution is plot according to the frequency domain. In order to carry out this representation, the signal recorded has to be transformed from a temporal function to a frequency function. The power spectra density (PSD) of the EMG signal (energy distributed mainly in the 20-300 Hz band) can be computed using different transform methods. The most popular is the Fourier transform (FT). This method gives a perfect frequency resolution as it supposes a window analysis infinite in length (in practice, the entire length of the signal of interest). The counterpart of the FT is a loss of the time information. Hence, this method is most suitable when assessing stationary signal. Assumption that is not satisfied for EMG recorded during dynamic contraction. A high degree of nonstationarity of the EMG signal was reported in this condition (Merletti et al., 2004). That is why joint time-frequency analysis methods were developed to track the modification of the frequency content. The first proposition has to be carry out by Gabor (Gabor, 1946) developing the short time Fourier transform (STFT) a method derived from the FT. The former divided the long term signal into small enough segments using narrow analysis windows to ensure a wide-sense stationarity holds inside the segments. However, this window function introduces a problem that refers to the Heisenberg uncertainty principle. Indeed, the window function has a finite length. A broad window of analysis will support the frequency resolution and will disadvantage the temporal resolution and conversely with a small window of analysis. This terminology can be misleading. The principle of Heisenberg does not describe a limitation to our knowledge of reality; it describes reality. The more one function is concentrated on a narrow band of time, the more the frequency band given by its transform of Fourier is broad; the more the frequency band of a transform of Fourier is restricted, the more the function is extended in time. The former will give an adequate representation of high frequencies and the latter of low frequencies. This means that it would be interesting to have a transform method which adapts its analysis window to the analyzed frequency band. This property is proposed by the wavelet transform method. The wavelet transform acts as a “mathematical microscope” in which one can observe different parts of the signal by just adjusting the focus (Karlsson et al., 2000).
The wavelet transform constitutes an alternative to the time-frequency analysis suggested by Gabor. It has the advantage of not requiring an assumption on the stationary nature of the analyzed signal. The wavelet term defines small waves through which the signal to be analyzed will be observed. These small waves break up the analyzed signal at the same time into time and frequency. The principle of this analysis proposed by Morlet (Grossmann and Morlet, 1984), instead of keeping fixes the size of the window and to vary the number of oscillations inside this window (principle of the STFT), it is to keep constant the number of oscillations and to vary the size of the wavelet, by dilating it or by compressing it. Dilatation of the wavelet causes to stretch the oscillations, therefore leads to lower their frequency; compression causes to contract the oscillations, therefore leads to higher frequencies. Morlet could then locate the high frequencies with the compressed wavelet, and study the low frequencies with the stretched wavelet (Figure 3: Wavelet shown in white color). This means that he obtained a finer temporal resolution and a less frequency resolution for the high frequencies and conversely for the low frequencies. These results thus took into account the nature of the analyzed frequency ranges. This approach is called continuous wavelet transform (CWT).
The use of the wavelet transform, in the field of the study of the bioelectric signals, starts from the beginning of the years 1990 (see the tutorial by Samar et al., 1999). Since the studies by Sparto et al. (1997) and Xiao and Leung (1997), this technique was applied by various authors for the study of EMG signal (Arikidis et al., 2002; Bercier et al., 2009; Conforto et al., 1999; Karlsson et al., 2000; Panagiotacopulos et al., 1998;). Other methods make it possible to calculate time-frequency distributions; such as the STFT, the Pseudonym Wigner-Ville, or the Choi- Williams. However, the comparative study by Karlsson et al. (2000) has reported a statistical decreased performance for these latters compare to the CWT.
The continuous wavelet transform (CWT) of the signal x(t) is defined by: CWT x(a,b)=∫x(t)ψa,b ❑(t )dt a>0 a represents the scale factor which allows to compress (a>1) or dilate (a<1) the wavelet, b represent the factor of translation which makes it possible to define the moment of analysis on the time series x(t), ψa, b(t) is obtained by applying the translation and scale factors to the wavelet mother ψ(t).
The problem with the wavelet transform is the parameter setting of the mother wavelet. Indeed, there exist many families of wavelets and each one can be parameterized in various manners (Samar et al., 1999). Following the choice of the wavelet family, the baseline characteristics of the mother wavelet have to be defined, i.e. the number of oscillations and the time-base setting. These points have been examined by the following example comparing the wavelet results with those of the STFT.
sEMG recording was detected from the right vastus lateralis muscle by means of electrodes with 5-mm interelectrode distance in bipolar configuration during a cycling exercise. EMG signal was amplified and sampled at 2000 Hz. Two burst sEMG activities were analyzed (Figure 3.). The choice of the wavelet and the baseline characteristics for analysis EMG were carried out in an empirical way with a “comparable” parameter setting between the two methods (CWT and STFT). The STFT analysis was conducted using two different windows, one sets at 400 samples (i.e. 400/2000 = 200 ms) and a second sets at 100 samples (i.e. 50 ms), the time-frequency spectrogram results were presented in the figure 4. The CWT was conducted as described by Karlsson and Gerdle (2001). Wavelet analysis was performed using the complex Morlet wavelet (MATLAB Wavelet toolbox) with two different designs. One first mother wavelet sets at 120 Hz oscillation and 200 ms time-base and a second sets at 100 Hz oscillation and 50 ms time-base, the time-frequency scalogram results were presented in the Figure 5. From the results of the time-frequency images, the median power frequency (MDF) was computed for each of the two burst EMG activities and the results were presented in the figure 6.
Figure 3. Representation of the vastus lateralis raw sEMG (two bursts) during a cycling exercise.
Figure available in the original PDF paper.
300
250
200
150
100
frequency (Hz)
50
0.2 0.4 0.6 0.8 1 1.2 1.4 1.6
300
250
200
150
frequency (Hz)
100
50
0.2 0.4 0.6 0.8 1 1.2 1.4 1.6
time (s)
Figure 4. Time–frequency image computed using the Short Time Fourier Transform from the 2 bursts of the vastus lateralis sEMG; two window functions were used, one sets at 200 ms (upper panel) and a second one at 50 ms (lower panel); energy is coded by the color scaled (from dark blue to dark red colors, energy increases)
300
250
200
150
frequency (Hz)
100
50
0.2 0.4 0.6 0.8 1 1.2 1.4 1.6
300
250
200
150
100
frequency (Hz)
50
0.2 0.4 0.6 0.8 1 1.2 1.4 1.6
time (s)
Figure 5. Time–frequency image computed by mean of the wavelet transform from the 2 bursts of the vastus lateralis sEMG; the analyzing function is the complex Morlet wavelet with two different designs: upper panel, the mother wavelet is set at 120 Hz oscillation and 200 ms time-base; lower panel, 100 Hz oscillation, 50 ms time-base; the white lines are some illustrations of various scales of wavelet; energy is coded by the color scaled (from dark blue to dark red colors, energy increases)
140
120
100
80
60
40
Median frequency (Hz)
0.2 0.4 0.6 0.8 1 1.2 1.4 1.6 20
140
120
100
80
60
40
Median frequency (Hz)
0.2 0.4 0.6 0.8 1 1.2 1.4 1.6 20
time (s) Figure 6. Median frequency kinetics of the vastus lateralis sEMG, during the two burst activities; calculated from the PSD of the STFT and the CWT (blue and red, respectively); upper and lower panels with a corresponding larger and shorter windows/time- base, respectively. Technology, Higher Education and Society (2020)
Comparing the upper and lower panels of the Figure 4, the frequency resolutions decreased while the time resolutions increased (from upper to lower panels), using the narrowest window function of the STFT. Such is the case with the narrowest base-time of the mother wavelet (Figure 5, from upper to lower panels). This leads to a greater kinetics of the MDF (Figure 6, from upper to lower panels). Comparing the STFT and the CWT for “close” sizing, MDF from the CWT usually expressed higher kinetics (Figure 6). These differences can be explained by the varying scale in the CWT procedure with respect to the frequency domain which is not the case with the STFT procedure. The delicate stage of the CWT is the choice of the type of the mother wavelet. In practice, the choice will be based on the similarity in the shape of the signal of interest and those of the mother wavelet. The second stage is the setting of the mother wavelet, the oscillation frequency and its time-base. This step has been carried out in an empirical way taking into account the temporal duration of the burst EMG activity and the frequency range of the signal.
HEART RATE VARIABILTY The variation in the time interval between consecutive heartbeats of electrocardiogram is referred to as the heart rate variability (HRV) and is controlled by the autonomic nervous system (ANS): the parasympathetic (vagal nerve) and the sympathetic branches. The skilful linkage to these both branches is defined as the sympathovagal balance. Hence, the HRV is a useful means of studying the cardiac adjustment. It provides information about the ANS’s status which is dependent on numerous factors such as health/disease, stress, exercise/rest, posture (seat, supine, tilt) (Rajendra Acharya et al., 2006; Taks Force, 1996). These two ANS activities can be dissociated in respective frequency domains with the parasympathetic branch in the high frequency domain (HF) and the both branches in the low frequency domain (LF) (Pagani et al., 1986). The parametric (model based) power spectrum estimation is one of the classical methods to study the frequency domains of the HRV (Task Force, 1996), as it allows smoother spectral component of preselected frequency bands with easy identification of each HRV components (HF and LF bands). This reference method has been compared with other methods developed and designed to circumvent the problem raised by the R-R signal.
Noise and Artefact Bioelectrical signals (electrocardiogram, electromyogram and electroencephalogram) are recorded through an acquisition chain starting with electrodes placed on the skin delivering a signal which is amplified. These two-steps are especially sensitive to noise. Indeed, the contact between electrodes and skin may vary and in fact can lead to fluctuation in the electric impedance and the electronic circuitry used produces its own noise of which the amplifier is the most important (Ortengren, 1996). The former generate higher noise in natural motion (i.e. dynamic motion). That is why the R-R signal is often polluted by impulsive noise and artefacts due to ectopic heartbeats (unevenly sampled or/and missing data). Therefore, it is relevant to develop robust processing to such artefacts for a monitoring device purpose. A non-linear signal transformation called the phase-rectified signal averaging (PRSA) was proposed to circumvent this problem in (Bauer et al., 2006), later applied to the electroencephalogram signal for a time-frequency representation (Jabloun et al., 2009) and proposed to analyse the modification of the HRV during the stand-test (Jabloun et al., 2010). PRSA provide a higher sensitivity for detecting dominant frequencies because it is designed to eliminate non periodic components, to cancel artefacts and to reduce impulsive noise.
In order to observe these properties we have simulated signal. This latter is generated following typical spectra that approximately match the PSD at supine rest condition as defined in the study by Mateo and Laguna (2000). A very low frequency trend, additive white Gaussian noise and impulsive noise are then added to the simulated signals in order to obtain realistic artificial R-R signals (Figure 7A.). The PRSA spectra result (Figure 7C.) was compared to those with Yule-Walker AR PSD estimate (Figure 7B.). All spectra were normalized to have a total energy equal to one. From the PRSA spectrum Figure 7c, one can observe that the significant higher power is located in the HF band (above 15 Hz) compared with the LF band (below 15 Hz). This result gives a well-established knowledge background which sets out a sympathovagal balance emphasized greater parasympathetic activity compared with sympathetic activity during supine position (task force 1996), while AR method highlighted this sympathovagal responses to a lesser extent. The advantage of the PRSA method is given by its ability to cancel non-periodic components, noise and especially impulsive noise thanks to its averaging process and its phase synchronization
(Jabloun et al., 2010).
1200
1100
RR (ms)
(A)
50 100 150 200 250 300 350 400 450 500 1000
Samples
0.04
0.02
PSD
(B)
0 0.1 0.2 0.3 0.4 0.5 0
Frequency (Hz)
0.1
(C)
PRSA spectrum
0 0.1 0.2 0.3 0.4 0.5 0
Frequency (Hz)
Figure 7. HRV signal analysis (A) Simulated R-R signal composed of 500 samples embedded in an additive white Gaussian and a very low frequency trend and impulsive noise; (B) the parametric PSD estimation; (C) the spectra of PRSA estimation Frequency Band Analysis
Figure available in the original PDF paper.
The other difficulty encountered in the frequency-domain processing of the R-R heartbeats interval is the fact that the LF and HF bands are predeterminated with a fixed frequency ranges. However, different ranges of these frequency bands have been reported in the literature. Particularly the LF band which has been set up at 0.01–0.15 Hz (Novak et al., 1993), 0.02–0.15Hz (Cerutti et al., 1995), 0.03–0.15 Hz (Malarvili et al., 2007), 0.04–0.15 Hz (Malik et al., 1996), 0.045–0.15 Hz (Pichon et al., 2004) or 0.05–0.15 Hz (Naidu, 2005) and depends of the population being studied and the data collection requirements. Moreover, in the study by Lewis et al. 2007, it has been reported that the upper boundary of the HF band during exercise activity increased with the exercise intensity. It can be noted that the only permanent threshold is the 0.15 Hz crossover frequency between the LF and HF bands. That is why classical rigid frequency cutting to estimate these frequency bands could be less relevant than adaptive method like the Gaussian shape mixture estimation procedure (CGM) proposed by Daoud et al. (2013). This point has been examined by the following example comparing the Rigid cutting estimation with those of the CGM.
Methods were compared from real ECG data recorded during a mere stand-up position without specific activity. From the ECG, the R peaks have been extracted (Figure 8A.) by means of the Hamilton and Tompkins procedure (1986). The time-frequency estimation (Figure 8B.) was conducted computing a STFT. The power estimation of the LF and HF were computed using the Rigid Cutting (Figure 8C) and the CGM (Figure 8D) methods.
950
(A)
40 60 80 100 120 140 160 180 200 650
(B)
0.5
R-R (ms) Freq (Hz)
40 60 80 100 120 140 160 180 200 0
500
(C)
PHF (AU)
40 60 80 100 120 140 160 180 200 0
3000
(D)
1500
PLF (AU)
40 60 80 100 120 140 160 180 200 0
Time (s)
Figure 8. (A) R-R intervals, recorded during a stand-up position without movement; (B) the Power Density Spectrum estimated by STFT, the white line represents the HF-LF limit at 0.15 Hz; (C) HF power estimated (P HF arbitrary unit); (D) LF power estimated (PlF arbitrary unit); black and red lines represent the values computed by mean of the rigid cutting and CGM methods, respectively It can be noticed, even in a stand-up position without specific activity, that HF and LF band reflect variations of the power. For example, a marked energy increase and then decrease can be observed in the time region of 140 s (Figure 8B, C and D). The CGM method seems to be most appropriate than the classical rigid cutting. Indeed, CGM seems to better monitor these variations as it is shown in the figure 8C, with greater kinetics behaviour from the CGM results than the rigid cutting. This assertion has been supported by the simulated study by Daoud et al. (2013)
Figure available in the original PDF paper.
CONCLUSION
In the light of onboard and wireless technologies progress it is able to collect large and diverse data during daily life activities. This allows designing experimental devices which have been previously available only under laboratory conditions. However, collecting data under real life conditions, various signal issues will occur including nonstationarity, noise and artefacts. Hence, it is essential to develop relevant signal processing that take the constraints mentioned earlier into account. Moreover, despite improving the signal processing, interpretation of electrophysiology data will remain a complicated task. Indeed, many factors contribute to the electrophysiological signals and part of them cannot be controlled under nonstandardized condition of data acquisition. It is therefore necessary to require the cross-referring data from biomarkers with direct observations such as that from ethnographic approach.
ACKNOWLEDGMENTS
The French and the Taiwanese National Agencies for research support the present project (EcoTech) by grants provided to the CR-ICM Lab, PRISME Lab, TEA SME and NTHU University, respectively.
REFERENCES
Arikidis, N., Abel, E., Forster, A. (2002), “Interscale wavelet maximum: a fine to coarse algorithm for wavelet analysis of the EMG interference pattern”, IEEE TRANS. BIOMED. ENG. Volume 49 pp 337-344 Bachmann, E.R. (2000), “Inertial and magnetic angle tracking of limb segments for inserting humans into synthetic
environments”, PhD thesis in: Computer Science, the Naval Postgraduate School Barbero, A., Merletti, R., Rainoldi, A. (2012), Atlas of Muscle innervation Zones, Springer Bauer, A., Kantelhardt, J., Bunde, A., Barthel, P., Schneider, R., Malik, M., Shmidt, G. (2006), “Phase rectified signal averaging detects quasi-periodicities in nonstationary data”, PHYSICA A. Volume 364 pp. 423–434 Bercier, S., Halin, R., Ravier, Ph., Kahn, J.F., Jouanin, J.C., Lecoq, A.M., Buttelli, O. (2009), “The vastus lateralis
neuromuscular activity during all-out cycling exercise”, J. ELECTROMYOGR. KINESIOL. Volume 19 pp. 922-930 Cerutti, S., Bianchi, A.M., Mainardi, L.T. (1995), “Spectral analysis of heart rate variability signal”, in: Heart rate variability, Malik, M., Camm, A.J. (Eds.). Armonk, NY: Futura Publishing Compagny. pp. 63–74 Chan, C.C., Chou, W.C., Chen, C.W., Ho, Y.L., Lin, Y.H., Ma, H.P. (2012), “Energy Efficient Diagnostic Grade Mobile ECG
Monitoring”, NEWCAS. pp. 153-156 Conforto, S., D'Alessio, T., Pignatelli, S. (1999), “Optimal rejection of movement artefacts from myoelectric signals by mean of a wavelet filtering procedure”, J. ELECTROMYOGR. KINESIOL. Volume 9 pp. 47-57 Daoud, M., Ravier, Ph., Harab, R., Jaboun, M., Yagoubi, B., Buttelli, O. (2013), “HRV spectral estimation based on constrained
Gaussian modeling in the nonstationary case” BIOMED. SIGNAL PROCESS. CONTROL. Volume 8 pp. 483-490 De Luca, C.J. (1984), “Myoelectrical manifestations of localized muscular fatigue in humans”, CRIT. REV. BIOMED. ENG.
Volume 11 pp. 251–279 Farina, D. (2006), “Interpretation of the surface electromyography in dynamic contractions”, Exerc. Sport Sci. Rev. Volume 34 pp. 121-127
Farina, D., Merletti, R., Enoka, M. (2004), “The extraction of neural strategies from the surface EMG”, J. APPL. PHYSIOL.
Volume 96 pp. 1486-1495 Gabor, D. (1946) “Theory of communication”, J. IEE. Volume 93 pp. 429–457 Grossmann, A., Morlet, J., (1984), “Decomposition of hardy function into square integrable wavelets of constant shape”, SIAM J. MATH. Volume 15 pp. 723-736 Hamilton, P.S., Tompkins, W.J. (1986), “Quantitative investigation of QRS detection rules using the MIT/BIH arrhythmia
database”, IEEE TRANS. BIOMED. ENG. Volume 33 pp. 1157–1165 Jabloun, M., Ravier, Ph., Buttelli, O. (2010), “Phase-rectified signal averaging method applied to heart rate variability signals for assessment of the changes in sympathovagal balance during rest and tilt” Proceeding of the 18th European Signal Processing Conference, Aalborg Jabloun, M., Zaen, J.V., Vesin, J.M. (2009), “Time-frequency analysis based on the phase-rectified signal averaging method”,
Proceeding of the 17th European Signal Processing Conference, Glasgow. Karlsson, S., Yu, J., Akay, M. (2000), “Time-frequency analysis of myoelectric signals during dynamic contraction: A comparative study”, IEEE TRANS. BIOMED. ENG. Volume 47 pp. 228-238 Karlsson, S., Gerdle, B. (2001), “Mean frequency and signal amplitude of the surface EMG of the quadriceps muscles increase
with increasing torque, a study using the continuous wavelet transform”, J. ELECTROMYOGR. KINESIOL. Volume 11 pp. 131-140 Lewis, M.J., Kingsley, M., Short, A.L., Simpson, K. (2007), “Influence of high-frequency bandwidth on heart rate variability analysis during physical exercise”, BIOMED. SIGNAL PROCESS. CONTROL. Volume 2 pp. 34–39 Lin, Y.P., Chiu, H.C., Huang, P.Y., Wang, Z.Y., Cheng, H.H., Huang, P.C., Tang, K.T., Ma, H.P., Chen, H. (2013), “An
Implantable Microsystem for Long-term Study on the Mechanism of Deep Brain Stimulation”, IEEE BIOCAS. pp. 274–277 Malarvili, M.B., Mesbah, M., Boashash, B. (2007), “Time–frequency analysis of heart rate variability for neonatal seizure detection”, EURASIP JOURNAL ON APPLIED SIGNAL PROCESSING. Issue 1 pp. 103 Malik, M., (1996), “Heart rate variability: standards of measurement, physiological interpretation, and clinical use”,
CIRCULATION. Volume 93 pp. 1043–1065 Mateo, J., Laguna, P. (2000), “Improved heart rate variability signal analysis from the beat occurrence times according to the IPFM model”, IEEE TRANS. BIOMED. ENG. Volume 47 pp 985–996 Merletti, R., Farina, D., Rainoldi, A. (2004), “Myoelectric manifestations of muscle fatigue”, in: Muscle Strength Kumar S (Ed.)
CRC Press Naidu, V.P.S. (2005), “time–variant analysis of heart rate time series by Morlet Transform technique”, BIOMEDICAL ENGINEERING DIVISION. IIT Madras January. Novak, V., Novak, P., de Champlain, J., Le Blanc, A.R., Martin, R., Nadeau, R. (1993), “Influence of respiration on heart rate
and blood pressure fluctuations”, J.APPL. PHYSIOL. Volume 74 pp. 617–626. Ortengren, R. (1996) “Noise and artefacts”, in: Electromyography in Ergonomics, Kumar S and Mital A (Eds) CRC Press Pagani, M., Lombardi, M.F., Guzzetti, S., Rimoldi, O. , Furlan, R., Pizzinelli, P., San-drone, G., Malfatto, G., Dell’Orto, S., Piccaluga, E., Turiel, M., Baselli, G., Cerutti, S., Malliani, A. (1986), “Power spectral analysis of heart rate and arterial pressure variabilities as a marker of sympathovagal interaction in man and conscious dog”, CIRC. RES. Volume 56 pp. 178–193 Panagiotacopulos, N., Lee, J., Pope, M., Friesen, K. (1998), “Evaluation of EMG signals from rehabilitated patients with lower
back pain using wavelets”, J. ELECTROMYOGR. KINESIOL. Volume 8 pp. 269-278 Pichon, A.P., De Bisschop, C., Roulaud, M., Denjean, A., Papelier, Y. (2004), “Spectral analysis of heart rate variability during exercise in trained subjects”, J. MED. SCI. SPORT EXERCISE. Volume 36 pp. 1702–1708 Rajendra Acharya, U., Paul Joseph, K., Kannathal, N., Choo Min Lim, Jasjit Suri, S. (2006), “Heart rate variability: a review”,
MED. BIOL. ENG. Volume 44 pp. 1031-1051 Samar, V., Bopardikar, A., Rao, R., Swartz, K. (1999), “Wavelet analysis of neuroelectric waveforms: A conceptual tutorial”, BRAIN AND LANGUAGE. Volume 66 pp. 7-60 Sparto, P., Jagadeesh, J., Parnianpour, M. (1997), “Wavelet analysis of electromyography for back muscle fatigue detection
during dynamic constant-torque exertions”, BIOMED. SCI. INSTRUM. Volume 33 pp. 82-87 Task Force (1996), “Heart rate variability: standards of measurement, physiological interpretation and clinical use”, EUR. HEART J. Volume 17 pp. 354–381 Xiao, S., Leung, S. (1997), “Muscle fatigue monitoring using wavelet decomposition of surface EMG”, BIOMED. SCI. INSTRUM.
Volume 34 pp 147-152
LISTED IN THE AHFE DIGITAL BOOKSTORE CATALOGUE
Explore the complete digital volume
Advances in Science, Technology, Higher Education and Society in the Conceptual Age: STHESCA
Read this individual research paper free through the original publisher, or explore the full digital proceedings book.
ISBN 978-1-4951-2110-4
Explore this ISBN in the AHFE Bookstore ↗Listed in the July 2026 bookstore catalogue; search by ISBN to confirm current availability · Digital book purchase optional