Azar Shahgholian, Razvan Muscalu, Babis Theodoulidis (2020). The Impact of Social Networks of SP1500 Companies Vision on Environmental Governance. In: Advances in Science, Technology, Higher Education and Society in the Conceptual Age: STHESCA. AHFE Open Access, vol. 10. https://doi.org/10.54941/ahfe100375
Recently we are witnessing an increasing consensus among corporate leaders that any decision model for a successful business should link to the climate change. On the other hand, existing research works indicate that social networking affects the way companies make decisions in relation to their performance. This paper explores the effects of social networking characteristics among companies and the characteristics of board of directors on environmental governance. Our paper looks at the extent by adopting data mining techniques that comprehensively discover the effects for a sample of SP1500 companies in year 2010. Our analysis shows that this relationship indeed exists. More specifically, we show that companies that are highly inter-connected tend to have formal structures for environmental governance, such as: pay as well as non-monetary incentives related to climate change, environment-responsible committees, voluntary climate change communications, and publishing of climate change reports. In addition, companies who are highly connected tend to have larger boards of directors comprising of more independent directors. The positive outcome of this evaluation clearly demonstrates the direct and indirect power of information flow provided by social network characteristics on environmental governance.
Most activities of companies are associated with the growing level of multiple direct and indirect impacts on the envi- ronment. Many companies adhere to the environmental standards as part of their corporate agenda to manage their impacts in this regard. Since companies are multidimensional, various factors are involved in improving environmen- tal management and achieving environmental objectives.
Corporate governance is central in building long term relationships with investors, customers, shareholders, value chain members and suppliers. Therefore, most companies have focused on having a high level of corporate gover- nance. Corporate governance is not just about attaining companies’ financial objectives, but also about representing good corporate environmental performance. Roughly 60 percent of public companies have set up dedicated board committees to oversee issues related to sustainability (Hall & Cruse, 2011). We propose that companies’ activities on environmental sustainability also depend on decisions made by the board of directors. This is the board of directors who consider and frame environmental issues in relation to firm performance. Therefore, board’s strategic plans re- lated to environmental sustainability are mostly dependent on skills, access to information and expertise of board’s member.
In recent years, there has been an increasing interest in examining the relationship between environmental perfor- mance and financial performance of companies (Ameer & Othman, 2012)(Fujii, Iwata, Kaneko, & Managi, 2013). Apparently, it is becoming increasingly difficult to ignore the role of board of directors in companies due to the im-
pact of their decision on various companies’ activities and performance. There is an unambiguous relationship be- tween profile of board of directors and companies’ performance (Palmberg, 2012)(Zahra, 1989)(Dunn & Sainty, 2009) on the one hand and between challenging relationship between profile of board of directors and environmental performance of companies on the other hand (Ienciu, Popa, & Ienciu, 2012). The behavior and decision making process of boards can be influenced by formal and informal relationships between companies and their directors. Al- though a director (and collectively a company) may be able to choose who they are directly connected to, the actual social network position resulting from these connections e.g. ‘connectedness’ is dependent not only on the individ- ual’s director connections, but also on who their connections are also connected to. This prior literature investigates mainly the implications of director social links on the company performance and governance, focusing on the poten- tial costs of connections but also on their potential benefits as they create social networks between companies; and ar- gue that these networks facilitate easier access to a wider range of information at lower costs while at the same time, improving its quality, relevance and timeliness (Adler & Kwon, 2002).
Past academic research on corporate environmental management is scarce and, to date, very few academics have stud- ied the effect of social networks for corporate governance and even less the impacts of social networks over environ- mental performance. From the literature, Walls and Hoffman are pioneers in this domain area (J. Walls & Hoffman, 2013). Their main attempt is to investigate the linkage between environmental management literature and organiza- tional scholarship. In their study, they point out on behavioral governance by considering the roles of board experi- ence and social networks as a mechanism of governance that go beyond traditional agency theory consideration. They are developing an area of environmental governance that is uncovered by the complex role of board of directors. Our paper attempts to find positive correlations between profile of board of directors, social networks of companies and environmental governance characteristics. Our study contributes to a number of streams of literature. The first contri- bution of our work is examining environmental governance by understanding the role of boards in environmental and social outcomes which may be in conflict with firm financial goals and agency theory prediction (J. L. Walls, Berrone, & Phan, 2012). Our second contribution is applying social networks theory (Wasserman & Faust, 1994) (Network & Analytics, 2011) on companies and their directors. Therefore, we focus on whether the social networking of companies’ directors has an impact on the adoption of environmental governance and reporting practices. This study also investigates the environmental reporting and voluntary communications to establish whether the climate- change boards are active or not and use this classification as the basis of the clustering analysis. In this research we are taking into consideration not only the total compensation paid to the board, but also we are investigating the in- centives that companies are paying for management of climate change issues.
The remaining of the paper is organized as follows. The next section provides discussion of the relationship between information extracted from social networks with firm performance and environmental governance. Section 3 dis- cusses the methodology employed in this study. Section 4 presents the analysis and results. Finally, section 5 con- cludes the paper and describes potential areas for further research.
PREVIOUS WORK Recent developments in the field of company performance have led to a renewed interest in examining the role of board of directors in companies (Ienciu et al., 2012)(J. L. Walls et al., 2012)(J. Walls & Hoffman, 2013). The struc- ture of board as well as knowledge and expertise of their directors are essential features to achieve company objec- tives. Moreover, it is becoming difficult to ignore the connection between managers and directors to the extensive so- cial network. It could build up through working in present or in the past together, connecting with a school alumni network or being member in various non-profit organizations and committees. All these type of contacts will provide an informal knowledge flow among individuals which has indirect effects on board decision making (Fracassi & Tate, 2011)(Brown, Gao, Lee, & Stathopoulos, 2012).
It has been discussed in previous research that the board of directors is the highest authority in the firm decision mak- ing process. Thus, it is important to understand how decisions are made at the board level and what the most relevant factors are to the board’s decision. The theoretical foundation of performance is based on the idea that the structure of social interactions enhances or constrains access to valued resources (Brass, 1984). Resources exchanged through in- formal networks have substantial value, including work-related resources of task advice and strategic formation. It is necessary to identify and explain the connection between the organization's strategic objectives, the market and social context within which the business operates, the relationships on which it depends, and the governance, bonuses and rewards. Further, it should explain the connection between delivery of the business's strategy and its financial and non-financial performance.
Environmental performance is the outcome of a company’s decisions that influence its impact on the environment. Due to the fact that company’s activities vary across sectors and subsectors, environmental management depends on companies’ resources, activities, restrictions, environmental initiatives and regulations. Several attempts have been made to investigate the relationship between corporate governance and their respective interactions to environmental performance. Walls et. al. (2012) also study environmental performance and briefly touches social networks in a study concerning the link between corporate governance and corporate environmentalism. The social networking di- mension is internal to executive boards as it is measured through board independence (number of outside directors over total directors), while the environmental performance dimension is calculated through reported environmental strengths (strategic capabilities to improve environmental performance) and concerns (pollution levels). They find that environmental performance is highest when boards are less independent combined with high incentive schemes. Moreover, they have shown in their research that companies with higher CEO pay generally do less well environmen- tally (J. L. Walls, Berrone, & Phan, 2012). Environmental reporting formed the central focus of a study by Ionel-Alin et. al. (Ienciu, Popa, & Ienciu, 2012) in which the authors found that good corporate governance practices explain the voluntary environmental reporting. The size and structure of board of directors and existence of board committees have been used to determine the level of environmental reporting. Significant attention has been paid to the relation- ship between information disclosure and transparency and improved management (Matisoff, Noonan, & O’Brien, 2013). We are witnessing increasing interest in corporate governance in early 2000s and consequently, the dawn of new standards of accountability for board of directors of U.S public firms, ranging from board structure to board atti- tudes toward transparency (e.g. improving disclosure on environmental matters) (de Villiers, Naiker, & van Staden, 2011). One of the initial missions of the board is to monitor the activities of the company and its management. Appar- ently, evidence from agency theory-based studies suggests that independent directors are more likely to effectively monitor and evaluate management and firm performance when they offered incentives to do so (de Villiers et al., 2011)(Hillman & Dalziel, 2003).
Recently, there have been recorded a growing number of empirical-based papers using social networks to explain management behavior and/or financial outcomes (Fracassi, 2009)(Hwang & Kim, 2009)(Schonlau & Singh, 2009)(P. Chiu, Teoh, & Tian, 2012). (Fracassi & Tate, 2011) finds that the implications of network connections are mixed and linked to a variety of contexts like firm value (Fracassi, 2009), CEO compensation (Horton, Millo, & Serafeim, 2009) (Hwang & Kim, 2009), mergers and acquisitions (Schonlau & Singh, 2009)(Cai, Clara, & Sevilir, 2011), or director appointment (Qi, 2011) Such work in the area of corporate governance provides insight, but the results are often con- tradictory in nature, (Larcker & Richardson, 2005) attributing this to several limitations: differing sets of governance variables used, limited sample sizes, and methodological approaches limited to linear models as opposed to more ex- ploratory methods. As such, the comparison criteria in this academic area will be a combination of context and methodological models.
In 2009, Hwang and Kim studied the impact of social ties between CEOs and executive boards over levels of com- pensation, as well as future operating performance. To identify informal social ties, they employed: regional origin, mutual alumna matter (as a sense of group belonging through artifacts like alumni networks, newsletters, donations or college sports events), military service, and academic discipline and university ties. Using the Fortune 100 firms sam- ple and their directors and CEOs information from IRRC31 and Compustat Executive Compensation databases, they find that CEOs desire socially dependent directors because of a positive association between the degree of social de- pendence and CEO power. Moreover, a positive correlation between socially dependent boards and the level of CEO compensation is also found, together with a negative relationship between excess of compensation and subsequent op- erating performance (Hwang & Kim, 2009). A more broad study which takes a wider perspective is that of Chiu et. al. (2010) who explores the board interlocks in relation with earnings management contagion. Board interlock is calcu- lated through the number of ties that a firm’s board has to other boards, while earnings contagion is measured through an indicator of the firm’s susceptibility to having a board link to another “infected” firm. It is found that there exists a positive relationship between earnings management contagion and board exposure to other companies, this relation- ship being enhanced if the links are through directors in audit committees (P.-C. Chiu, Teoh, & Tian, 2010).
Ittner and Larcker demonstrated that creating social networks facilitates access to a broader source of information at lower cost and of better quality (Ittner & Larcker, 2003). Social networks provide opportunities for delivering knowl- edge between connected people and companies which is leading to new opportunities. Correspondingly, this will have a positive impact on the firm’s growth and turnover. Within this context, previous research has examined the effects of social networking links on compensation packages - especially of CEOs. They have also considered the effects of social networking on hiring senior executives and demonstrated that socially powerful CEOs hire directors that are more socially connected with them. In addition, it has been argued that pre-existing network connections between ex- ecutives and directors within a firm may undermine independent corporate governance and reduce firm value (Fra- cassi, 2009)(Fracassi & Tate, 2011). finds out that the connectedness of executives is positively associated with their
compensation and that executive compensation, arising from these connections, is in a significant positive association with future firm performance. Barnea and Guedj (Barnea & Guedj, 2007) studied the effects of social networking on the investment strategies and economic performance of organizations and showed that highly connected boards tend to award their CEOs higher compensation. Schonlau et al. (Schonlau & Singh, 2009) suggested that board social net- works affect the decision to acquire, the choice of target, the method of payment, and ultimately the financial perfor- mance of the firm around the merger.
In this sense, it is an important challenge to understand whether using internal or external knowledge through the so- cial networks in which these are shared and developed, is more (or less) likely to improve firm performance. By studying social networks outside the company's boundaries, this paper contributes by describing characteristics of ex- ternal social networks which are positively related with the environmental governance and characteristics of board of SP1500 directors companies.
PROPOSED METHOD
DATA USED The empirical analysis presented in this section is undertaken on a unique dataset created from the aggregation of a variety of secondary data sources, including CDP (Carbon Disclosure Project, 2011) for environmental characteristics data, BoardEx (BoardEx, 2011) for social networks data and Compustat (“Standard & Poor’s Compustat IQ data- base,” 2011) for financial information. The dataset has 202 company records from the S&P 1500 register, each record containing metrics related to the social network analysis, a number of board characteristics and environmental gover- nance subject areas.
DATA DESCRIPTION In this section, we are presenting a brief description of the variables used in this research.
Social Network data. Based on the BoardEx dataset, it is possible to build the social networks of directors based on their current and past job positions, education background, their membership in other activities and the overall social network index. However, in this paper, we concentrated on current employment network. We believe that the assumptions which are used to create relationships between directors have direct effects on further analysis. Therefore, we define “Current Employment (CE) Network of SP companies” as follow: two SP companies are linked through a director if two companies share the same director. This is the traditional interlocking directorship network. Moreover, if directors from two companies sit on the board of a third company, this will form CE of SP companies as well. Multiple links between two SP companies through different SP directors are assumed to be different (multiple links). The pre-processing and generation of links for each type of networks have been carried out using the PASW Modeller (IBM, 2011). The links are obtained for each network for year 2010 and then have been processed through NodeXL (http://nodexl.codeplex.com) by removing any duplicates nodes and calculating various network metrics. In terms of social network metrics, degree and eigenvector have been used.
a. Degree is the sum of all links that a company has with other companies divided by the number of companies in the network. Degree is the most important measure when taking into account the information to which a company is exposed, because it measures the fraction of companies to which the company is connected (Fracassi, 2009).
b. Eigenvector. Sometimes it is important to how many companies an organization is connected with. But it is also important to consider how important those companies are. Therefore the eigenvector metric describes that if company Ci is connected to company CJ and the degree is high, than there is a high probability that company Ci can get access to information or influence the rest of its network through company CJ. Degree centrality is similar to eigenvector centrality, the difference being that eigenvector centrality measures long term direct and indirect impacts while degree measures immediate effects (Borgatti, 2005). Eigenvector is usually small number between 0 and 1. In order to normalise it we multiply eigenvector by 1000.
Characteristics of Board of Directors.
a. Board size. A larger board size can bring directors with experience that may present a multitude of values in the board (Ienciu et al., 2012)(J. L. Walls et al., 2012). In this paper, board size is calculated using BoardEx dataset.
b. Number of independent directors in board. Independent directors are considering accountability mechanisms because their role is to help ensuring that companies are protecting the interest of stakeholders (Ienciu et al., 2012)(J. L. Walls et al., 2012). In this research, the number of independent directors on the company's board, as reported by the company, is being used.
c. Average compensation for board As it is highlighted in previous literature, compensation of CEO and board of director is one of the main concerns of research considering profile of board in relation to companies’ performance. Hence, in this research we are interested to see the pattern of directors’ compensation in relation toward environmental governance of companies. Average compensation for board of director is calculated based on total compensation for the individual year, which comprised of the following: Salary, Bonus, other annual, total value of restricted stock granted, total value of stock options granted and long-term incentives pay-outs. This attribute obtained from Compustat Execucomp database.
Environmental Governance. All environmental governance attributes are taken from CDP public responses in year 2010.
a. Providing incentives for management of climate change issues and type of incentives The information on the provided incentives for management and their type is available in the CDP 2010 dataset and it is extracted from text-based company replies to the following questions: “Do you provide incentives for the management of climate change issues, including attainment of greenhouse gas (GHG)targets?”. Companies have two choices of “yes” and “no” to answer this question. If companies respond that employees can benefit from incentive programs related to climate change, then they are asked to provide the types of incentives they are paying. The former question contains a set predefined categories, i.e. monetary or recognition (non- monetary) as well as text-based quantitative data. In order to map the text-based data into one of the predefined categories, we have followed the definition of incentives provided by (I, 1988) and (Gomez-Mejia, Luis R, Balkin David B, 1995). Gomez-Mejia and his colleagues defined monetary rewards as those that the company pays for and provides to employees in (1) money and in (2) goods and services. Non-monetary rewards are defined as non- utilitarian rewards that satisfy an employee’s intellectual, psychological, emotional and social demands (I, 1988).
In order to extract quantitative data from text-based qualitative data, a structured process has to be followed. First, it is necessary to understand the data and the domain it represents. Second, it follows term extraction (statistical and/or syntactical analysis of text corpora in specialized domains (Bourigault & Jacquemin, 1999) through manual data processing on a subset of the available data. This allowed us to build a catalogue of concepts which made the results more accurate. This is because when domain specificity is incorporated into the analysis it improves the identification of the most appropriate concepts, and, thus, making the application more meaningful and more effective.
Figure 1. Term extraction summary
Figure available in the original PDF paper.
Figure 1 presents the summary of term extraction for type of incentives. Companies tend to pay monetary incentives rather than non-monetary incentives. 38.8% of companies also mentioned that they are paying both monetary and non-monetary incentives.
b. Publishing climate change information External communications are an integral part of informing the public about company’s responses to climate change. In addition to the voluntary response to CDP, there is two main questions seeks to provide readers with more sources of information. Additionally, information included in annual reports and CSR reports often provides a wider breath of information regarding a company’s socially responsible activities. This attribute asks about publishing climate change information in annual report or any other mainstream filling.
c. Voluntary communication This attribute concerns on whether company have published information about its climate change/GHG emissions in other places than CDP. Example of voluntary communication include reports for the Global Reporting Initiatives, UN Global Compact Communication on Progress (Caring for Climate), US EPA Climate Leaders Program and The Climate Registry.
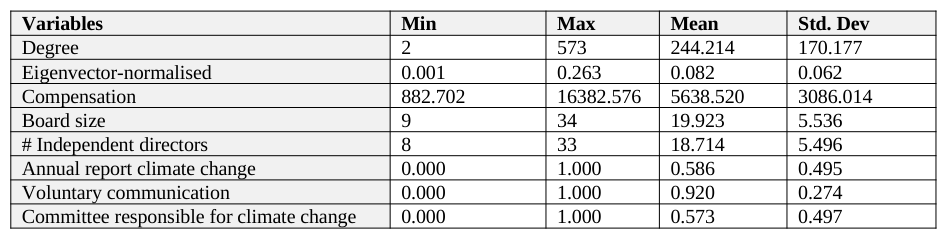
The descriptive of the variables used is presented in Table 1.
Table 1. Descriptive statistics of the variables Variables Min Max Mean Std. Dev Degree 2 573 244.214 170.177 Eigenvector-normalised 0.001 0.263 0.082 0.062 Compensation 882.702 16382.576 5638.520 3086.014 Board size 9 34 19.923 5.536 # Independent directors 8 33 18.714 5.496 Annual report climate change 0.000 1.000 0.586 0.495 Voluntary communication 0.000 1.000 0.920 0.274 Committee responsible for climate change 0.000 1.000 0.573 0.497
ANALYSIS AND RESULTS The methodology used in this analysis is a progressive clustering analysis approach. First, the K-Means (Alonso & Shuster, 2002) algorithm is applied using only social network attributes as inputs to identify initial clusters of companies, and then more inputs are being added to observe the evolution of clusters. Next, we apply the K-Means algorithm after adding the board characteristics attributes and finally we run it after the inclusion of environmental governance indicators.
Distribution of degree centrality versus eigenvector is presented in Figure 2. It is clear that cluster_2 has lower degree and eigenvector in comparison to cluster_1. Range of degree for cluster_2 is between 2 and 248. Eigenvector scores for this cluster are also lower. This means that companies are connected to few companies and these companies are not well connected in turn. By considering companies in cluster_1, we can clearly see that these companies have higher degree and eigenvector. Range of degree is between 252 and 573 and eigenvector is between 0.712 and 2.016. The interesting point about companies in cluster_2 is that there are a number of companies with almost the same degree, but different eigenvector. It could be interpreted as follow: there are companies with same degree which means they are connected to same number of companies directly, but their different eigenvector describe the fact that neighbours of companies with higher eigenvector are connected to better connected companies. This means that in the long term, if a company breaks a relationship with some of the direct connected companies, it can still reach the rest of the network with ease due to the fact that its neighbours have high degree.
Figure 2. Distribution of Degree vs. Eigenvector
Figure available in the original PDF paper.
Figure 3 displays the results of the first step in the clustering analysis framework for which the recorded Silhouette measurement indicator is Good. It is possible to appreciate that those members of cluster-2 present higher degrees of connectivity, as well as higher degree and eigenvector centrality scores. Based on the mean values of these metrics across the entire sample, it can be stated that, on average, companies in Cluster_1 have more direct ties to other companies. Moreover, higher eigenvector for this group indicates that neighbours of these companies are also well connected which helps build up the long term relationship with other organizations. Contrarily, companies in Cluster_2 have less directed links to other firms which means that this group is not as well connected as the cluster_1 group. Moreover, lower eigenvector means that their connected companies are not very well connected to firms in the first place.
Apparently, the size of both clusters is almost same. It means that 51.8% of companies are in cluster_1 and 48.2% belong to cluster_2. Based on these results, and similarly to (Diaz, Theodoulidis, & Shahgholian, 2013) cluster-1 companies are labelled Socially Connected and cluster-2 companies are labelled Socially Independent.
Figure 3. Social Network Clusters and their statistics
Figure available in the original PDF paper.
The second step adds the characteristics of board of directors to find relationships between companies’ social networking and their board characteristics. Figure 3 displays the results after the second step in the clustering analysis framework is applied and for which the recorded Silhouette measurement indicator is also Good. Once again, two main clusters can be clearly identified. It is now possible to appreciate how company members of the Socially Connected cluster also possess better indicators in terms of corporate governance. For example, companies belonging to cluster-2 tend to have higher indices in terms of board size, number of independent directors and
Figure 4. Social Network & characteristics of Board Clustering Analysis
Figure available in the original PDF paper.
Taking into consideration that the first clustering analysis revealed that Socially Connected companies have more network ties and are more centrally located, it would be expected that these same companies have bigger boards comprising of more independent directors. This is because it is through them and their connections that the firm reaches other firms in the network. Additionally, independent directors are considering accountability mechanisms because their role is to help ensuring that the companies they represent are protecting the interests of stakeholders (Haniffa & Cooke, 2005). However, it is interesting to note that the directors of these companies are earning more than others. Subsequently, it can be argued that these high earning directors are able to take larger profit and seize the advantages of leading inter-connected organizations for themselves. This is actually in line with previous findings in the literature. Horton et. al. in 2009 find a positive correlation between social network metrics, and the level of CEO compensation (Horton et al., 2009), while Chiu et. Al. in (P.-C. Chiu et al., 2010) finds a positive relationship between earnings management contagion and board exposure to other companies. Based on these findings and the assumption that bigger boards of directors’ leads to increased salary spending across the organization, cluster-2 companies are labelled Connected Overspenders and cluster-1 companies are labelled Independent Underspenders.
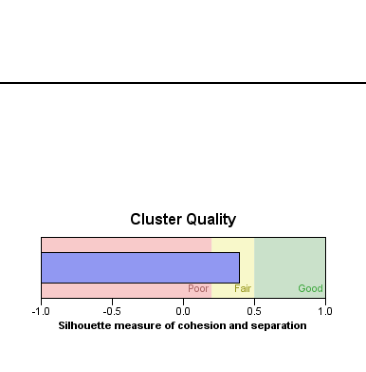
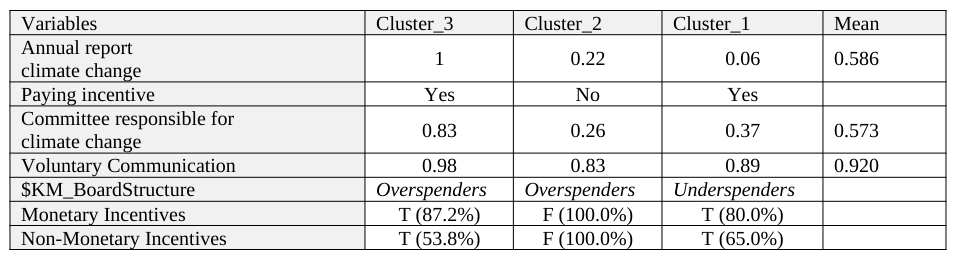
Finally, the last step adds the environmental governance variables to identify relationships between companies’ social networks, as well as their characteristics of board of directors. Figure 3 displays the generated results after the final step in the clustering analysis framework has been applied and for which the recorded Silhouette measurement indicator is Fair; three clusters being identified. It is now possible to appreciate how company members of the Connected Overspenders cluster also possess better corporate environmentalism indicators as they tend to have better environmental governance. Based on the mean values of these metrics across the entire sample in Table 2, it can be observed how cluster-3 companies, on average, are definitely publishing annual report for climate change, are paying incentives, 87.2% are receiving monetary incentives and 53.8% are receiving non-monetary incentives. They have committees responsible for climate change and also voluntary communications in this regard. All of this can be due to the fact they actually have the money to do so. Moreover, companies who are well connected and have stronger board characteristics are in this cluster.
Figure 5. Social Network, Board Characteristics & Environmental Governance Clusters
On the other hand, some of the Overspender companies are in cluster_2, but are not paying incentives, they are less likely to publish annual reports and have committees and voluntary communications for climate change. However, this cluster includes well connected companies with strong board characteristics; they are weaker in different environmental governance practices in comparison to cluster_3. Cluster_1 covers all Underspender companies which means they are socially independent and do not have strong board characteristics, although they are paying incentives both in monetary and non_monetary forms. They are less likely to publish annual report in comparison with the other two clusters. However, their voluntary communications and committees for climate change are better than companies in cluster_2. Companies in this cluster intend to pay more non_monetary incentives in comparison with the other two clusters.
This final clustering analysis shows the clear influence of the social networks and board characteristics on firms’ environmental governance as connected companies which have larger boards of directors and award higher compensation and bonuses also tend to be active in their environmental activities. Moreover, establishing climate- change boards is supported by literature. Rankin et.al. in 2011 have recently demonstrated that the aim of an environmental committee is to motivate a firm into implementing policies and practices for measuring and reporting of environmental impact. The environmental committee is likely to reduce the risk associated with environmental impact and to make the importance of environmental reporting visible for stakeholders (Rankin, Windsor, & Wahyuni, 2011). On the basis of these findings, cluster-3 companies are labelled Connected Green Overspenders and cluster-1 companies are labelled Independent Polluting Underspenders.
Table 2. Social Network, Board Characteristics & Environmental Governance Clustering
Analysis
CONCLUSION
Most activities of companies are associated with the growing level of multiple direct and indirect impacts on the environment. Consequently, companies have initiated investments in order to decline their impacts on the environment. This policy may affect companies’ performance and their activities. Since decisions made by boards of directors can have a critical impact on a company’s activities, it is essential to have a full picture of board characteristics as well as intra-board relationships among directors (Harris & Helfat, 2007). Prior research highlights the importance of social network among companies toward board’s characteristics. While, examining the impact of companies’ social network in their environmental performance is still in early stage. Considering this scenario, the present study is looking on social networks between companies and several board characteristics linked to the role of directors in board in relation to environmental governance. Sample of S&P1500 companies in year 2010 has been used. After building social network between companies based on current employer position of directors and examining various social network centrality metrics, we can clearly distinguish two clusters of companies using degree and eigenvector centrality metrics. In second step, these two clusters have been used in conjunction with a several characteristics of board. Board size, number of independent directors and average compensation of directors in the board has been used as the board characteristics. Results in this step shows that companies that are socially connected, have larger board size and more number of independent directors in their board. They are likely to pay more compensation to their board members as well. Finally, we have checked the characteristics of companies in relation to their environmental governance. According to our finding, overall socially connected companies with stronger board characteristics present better environmental governance, however they have different policy in paying climate change incentives. On the other hand, Independent Under Spender companies are paying climate change incentives but they do not present good environmental governance practice. Therefore, we can observe the influence of social network between companies and profile of board on environmental governance.
Future research could further explore other board characteristics such as their experience and board diversity towards the environment management. Moreover, we can extend our work by considering other type of connections between companies and their directors such as past employment network, other activities and education background.
REFERENCES: Adler, P. S., & Kwon, S.-W. (2002). Social Capital: Prospects for a New Concept. The Academy of Management Re-
view, 27(1), 17–40. Retrieved from http://links.jstor.org/sici?sici=0363- 7425(200201)27:1<17:SCPFAN>2.0.CO;2-5&origin=crossref Alonso, R., & Shuster, M. (2002). TWOSTEP: a fast robust algorithm for attitude-independent magnetometer-bias determination. Journal of the Astronautical Sciences. Ameer, R., & Othman, R. (2012). Sustainability Practices and Corporate Financial Performance: A Study Based on
the Top Global Corporations. Journal of Business Ethics, 108(1), 61–79. doi:10.1007/s10551-011-1063-y Barnea, A., & Guedj, I. (2007). CEO compensation and director networks. Unpublished paper, University of Texas at Austin, (January). Retrieved from http://recanati.tau.ac.il/v1/_Uploads/257BarneaGuedj07.pdf BoardEx. (2011). Management Diagnostics Limited. Retrieved from http://www.boardex.com/ Borgatti, S. P. (2005). Centrality and network flow. Social Networks, 27(1), 55–71. doi:10.1016/
j.socnet.2004.11.008 Bourigault, D., & Jacquemin, C. (1999). TERM E X T R A C T I O N + TERM CLUSTERING : An Integrated Platform for Computer-Aided Terminology Components of the Platform for Computer-Aided Terminology. In In Proceedings of EACL ’99 of the ninth conference on European chapter of the Association for Computational Linguistics (pp. 15–22). Brass, D. J. (1984). Being in the Right Place : A Structural Analysis of Influence in an Individual Organization. Sci-
ence, 29(4), 518–539. Brown, R., Gao, N., Lee, E., & Stathopoulos, K. (2012). What are friends for? CEO networks, pay and corporate governance. Corporate Governance, (February). Retrieved from http://link.springer.com/chapter/10.1007/978- 3-642-31579-4_12 Cai, Y., Clara, S., & Sevilir, M. (2011). Board Connections and M&A Transactions *. SSRN. Carbon Disclosure Project. (2011). Carbon Disclosure Project. Retrieved from http://www.cdproject.net Chiu, P., Teoh, S., & Tian, F. (2012). Board interlocks and earnings management contagion. The Accounting Re-
view, 88(3). Retrieved from http://www.aaajournals.org/doi/abs/10.2308/accr-50369 Chiu, P.-C., Teoh, S. H., & Tian, F. (2010). Board Interlocks and Earnings Management Contagion. SSRN Electronic Journal.
De Villiers, C., Naiker, V., & van Staden, C. J. (2011). The Effect of Board Characteristics on Firm Environmental Performance. Journal of Management, 37(6), 1636–1663. doi:10.1177/0149206311411506 Diaz, D., Theodoulidis, B., & Shahgholian, A. (2013). Social Networking Influence on Environmental and Corpo-
rate Performance. Business Informatics (CBI …, 63–68. doi:10.1109/CBI.2013.18 Dunn, P., & Sainty, B. (2009). The relationship among board of director characteristics, corporate social performance and corporate financial performance. International Journal of Managerial Finance, 5(4), 407–423. doi:10.1108/17439130910987558 Fracassi, C. (2009). Corporate Finance Policies and Social Networks. SSRN eLibrary. Retrieved from http://ssrn.-
com/paper=1121503 Fracassi, C., & Tate, G. A. (2011). External Networking and Internal Firm Governance. Journal of Finance, Forthcoming. SSRN. doi:10.2139/ssrn.1213358 Fujii, H., Iwata, K., Kaneko, S., & Managi, S. (2013). Corporate Environmental and Economic Performance of Japa-
nese Manufacturing Firms: Empirical Study for Sustainable Development. Business, 201(October 2012), 187– 201. doi:10.1002/bse Gomez-Mejia, Luis R, Balkin David B, C. R. L. (1995). Managing Human Resources. New Jersey: Prentice Hall. Hall, C., & Cruse, S. (2011). Annual Review 2010. Haniffa, R. M., & Cooke, T. E. (2005). The impact of culture and governance on corporate social reporting. Journal of Accounting and Public Policy, 24(5), 391–430. doi:10.1016/j.jaccpubpol.2005.06.001 Harris, D. A., & Helfat, C. E. (2007). The Board of Directors as a Social Network. Journal of Management Inquiry. Hillman, A., & Dalziel, T. (2003). Boards of directors and firm performance: Integrating agency and resource de-
pendence perspectives. Academy of Management review, 28(3), 383–396. Retrieved from http://amr.aom.org/ content/28/3/383.short Horton, J., Millo, Y., & Serafeim, G. (2009). Paid for Connections? Social Networks, Executive and Outside Director Compensation. SSRN eLibrary. Retrieved from http://ssrn.com/paper=1416935 Hwang, B.-H., & Kim, S. (2009). Social Ties and Earnings Management. SSRN Electronic Journal. Retrieved from
http://ssrn.com/paper=1215962 I, H. R. (1988). Job evaluation, classification and pay. In In The Job Analysis Handbook for Business, Industry and Government, Volume 1. IBM. (2011). IBM SPSS PASW Modeller 13. Retrieved from http://www-01.ibm.com/software/analytics/spss/prod-
ucts/modeler/ Ienciu, I.-A., Popa, I. E., & Ienciu, N. M. (2012). Environmental Reporting and Good Practice of Corporate Governance: Petroleum Industry Case Study. Procedia Economics and Finance, 3(12), 961–967. doi:10.1016/S2212- 5671(12)00258-4 Ittner, C. D., & Larcker, D. F. (2003). Coming Up Short on Nonfinancial Performance Measurement. Harvard Busi-
ness Review. Larcker, D. F., & Richardson, S. A. (2005). How Important is Corporate Governance ? How Important is Corporate Governance ? SSRN Library. Matisoff, D. C., Noonan, D. S., & O’Brien, J. J. (2013). Convergence in Environmental Reporting: Assessing the
Carbon Disclosure Project. Business Strategy and the Environment, 22(5), 285–305. doi:10.1002/bse.1741 Network, S., & Analytics, D. (2011). Social Network Data Analytics. Palmberg, J. (2012). The performance effect of corporate board of directors. European Journal of Law and Economics, 33. doi:10.1007/s10657-012-9369-5 Qi, Q. C. (2011). How Does The Director ’ s Social Network Matter ? Evidence From Structure Estimation How
Does The Director ’ s Social Network Matter ? Evidence From Structure Estimation. Methods. Rankin, M., Windsor, C., & Wahyuni, D. (2011). An investigation of voluntary corporate greenhouse gas emissions reporting in a market governance system: Australian evidence. Accounting, Auditing & Accountability Journal, 24(8), 1037–1070. doi:10.1108/09513571111184751 Schonlau, R., & Singh, P. V. (2009). Board Networks and Merger Performance. SSRN Electronic Journal. Standard & Poor’s Compustat IQ database. (2011). Retrieved from http://www.compustat.com/compustat_data/ Walls, J., & Hoffman, A. (2013). Exceptional boards: Environmental experience and positive deviance from institu-
tional norms. Journal of Organizational Behavior, 271(March 2012), 253–271. doi:10.1002/job Walls, J. L., Berrone, P., & Phan, P. H. (2012). CORPORATE GOVERNANCE AND ENVIRONMENTAL PER- FORMANCE : IS THERE REALLY A LINK ? Strategic Management Journal, 913(December 2011), 885– 913. doi:10.1002/smj Wasserman, S., & Faust, K. (1994). Social Network Analysis: Methods and Applications. Cambridge University
Press. Zahra, S. a. (1989). Boards of Directors and Corporate Financial Performance: A Review and Integrative Model.
Journal of Management, 15(2), 291–334. doi:10.1177/014920638901500208
LISTED IN THE AHFE DIGITAL BOOKSTORE CATALOGUE
Explore the complete digital volume
Advances in Science, Technology, Higher Education and Society in the Conceptual Age: STHESCA
Read this individual research paper free through the original publisher, or explore the full digital proceedings book.
ISBN 978-1-4951-2110-4
Explore this ISBN in the AHFE Bookstore ↗Listed in the July 2026 bookstore catalogue; search by ISBN to confirm current availability · Digital book purchase optional