Kellie D. Kennedya, James P. Blissa, Isabel L. Nunesb (2019). Impact of Device Reliability and Route Exposure on Navigational Performance. In: Advances in Cognitive Engineering and Neuroergonomics. AHFE Open Access, vol. 7. https://doi.org/10.54941/ahfe100215
1 Department of Psychology, Old Dominion University, Norfolk, VA 23529, USA b Faculdade de Ciências e Tecnologia, Universidade Nova de Lisboa, UNIDEMI, Campus de Caparica, 2829-516 Caparica, Portugal ↗
2 Faculdade de Ciências e Tecnologia Universidade Nova de Lisboa, UNIDEMI Campus de Caparica, 2829-516 Caparica, Portugal ↗
Some researchers now suggest that the relationship between signal reliability and behavior may not be mediated by trust in all circumstances. Driving is an ideal task domain for investigating the reliability-trust relationship because drivers increasingly rely on automated navigational systems for guidance. The primary goal of this investigation was to evaluate participant performance in a simulated navigational task while using a navigational aid with a specified level of reliability (75% or 95%). We predicted that drivers would choose to comply with an aid more often when the expected reliability was high than when it was low. Participants were provided cursory exposure to a target route to provide route familiarity. Performance measures included speed, duration, distance, time stopped, time moving, time out, and task success. We found no significant effect of reliability on any of the driving performance measures; however, performance significantly improved for repeated task presentation. We contend that route exposure and navigational aid experience influenced driver performance more than the stated aid reliability. These results yield further information about the limitations of evaluating automation trust using behavioral measures.
Using an automated navigational system to assist with wayfinding is commonplace, particularly when navigating in an unfamiliar location. Drivers using such devices typically reach desired destinations more rapidly and reliably than those using maps. However, GPS-enabled navigation systems are not infallible. Reports of GPS navigation systems providing inaccurate directions are still fairly common. Indeed, drivers have been led astray after following auto- mated directives that were not optimal or not accurate. As recently as 2012, Apple released a navigation aid app so fraught with inaccuracies that the CEO had to release an apology letter and recommended operators to use competi- tor systems (Cook, 2012).
Saranow (2008) reported that some drivers trust GPS systems even when they issue grossly incorrect directives. Saranow provided examples of drivers complying with an incorrect GPS to the point of turning onto a closed road, making illegal turns, and driving onto roads unsuitable for vehicles. In one example, when drivers attempted to navi- gate to or from a terminal at Fairbanks International Airport in Alaska, Apple Maps provided a route that included Cognitive Engineering and Neuroergonomics (2019) driving on the main runway (Hastings, 2013). Despite multiple signs and a gate, the number of drivers that followed this suggested route forced the airport to barricade that access road. Providing routes that are incorrect or inefficient can be the mark of an unreliable system. Although such stories are common, some users do not comply with these inaccurate directives. This study investigated the relationship of device reliability and previous route exposure on navigational performance in a simulated driving task.
Background
The introduction and maturation of GPS technology in the early 1990s enabled U.S. vehicle companies to introduce GPS-based in-vehicle navigation systems, such as Oldsmobile’s GuideStar system released in 1995 (Oldsmobile’s Corporation, 2009). Human factors evaluations of in-cab navigational systems accompanied the availability of func- tional GPS systems. A series of reports written for the U.S. Federal Highway Administration outlined the human factors guideline developments needed for advanced traveler information systems (ATIS) for use in commercial ve- hicles (Clarke, McCauley, Sharkey, Dingus, & Lee, 1996). The result of such evaluations was the development of the TravTek system, a navigational aid for drivers that encapsulated recommended usability refinements prior to im- plementation (Means et al., 1992). Despite the usability and design research, early investigations did not account for some aspects of the cognitive impact these devices would have on operator performance.
Automated decision aids are intended to increase the efficiency of operator decision-making (Parasuraman & Manzey, 2010). These devices are particularly helpful during instances when incorrect decisions are associated with high costs or consequences. When a driver follows incorrect directives, he or she commits an automation bias error of commission. One explanation for this type of error is that the operator overestimated the capability of the aid (Lee & See, 2004). Cues generated from automated aids are often highly salient and operators tend to credit these aids with power and authority (Parasuraman & Manzey, 2010). Therefore, aids can quickly become misused, particularly during decisions with costly consequences.
Considerable effort has been applied to understanding human reactions to unreliable automated alarms and warn- ings. Janis (1962) provided evidence of the reticence individuals experience when faced with the decision to evacu- ate, seek shelter, or take protective action in the face of potential adverse weather events. Breznitz (1984) identified unreliability as a serious concern and demonstrated that multiple false alarms can elicit physiological changes and behavioral changes in signal compliance. The cry wolf effect occurs when false or unnecessary alarms lead the oper- ator to distrust or disuse the alarm system, hindering the desired effect of a true alarm (Bliss, 1993; Breznitz, 1984). Sorkin (1988) reported pilots deactivated critical but unreliable cockpit alarm systems because of frequent false alarms.
Lee and See (2004) reported that operator trust can influence when and how the operator will use automation. They defined automation trust as the attitude that the automation will help the individual achieve a goal in a situation marked by uncertainty and vulnerability. They noted that trust would guide operator reliance, but not completely de- termine it. In particular, trust in automation guides operator reliance when a system is too complex to practically un- derstand. Such situations can produce a misalignment of system reliance.
Inappropriate reliance depends on the match between the level of operator trust and the actual capabilities of the au- tomation. Muir (1987) describes this relationship in terms of calibration, overtrust, and distrust. Calibration refers to the agreement of the operator trust and the capabilities of the automation. Overtrust occurs when a person trusts a system to perform beyond its capabilities. Distrust occurs when a person fails to trust a system to perform up to its capabilities. Muir reported that individuals lose trust in automation when expectations do not match outcomes. Lost trust can be gained from the performance, process, and purpose of a system; however, Muir and Moray (1996) re- ported that operator trust was strongly correlated with subsequent use of automation. Lee and See (2004) identified trust as cyclical system such that automation trust is influenced by interactions with the automation and those inter - actions are influenced by the trust in the automation. Unfortunately, if the system is not trusted the operator is less likely used it, thus making lost trust difficult to regain.
Tseng and Fogg (1999) characterized the operator-automation relationship as reliant on the human perception or evaluation of the credibility of the automation. Credibility is the believability of the information provided by the aid as assessed by trustworthiness and expertise. Trustworthiness is the perceived goodness of the source. Expertise is the perceived knowledge and skill of the source. They reported four categories of credibility: presumed, reputed, Cognitive Engineering and Neuroergonomics (2019) surface, and experienced. Presumed credibility is based on general assumptions in the perceivers mind. Reputed credibility is based on what third parties have reported. Surface credibility is based on cursory inspection. Experi- enced credibility is based on first hand experience. Just as in other trust literature, Tseng and Fogg reported that once credibility is lost the only way to regain it is to provide good information or commit the same error that can be pre- dicted and avoided. Again, unfortunately, operators tend to abandon devices deemed incompetent (Muir & Moray, 1996; Wiegmann, Rich, & Zhang, 2001).
But not all errors are created equal; researchers have found that small errors can have large effects on perceptions of credibility (Muir & Moray, 1996; Madhavan, Wiegmann & Lacson, 2006). Madhavan, Wiegmann, and Lacson (2006) found that automation errors on tasks that operators perceived to be easy impacted trust more severely than errors on tasks perceived to be difficult. The relationship between automation trust and error is further complicated by expertise. Parasuraman and Riley (1997) reported that experienced pilots continued to use malfunctioning auto- mation more often than non-pilots, potentially due to prior training and experience with automation. Tseng and Fogg interpret the ends of the expertise and trust spectrum as an increased susceptibility to the incredulity error or the gullibility error. The incredulity error suggests that operators with expertise are more likely to judge an unreliable system strictly and perceive an unreliable system as incredible. The gullibility error suggests that inexperienced op- erators judge the system less strictly and perceive a system as credible (Kantowitz, Hanowski, & Kantowitz, 1997; Tseng & Fogg, 1999).
Driving is an ideal task domain for investigations in automation trust. Kantowitz et al. (1997) manipulated the relia- bility of traffic information (100%, 71% or 43% accurate) and reported driver performance was best in the 100% condition and decreased with lower reliabilities. They also reported that operator trust decreased with inaccurate in- formation but did recover with subsequent accurate information. Bliss and Acton (2003) reported participants re- sponded best to collision detection alarms that were 100% reliable as opposed to those 70% or 50%. In a simulated driving task, Kennedy and Bliss (2013) provided participants with an automated navigational aid that issued correct directives for the first five of six directives. The sixth directive instructed participants to make an illegal left turn. Despite clear signage, 79.5% of participants completed the illegal left turn. Of those that turned, 72.7% reported do- ing so because of the device directive. As in the case of the Alaska airport example, operators interacting with an un- familiar navigational aid in an unfamiliar location may have no way to calibrate the appropriate balance of trust with the device reliability. Giving the participant a cursory level of route exposure might indeed influence automation re- liability expectation and encourage early calibration.
Purpose of Current Study The widespread use of imperfect GPS navigation systems provides a clear potential for automation misuse or disuse as a result of unreliable directives. The primary goal of this investigation was to evaluate participant performance in a simulated navigational task while using a navigational aid with a specified level of reliability (75% or 95%). Per- formance measures included speed, duration, distance, time stopped, time moving, time out, and task success. Par- ticipants were also provided with cursory exposure to the target route to ensure consideration of directives. We pre- dicted that drivers would choose to comply with an aid more often when the expected reliability was high than when it was low.
METHOD
Design To test our hypotheses, we manipulated automated navigational directive reliability (75% and 95% true directives) within groups. To improve internal validity this manipulation was performed with a counter-balanced design, such that half of the participants experienced the 75% reliability first and the other half experienced the 95% reliability first. There were seven dependent measures: speed, duration, distance, time stopped, time moving, time out, and overall success.
Average speed was measured in miles per hour (mph). All time measures were in seconds. Total Duration was reflected the total time the participant used to complete the task. Total Distance reflected driving efficiency and was measured in feet. Time Stopped reflected the total amount of time the participant was stopped. Time Moving re- flected the total time the participant was driving. Success score reflected the extent of task completion and ranged from 0 (nothing completed) to 3 (all stops completed). Time Out indicated whether or not the participant failed to complete the task in less than the task limit of 950 seconds.
Participants Forty-one undergraduates (17 male, 24 female) completed this experiment for class credit and the chance to win a $50 performance-based award. Participants were required to be over the age of 18, have normal or corrected-to-nor- mal vision and hearing, and possess a valid United States driver’s license. Participant ages ranged from 18 to 31 years (M = 21.1, SD = 3.02). Approximately 90.2% (37 of 41) of the participants reported GPS device familiarity.
Materials
Participants read and signed an informed consent document and completed a background questionnaire that included pertinent demographic information such as age, sex, driving history, abnormal vision or audition, and automated navigational aid experience. They also completed the 18-question Motion Sickness History Questionnaire (MSSQ) – Short Form to assess history of motion sickness with a cutoff as a total MSSQ score greater than 19 (Golding, 2006). One participant scored higher than 19 and was given full credit but excused from further participation in this study. Participants were given experimental instructions that described the study, the driving simulator, the scenario, and the automated navigational aid. Following the two driving sessions, participants completed an opinion questionnaire.
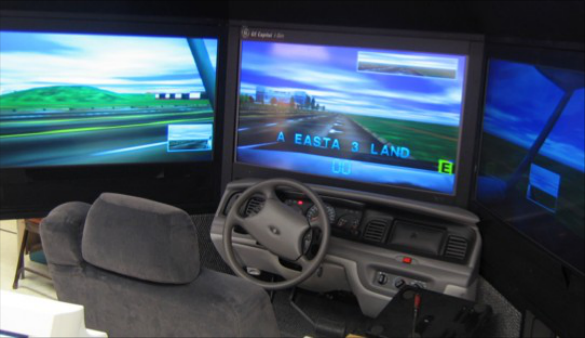
Procedure Participants completed the consent form, background questionnaire, and the MSSQ. After the MSSQ was scored, the continuing participants completed the simulator adjustments and the five-minute familiarization run. The familiar- ization session included orienting the participant with the simulator including seat adjustments, controls, and appropriate control of the simulated vehicle (i.e. observe speed limits, stay in proper lanes, obey traffic signals, avoid col- lisions). The participants then performed five minutes of self-guided driving in an environment similar to the experi- mental environment to become accustomed to the simulation and the equipment.
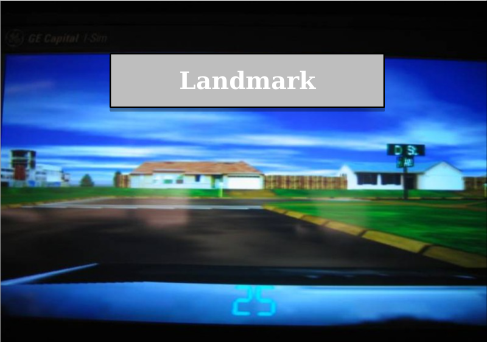
After the familiarization run, participants were informed that they would be acting as ambulance drivers tasked to leave the hospital on a simulated emergency exercise. Next, participants were exposed to the optimal route. To cap- ture orientation preference, participants were exposed to the route for a total of twelve minutes dynamically or stati- cally using both spatial and landmark orientations (Hoffler & Leutner, 2007; Lee & Tversky, 2005). Six minutes were dedicated to spatial (image of a map) and six minutes were dedicated to landmark (images of critical points along the route such as turns and pickup locations) (Figure 2). The static exposure contained still images of the opti- mal route using a map, and still pictures of each critical intersection and pickup location. The dynamic exposure contained videos of this information. Participants were given a post-exposure questionnaire and all incorrect re- sponses were clarified and corrected.
Static Static
Landmark Landmark
Figure 2. Examples of the optimum route and the landmark (first person) and static (overhead map) training materials.
Participants were randomly assigned and counterbalanced to a starting reliability condition (75% or 95%). Partici- pants were again briefed of the simulation rules and task requirements. Before each run, participants were told that they had an automated navigational device to assist with wayfinding but that this device was had a reliability of ei- ther 75% or 95%. Participants completed the first run with the first assigned GPS reliability level followed by the second run with the second GPS reliability level.
The experimental runs required participants to pick up three patients at different locations around a city and bring them back to the hospital in the shortest amount of time and distance. The specific route contained 18 different route choice points that included the appropriate turns to navigate from the hospital, complete three pickups (school, Macy’s, GE loading dock), and return to hospital (Figure 2). Each pickup consisted of a 10 second simulation-timed stop. The fourth automated directive that the navigational aid provided deviated from the trained route. This direc- tive led to a secondary route that did not match previous route exposure but would result in successful task perfor- mance if followed. Each participant completed two experimental runs and experienced both reliabilities levels (75% and 95%). Each participant drove three times in the simulated environment with one familiarization run and two ex- perimental runs. The total experiment lasted approximately one hour.
There was no other traffic in the experimental simulation. Participants were informed that one-way streets and the 45 mph speed limit must be obeyed but the other traffic control devices could be ignored. The participants were told that the person who achieved the fastest time and traveled the shortest distance without violating the terms of the study would receive $50. Violations were defined as colliding with another object, exceeding 45 mph, failing to complete the task, or failing to complete the route in the allotted time.
RESULTS
Upon inspection of the data, three participants were classified as outliers by boxplot but retained. Data for Speed, Duration, Distance, Stopped, Moving, and Success were tested for significance using paired sample t-tests. Data for Speed, Stopped, and Success violated the normality assumption, however, the Wilcoxon Signed Ranks test con- firmed the findings of the reported paired samples t-test so those were used. There were no significant differences for any dependent variable between the 75% and 95% reliability conditions (Table 1). An exact McNemar’s test was used to test the dichotomous Time Out variable and determined no significant difference in the proportion of timeout for the 75% (13 of 41) and the 95% (8 of 41) reliability condition, p = .332.
Table 1: Descriptive Statistics and T-Test Results for Speed, Duration, Distance, Time Stopped, and Time Moving between 75% and 95% Reliability Conditions.
Table available in the original PDF paper.
Session 1 Session 2 95% CI Performance Measures M SD M SD n Lower Upper d t df Sig Speed 23.90 4.78 23.51 4.56 41 -1.22 2.00 0.08 0.489 40 0.627
To further explore the data, we conducted paired sample t-tests to determine whether participants performed signifi- cantly different in Session 1 and Session 2. As displayed in Table 2, there are statistically significant differences from Session 1 to Session 2 in scores for Speed, Duration, Time Stopped, and Overall Success, but not for Distance or Time Moving. Results show that Speed and Task Success increased while Duration and Time Stopped decreased. These findings suggest that participants were able to complete Session 2 faster and required less time to make direc- tive decisions. Distance and Time Moving were not significantly different. Approximately, 36.6% of the participants timed out in Session 1 (15 of 41) but only 14.6% (6 of 41) timed out in Session 2. Upon further investigation, 87% (13 of 15) participants who timed out in Session 1 did not time out in Session 2. An exact McNemar’s test detected a significant difference in the proportion of Time Out for Session 1 and Session 2, p = .021.
Table 2: Descriptive Statistics and T-Test Results for Speed, Duration, Distance, Time Stopped, and Time Moving between Session 1 and Session 2.
Table available in the original PDF paper.
Session 1 Session 2 95% CI Performance Measures M SD M SD n Lower Upper d t df Sig Speed 22.13 5.26 25.28 3.31 41 -4.41 -1.88 0.78 -5.013** 40 <0.001
The current experiment explored the relationship of previous route exposure and the expectation of automated navi- gation aid directive reliability within the context of a simulated navigation task. An effect of reliability was not ob- served from the performance results. Instead, participants exhibited improved performance metrics from the first run to the second run, regardless of the navigation aid reliability. These results demonstrated that participants learned from the first to the second task session, however, what the participant learned in of interest. Participants appeared to rely more on prior exposure to the system than the given system reliability.
Participants were not exposed to additional target route exposure between Session 1 and Session 2; yet, the majority of participants were able to complete the task. Perhaps the learning involved in this study was calibration informa- tion. Participants experienced that the navigation aid provided inaccurate directives throughout Session 1. Once par- ticipants experienced the initial inaccuracy in Session 2, the aid was ignored more quickly and participants relied on reproduced the trained route. Indeed, participants disregarded the device even when the second reliability was stated to be 95%. Experiencing the unreliability of the navigation aid in Run 1 appears to have encouraged participants to begin Run 2 with no expectations of assistance from the device. We contend that previous exposure to an unreliable device influenced driver behavior more than experimenter-provided indications of system reliability.
Previous researchers have pointed out that trust may not always mediate the effect of reliability on task performance. Using the framework provided by Tseng and Fogg (1999), our findings indicate that there were no performance dif- ferences as a function of the reputed credibility (reliability) of the GPS system. The participant arrived with a pre-set level of presumed credibility for automation. The researcher provided the participant with reputed credibility by pro- viding the participant with an aid reliability level of either 75% or 95%. Next, participants collected experienced credibility in Session 1. They experienced directives that were wrong very early. They recognized this inaccuracy because of the route exposure training but were hesitant to correct for this unexpected change because of the pre- sumed credibility. As the directives were only occasionally correct throughout the remainder of Session 1, by Ses- sion 2, the experienced participants quickly abandoned the navigational aid without regard for projected reliability and performed the task based on the route exposure training.
With the widespread adoption of GPS navigation systems and the potential for unreliable directions, the current re- search holds value for navigational system designers. Navigating through unfamiliar locations even with cursory route exposure can become impossible without appropriate guidance. Drivers prepared to navigate with a GPS can quickly become overwhelmed and frustrated if the navigation aid does not perform as expected. Once the driver loses confidence in the aid, any previous route knowledge might cause the driver to ignore or doubt even correct di- rectives. Such a circumstance might result in the aid becoming an auditory and visual distraction that increases driver workload. The current study seems to reflect such a situation; participants performed very poorly in Session 1, but in Session 2 they disregarded the navigational aid quickly and performed well using prior knowledge. Further re- search is needed to detect what parameters of device unreliability most impact the operator determining a device is no longer useful and should be disregarded completely. The results of this research provide information about the limitations of behavioral measures as evaluations of automation trust. This consideration is important for applied task domains where behavioral measures may be conveniently obtained but not comprehensively informative.
REFERENCES
Bliss, J.P. (1993). “The cry-wolf phenomenon and its effect on alarm response.” Unpublished doctoral dissertation. University of Central Florida, Orlando. Bliss, J.P., Acton, S.A. (2003). “Alarm mistrust in automobiles: How collision alarm reliability affects driving.” Applied Er-
gonomics, 34(6). Pp. 499-509. Breznitz, S. (1984). “Cry wolf: The psychology of false alarms.” Hillsdale, NJ: Lawrence Erlbaum Associates. Clarke, D.L., McCauley, M.E., Sharkey, T.J., Dingus, T.A., Lee, J.D. (1996). “Development of human factors guidelines for advanced traveler information systems (ATIS) and commercial vehicle operations (CVO): Task D. Comparable Systems Analysis” (Report No. FHWA-RD-95-197). McClean, VA: Federal Highway Administration. Cook, T. (2012). “A letter from Tim Cook on Maps.” Apple Website: http://www.apple.com/letter-from-tim-cook-on-maps/ Hastings, D. (2013). “Apple Maps directions send drivers to Alaska airport — via the main runway.” New York Daily News web-
site:http://www.nydailynews.com/news/national/apple-maps-drivers-runway-alaska-fairbanks-airport- article1.1467582#ixzz2tY3T9hiW Hoffler, T.N., Leutner, D. (2007). “Instructional animation versus static pictures: A meta-analysis.” Learning and Instruction, 17, pp. 722-738. Janis, I.L. (1962). “Psychological effects of warnings.” in: G.W. Baker & D.W. Chapman (Eds.), Man and Society in Disaster.
New York, NY: Basic Books. Kantowitz, B. H., Hanowski, R. J., Kantowitz, S. C. (1997) “Driver acceptance of unreliable traffic information in familiar and unfamiliar settings.” Human Factors, 39, pp. 164–176. Kennedy, K.D., Bliss, J.P. (2013) “Inattentional Blindness in a Simulated Driving Task.” Proceedings of the Human Factors and
Ergonomics Society Annual Meeting, (57)1, pp. 1899-1903. Lee, P., Tversky, B. (2005). “Interplay between visual and spatial: The effect of landmark descriptions on comprehension of route/survey spatial descriptions.” Spatial Cognition and Computation, 5(2), pp. 163-185. Lee, J.D., See, K.A. (2004). “Trust in automation: Designing for appropriate reliance.” Human Factors. 46(1), pp. 50-80. Madhavan, P., Wiegmann, D. A., Lacson, F. C. (2006). “Automation failures on tasks easily performed by operators undermines
trust in automated aids.” Human Factors, 48(2), pp. 241–256. Means, L.G., Carpenter, J.T., Szczublewski, F.E.; Fleischman, R.N.; Dingus, T.A.; Krage, M.K. (1992). “Design of the TravTek Auditory Interface” (Technical Report GMR-7664). Warren, MI: General Motors Research Laboratories. Muir, B.M. (1987). “Trust between humans and machines, and the design of decision aids.” International Journal of Man-Ma-
chine Studies, 27, pp. 527-539 Muir, B., Moray, N. (1996) “Trust in automation: Experimental studies of trust and human intervention in a process control simulation.” Ergonom. 39, 3, pp. 429–460 Oldsmobile Corporation (2009). “Oldsmobile History Page.” Oldsmobile webpage: http://www.oldsmobile.com/olds/enthusia-
sts/default6a40.html. Saranow, J. (2008). “Steered wrong: Drivers trust GPS even to a fault.” The Wall Street Journal: http://online.wsj.com/ news- /articles /SB120578983252543135 Sorkin, R. D., Kantowitz, B. H., Kantowitz, S. C. (1988). “Likelihood alarm displays.” Human Factors, 30(4), pp. 445-459. Tabachnick, B.G., Fidell, L.S. (2007). “Using multivariate statistics” (5th Edition). Boston, MA: Pearson Education. Tseng, S., Fogg, B. J. (1999). “Credibility and computing technology—Users want to trust, and generally do. But that trust is un-
dermined, often forever, when the system delivers erroneous information.” Communications of the ACM, 42(5), pp.39–44.
LISTED IN THE AHFE DIGITAL BOOKSTORE CATALOGUE
Explore the complete digital volume
Advances in Cognitive Engineering and Neuroergonomics
Read this individual research paper free through the original publisher, or explore the full digital proceedings book.
ISBN 978-1-4951-2101-2
Explore this ISBN in the AHFE Bookstore ↗Listed in the July 2026 bookstore catalogue; search by ISBN to confirm current availability · Digital book purchase optional