Aleli Abegail Magadia, Krichelle Bernadette Medel, Stella Maris Reyes, Lorelie Grepo (2019). Eye Tracking Study: Overhead Menu Board and Its Effect on Consumer Purchase Decision. In: Advances in Cognitive Engineering and Neuroergonomics. AHFE Open Access, vol. 7. https://doi.org/10.54941/ahfe100228
Overhead menu boards are intended to aid the business in its operation. Aside from informing the customers on what the store has to offer, it could also be used as marketing tool to influence the decision of the customer and increase sales. Up until now, there has been no concrete data on how people examine menu boards and how it actually affects their purchase decision.To help maximize the use of these menu boards, a survey was conducted on their effectiveness in the tea shop business. Students and young professionals were asked to assess these menu boards based on their experience. At the same time, an eye tracking study was also conducted to give clear explanation on how consumers look and process the pieces of information presented on these boards.From these, it has been found out that indeed overhead menu boards affect the purchase decision of customers especially those who are not frequent buyers. Guidelines such as the number of boards consisting the menu, emphasis on the best sellers, font style and color to be used, text spacing and format, placement of the menu board in the shop, and the how these pieces of information should be presented/arranged on the menu board were suggested.To further improve the study, it was suggested that a study on menu boards used in another type of business could be done. Major differences with the optimal design derived for tea shop menu boards, if any, could then be assessed. Also, a more general set of samples/subjects could be used to further strengthen or validate the results obtained in this study.
Overhead menu boards which are normally placed above the counter, plays a major role as the store’s primary “sales agent” since these boards answer basic customer questions such as “what do you have?”, “what are my choices?” or “what are your special offers for the day/season?” Overhead menu board is basically used to present the products of a restaurant/shop to the customers. It can also be used to promote new products or to highlight the store’s specialty. Furthermore, these menu boards are used as a primary sales tool to manipulate or affect customer decisions since approximately 80% of customers’ purchase decisions are made at the moment they’re about to give their orders or choose a product – also referred to as the Point of Purchase (POP) (Rule, 2008).
For the last couple of years, milk tea has become the new favorite of students and young professionals. Every day, tea shops are packed with students enjoying their choice of drink while studying for exams, making academic papers or just having a leisure time with their friends. Hence, many entrepreneurs have identified this type of business as a potential opportunity.
DEVELOPING AN OPTIMUM OVERHEAD MENU BOARD DESIGN Menu Board as a Marketing Tool
In the competitive environment of Philippine milk tea industry, knowing how customers process the information presented on the overhead menu board is vital to be able to optimize the use and benefits of this visual display material. In a similar study on menu-labeling, the optimization of menu labels caused an increase in sales of approximately 27% (Guéguen & Jacob, 2011).
Objective This study aims to determine how customers look at overhead menu boards and its effect on their purchasing decision. At the end of this study, recommendations on how the information on menu boards should be presented in order to have positive optimal effect on sales is made. In effect, management can design/redesign their menu boards appropriately.
METHODOLOGY
Three tea shops were involved in this study and each one of them has significantly different overhead menu board design in terms of colour scheme, board placement, and size.
Survey Initial data was gathered through survey to evaluate the factors that may affect a customer’s purchasing decision. A sample size within the range of 201 and 384 was used based on a similar study on book-type menu (Kimes, Sessarego & Yang, 2009). The results of the survey were used to support the results of the eye tracking experiment conducted.
Eye Tracking Study An eye-tracking experiment was also done to determine the behaviour of the customers while ordering at these tea shops. To have valid conclusions, forty one subjects were tested (Yang, 2012). Right before the experiment, each subject answered a set of questions about the factors influencing their purchase decisions and frequency of their visits to the store. The questionnaire required a few personal details to be filled up. An eye tracker was then worn by the subject and calibrated for about 2 to 60 minutes to obtain accurate results. The duration of the calibration ranged from 2 minutes to 1 hour. The recording of eye movements started right before the subject looked at the overhead menu and ended after he/she successfully placed his/her order at the counter. Lastly, the subject finished answering the second set of questions on the questionnaire.
Data Analysis With the aid of the EMR dFactory software, videos recorded through the eye tracker were viewed. The trace feature of the software made it easier to examine where the eyes focus and their movement. Noting down these eye movements based on the trace marks made, eye behavior and the relative eye-fixation frequency were obtained.
Incorporating the survey results, questionnaire answers (corresponding to the videos used), and eye-fixation frequency diagram, an optimal menu board template was designed. Recommendations regarding the menu board design were also provided.
DATA PRESENTATION AND ANALYSIS Survey Results
For one month, only 221 teashop-goers were surveyed regarding factors that affect their decision making in front of the counter (Figure 1).
Figure 1. Factors affecting purchase decision
Figure available in the original PDF paper.
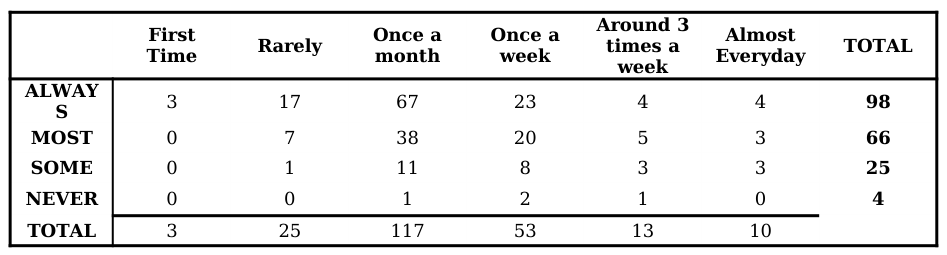
The results have shown that the primary factor that affects their purchase is the taste of the tea. Product presentation on the menu board falls just below average priority with 39%. Majority of the respondents visit tea shops around once a month which may possibly affect the familiarity of the customer to the store’s specialties and the design and layout of its overhead menu board (Figure 2).
First Time Rarely Once a month Once a week Around 3 times a week Almost Everyday
53%
Figure 2. Frequency of Visits
Figure available in the original PDF paper.
2%
12%
Majority of those who visit the shops refer to the overhead menu board (Figure 3). As a matter of fact, only 14% of the customers seldom or never looked at the menu boards at all. These menu boards do not simply provide drink selections but as well as the information regarding the product’s price or the type of drink it belongs to. Because of this, the reasons for reference on the menu can be varied depending on the customer.
ALWAYS MOST SOME NEVER
53% 33%
Figure 3. Frequency of Referral to the Menu
Figure available in the original PDF paper.
Table 1. Frequency of Visit vs. Frequency of Referral to the Menu Around 3 Once a times a
Analysis and Comparison of Overhead Menu Boards of Three Tea Shops The first shop’s menu board looks neat and spacious with simple color schemes and font styles (Figure 4). It is located at an angle relative closer to the line of sight. Feedback from the respondents commended the simplicity of the design. Customers also appreciated the classification technique and strategic placement of price. However, some customers believed that with the available empty spaces on the board, the design can still be improved by adding a few pictures of their products, for example, their best sellers. Furthermore, the additional products added to the menu which are written on the yellow board are not given much emphasis. Although it has a distinct color and is designed differently from the others, its small size and location (at the corner of the board) make it less noticeable.
Figure 4. First menu board
Figure available in the original PDF paper.
The second menu board is not easily seen upon entering the shop because of its size and placement. It is located behind the counter and has colorful fonts with its products classified according to type (Figure 5). Some respondents liked how the menu board was eye catching and lively. However, most felt that there were too many things going on on the board and were not satisfied with how the products were categorized. Since the products were not well- classified and their names were not common, respondents wanted to see brief descriptions of the products to help them decide what to buy.
Figure 5. Second menu board
Figure available in the original PDF paper.
The third overhead menu consists of the most numerous drink variants amongst the three tea shops (Figure 6). Aside from milk tea, it also offers coffee based and non-coffee based frappucino, lemonade coolers and soda pops which are not offered by the other two tea shops. It features some photos of their products. Its products are organized by variant category and the prices are very noticeable on the right column of each board. Also, the boards are located on top (overhead) of the cashier – which makes it harder, relative to other two tea shops, to browse. Based from the responses of the survey, the third menu board was criticized due to the very small text and the crowded layout of the board.
Figure 6. Third menu board
Figure available in the original PDF paper.
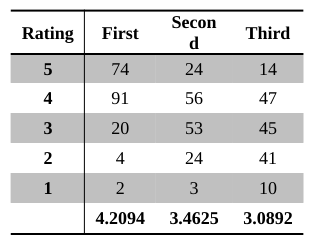
The result of the evaluation of the three menu boards showed the first board as the best among the three mainly because of its neatness, readability, as well as the product categorization (Table 2). The second board received positive remarks because of the presence of many colors in its menu but was equally criticized due to the disorganization of elements and difficulty in reading the items on the menu. The third was last in rank mainly because of the difficulty in reading the product names which are very small, presence of too many options/information in one board, and its location. Customers have to look way above their line of sight in order to see what’s on top of the list. However, respondents also commended the way the drinks were categorized and organized on the board.
Table 2. Average rating for the three menu boards Rating First Secon d Third
Eye Tracking Study Results There were 11 subjects tested at the first tea shop. However, only 10 had identifiable gaze patterns. Through close observation on where the subjects look at and how long they focus, a diagram on the relative eye-fixation frequency for the three menus was made (Figure 7-9). It is evident that most customers focus on the part closer to the eye level. It is also visible how the yellow board seemed to be non-existent to the eyes of the customers, particularly those who are not regular customers of the tea shop. Out of the 10 subjects, only 2 took their time checking the yellow board – both of them are frequent customers of the shop. Also, since the price is placed above each tea subgroup, the observed eye movement is up-down-next board up-down and so on.
Figure 7. Relative eye-fixation frequency diagram of the first menu board
Figure available in the original PDF paper.
Sixteen subjects were tested but only 10 of them have evident eye-fixation patterns (Figure 8). Based on the relative eye-fixation frequency diagram, customers focus on what’s directly in front of them. Furthermore, customers normally only look at what’s in the menu to guide them in their decision-making and ignore what’s not in the menu, especially if it’s just printed on a white paper which is why the “specialty section” on the right side of the menu was completely ignored by the correspondents. The results of the eye tracking study have shown that none of them looked at the bondpaper or probably they didn’t notice it at all. Eye movement of the respondents was also in a vertical manner (up-down/down-up) since the price is located above each tea category.
Figure 8. Relative eye-fixation frequency diagram of the second menu board
Figure available in the original PDF paper.
Figure 9. Relative eye-fixation frequency diagram of the second menu board
Figure available in the original PDF paper.
Nine retraceable gaze patterns were used to form the relative eye-fixation diagram for the third overhead menu board (Figure 9). The first two boards (from the left) of the overhead menu board are located directly in front of the shop’s entrance which is why the two have the highest eye-fixation frequency. Furthermore, those items located at the lower portion of the menu board are noticed more than those at the top. Eye movements for this type of menu board are sideways (horizontal). Whenever a customer sees an item of interest, they move their gaze horizontally to the right to look at the price of the item. Also, based on the study conducted, very little or no interest was given to those items at the third until the last board to the right.
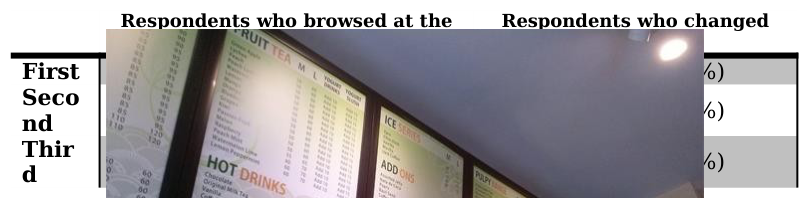
Relationship between the Survey and Eye Tracking Results Incorporating the survey results to the findings obtained from the eye tracking study, it has been found out that majority of the customers (more than 50%) refer to the menu board and browse its whole expanse (Table 3). However, results from the eye tracking study suggest that the wider/larger the menu board, the lesser possibility of customers looking at and examining all the items presented on the display since it would take more effort and time.
Table 3. Eye tracking study findings Respondents who browsed at the
Furthermore, as observed from the eye tracking videos, all subjects looked at the price of the item that caught their attention. Based on the survey results, this could be attributed to the fact that majority of customers consider price in their purchase decision. As an additional note, the simplicity of the design and the readability of the information written on the menu board, affect the duration of the decision-making process. From the experiment, more than half of the subjects didn’t have planned orders and so it was the menu board which guided them in choosing what to buy. Thus, it can be concluded that indeed menu boards affect and influence the purchase decision of the customers, especially those who don’t frequently go to tea shops.
RECOMMENDATIONS Upon analysis of the overhead menu using the results from the eye tracking study and survey, the researchers suggests the following:
1. The menu board should only consist of 2-3 boards and be placed where it is most easily seen upon entering the shop (e.g. eye level). 2. For best sellers, they must be strategically placed where the customer can easily see and must be highlighted to gain more attention and hopefully sales. Placement of best sellers at the right-most part of the menu led to less customers looking to it or noticing it. 3. Providing a picture of the best selling product is a good way to market it to the customers since these pictures attract attention. 4. Font size should be large enough so that it could be read easily by the customers. 5. Font size as well as font color should be consistent as much as possible so that the board wouldn’t seem chaotic and disorganized. 6. Words and lines should have enough space between them in order for them to be legible. 7. Products should also be categorized properly so that it would easier for customers to look for a specific type of product variant. If the category is vague, or if a new product is introduced, it is recommended that a brief description should be placed in order for the customers to know what the product is and stir their curiosity.
CONCLUSIONS
Overhead menu boards indeed affect customer purchase decision. Thus, it is important for overhead menu boards to be designed properly to optimize its positive effect on the customer decision-making and sales. Important details or information must be highlighted properly. Furthermore, ergonomic considerations must be made to make it easier for the customers to choose and place their orders.
To further improve the study, menu boards used in another type of business could also be assessed. There could be major differences with the optimal design derived for tea shop menu boards. Also, a more general set of samples could be used to further strengthen the results obtained in this study.
REFERENCES
Guéguen, N. & Jacob, C. (2011, July 13). The effect of menu labels associated with affect, tradition and patriotism on sales. Food Quality and Preference, 23, 86-88. http://dx.doi.org/10.1016/j.foodqual.2011.07.001. Kimes, S. E., Sessarego, M. M., & Yang, S. S. (2009). Menu price presentation influences on consumer purchase behavior in
restaurants. International Journal of Hospitality Management, 28, 157-160. Retrieved from http://www.sciencedirect.com/science/article/pii/S0278431908000558. Rule, C. S. (2008, October 1). Menu Suggestions. Restaurants & Institutions. Retrieved from http://cherylsternmanrule.com/pdfs/rnioct.pdf. Yang, S. S. (2012). Eye movements on restaurant menus: A revisitation on gaze motion and consumer scanpaths. International
Journal.
LISTED IN THE AHFE DIGITAL BOOKSTORE CATALOGUE
Explore the complete digital volume
Advances in Cognitive Engineering and Neuroergonomics
Read this individual research paper free through the original publisher, or explore the full digital proceedings book.
ISBN 978-1-4951-2101-2
Explore this ISBN in the AHFE Bookstore ↗Listed in the July 2026 bookstore catalogue; search by ISBN to confirm current availability · Digital book purchase optional