Shuling Li, Dunxing Wang, Wei Zhang (2021). Effects of Interface Complexity of Head-up Display on Drivers’ Driving Performance and Self-Perception. In: Advances in Human Aspects of Transportation: Part II. AHFE Open Access, vol. 16. https://doi.org/10.54941/ahfe100679
This paper focused on the effects of interface complexity of HUDs on drivers’ driving performance and self-perception. During the experiment, participants need to perform four tasks, namely car-following, lane changing, speed control, and response to an urgent event, all with either of five randomly chosen HUD interfaces with different levels of complexity shown to the drivers. The questionnaires to investigate drivers’ driving easiness, satisfaction, efficiency, mental workload and task complexity were collected immediately after finishing the tasks. Results showed that both perceived effectiveness and satisfaction have reverse “U” shape relationship with HUD interface complexity. This paper made a contribution to interface design of HUDs on automobiles as well as made suggestions on information complexity design, which can improve drivers’ driving performance and safety.
In recent years, smart devices of automobiles have been developed rapidly. Head-up display (HUD) is one of them. HUD can present data without requiring users to look away from their usual viewpoints. It was originally developed to help pilots operate aircrafts, especially military aircrafts, more safely. The first use of HUD technology was in 1988, and it was introduced to the automobile industry by General Motor (GM) and Pontiac models (Smith and Fu, 2011). Nowadays, some automobiles have been equipped with an HUD in front of their windshields. HUD has become an essential device in most luxury vehicles, but it is not widely used in daily life. As for the design of HUD, there can be many different kinds of information on the display, such as speed, warnings, gas level, gear position, radio setting, temperature, position navigation and so on, which can help the driver operate safely and efficiently.
HUD on Driving Performance In prior studies, some found that HUDs could make some positive effects on driving performance. The use of HUDs can improve driving control and driving safety (Charissis, 2006). Drivers’ response time to an urgent event is faster with an HUD than that with a HDD (head-down display), and speed control is also more consistent with an HUD (Liu and Wen, 2004). In addition, mental workload can also be decreased, and it is good for first time users (Liu,
2003). Drivers feel safe and satisfied when they are driving with a HUD (Tonnis and Lange et al., 2007). With an HUD, drivers may have a clear viewpoint of the driving task, making driving more efficient. At the same time, it can reduce complexity of driving. In 2003, Yung-Ching Liu investigated difference in driving performance between drivers’ attention on HUDs under low and high road conditions (Liu, 2003). However, there are also some bad effects on using HUDs, such as focal distance may affect drivers’ accommodation and perception of actual objects while driving. Meanwhile, HUD images may clutter or block drivers’ view and affect visual attention (Tufano, 1997). As for the measurement of driving performance, Yung-Ching Liu used mental workload and speed control (Liu and Wen, 2004). Some researchers also use error rates and response time in their study.
Since HUDs have effects on driving, interface design of HUDs is very important. Watanabe and Yoo et al. studied the effect of HUD warning location on drivers’ response and performance enhancement (Watanabe and Yoo et al., 1999). Other researchers developed a full-windshield HUD interface to improve drivers’ spatial awareness and response time under low visibility conditions (Charissis and Papanastasiou, 2010). Shana Smith used Kansei engineering to produce a new HUD which is more acceptable based upon consumers’ feelings and demands. Since driving is a heavy visual task, drivers need a visual interface to help them focus their attention on the road ahead. HUDs have been used to reduce drivers’ visual and cognitive workload, without any physical interaction (Smith and Fu, 2011). The results of their paper can also be used to customize an HUD presentation image, which caters to the drivers’ feelings and emotions. Tonnis et al. built a virtual bar and projected it in front of a car using an HUD, to assist drivers in longitudinal and lateral control (Tonnis and Lange et al., 2007).
Information Complexity on Driving Performance Previous researches have shown that decisions are affected by uncertainty ambiguity and limited human capacity. It is hardly possible for anyone to be observant of everything at the same time. It is important to take into account what is known about limitations of human information processing (Svensson and Angelborg-Thanderez et al., 1997). Moray cited research where attempts were made to decide what is the optimal number of elements in decision making in uncertain situations. Normally it is not an advantage to have more than seven elements. The same conclusions are valid for judgment and estimation. The numbers even appear also in applied research on pilot performance (Moray, 1986). Miller found that humans cannot discriminate between more than half a dozen one- dimensional entities; nor can they handle more objects in their short term memory or control more content in their attention (Miller, 1956).
Eustase found that when more than seven simultaneous threats were presented to the pilot, his outcome, in terms of number of omissions and errors, radically deteriorated (Easterbrook, 1959). Way et al. stressed the importance of reducing display clutter and making critical information more evident (Way and Martin et al., 1987). Other researchers have done some analysis on the cognitive information complexity. Kushwaha found that all the nine Weyuker properties have been satisfied by cognitive information complexity measure and hence established cognitive information complexity measure based on information contained in the software as a robust and well- structured one (Kushwaha and Misra, 2006).
Preceding literatures showed that there were lots of researches on HUDs, especially for the information presentation and the effect on drivers. Driving performance and self-perception are way to measure whether the design of HUD is user-centered or effective for driving. However, the interface complexity design is widely used in aviation, which is not a consideration on the study of HUDs on vehicles before. There are many surveys on information complexity, but few on HUD designs. Thus this paper aims to study the effects of interface complexity of HUD on driving performance and self-perception, so that it can provide useful advices on HUD designs, which will improve the drivers’ driving performance.
METHODOLOGY
In order to investigate the influence of interface complexity on driving performance and self-perfection and gather sufficient information to analyze, a questionnaire, which investigated the entire different hypotheses, statements and tendencies, is essential. Meanwhile, it is necessary to classify the questionnaire into three parts with each part researching on demographics, easiness, interface complexity and satisfaction on account of keeping the questionnaire’s validity. Thus, the most frequent 7-point Likert-scale questionnaire from strongly disagree to strongly agree was used.
Firstly, in order to keep the inter consistency of different parts of this questionnaire, we use three independent questions with respect to each dependent variable. And all of these questions were either collected from the widely used CSUQ questionnaire (Computer System Usability Questionnaire) and SUS questionnaire (the System Usability Scale) or revised according to our experiment request (Lewis, J. R.,1995; Bangor, A. et al, 2008). Secondly, each participant would immediately receive one paper of questionnaire to evaluate the current HUD interface in case that they may forget their real feeling after the experiment. Thirdly, all the answers given by the participants would be checked whether this data satisfied the normality assumption. And for those data, which don’t satisfy, a throwing- out or changing will be done to them. Then, we would check if there is good internal consistency among every three questions and whether they all examine the same dependent variable by checking the value of Chronch Alpha of the answer. Fourthly, one-way ANOVA with LSD ( α=0.01 ) would be carried out to find out whether there is significant difference between the interface complexity and driving performance and self-perception. Finally, we will discuss the result of this study in detail and compare our findings with literatures. At the same time, we also explain every detail finding and limitation and point out the future research direction.
Participants Twenty participants (all males, mean age=23.7, SD=3.81), who are students of a university, took part in the experiments. All of them have a driving license and driving experience. They also have experiences in a virtual environment and used a driving simulator before, such as video game car driving simulator.
Tasks The experiment contains four tasks, which are car following, lane changing, speed control, and response to an urgent event. The participant will drive in a virtual city road. Firstly the participant will have a one-minute straight drive following a car, and then the participant will change his lane to left and then right. Secondly the participant will turn left on a cross, then go straight and stop before a sidewalk. During the experiment, the participant must follow a car once, change his lane five times, turn left once and stop before a sidewalk. When the participant finishes this task, he will fill out the questionnaire. The driver needs to repeat it five times. Every time the interface on the HUD will be changed, and the five images will be shown randomly to the driver.
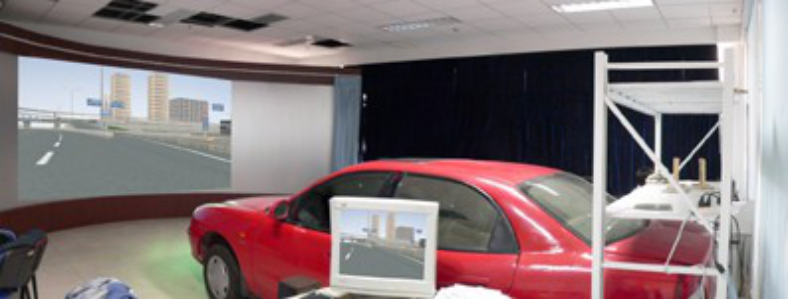
Apparatus This experiment was taken in a full cockpit simulator, which consists of a modified car and a projection system. The HUD we use is made of a projector and a film. We put this film on the windshield of the car, and let the projector projects the HUD images when the driver is driving. In this way, we can show the interface that designed to the participant (see Fig.1). The software we use is Vega Prime.
Figure 1. State Key Laboratory of Automobile Safety and Energy
As for the HUD interface, after we found out the dependent and independent variables, we used these items to design five HUD image samples. It represents five levels of the interface complexity of HUD from No.1 to No.5. The information on the interface is increasing from speed to road condition and navigation. The images are shown as below (see Fig.2).
Fig.2 Interfaces of five HUD designs
Procedure Participants will spend about 40 minutes to finish the experiment, including an introduction, a driving training, a series of driving tasks, and filling out the questionnaires. Firstly, we will give a detailed introduction to the participant about the HUD and the participant will fill out the personal information questionnaire. Secondly, the participant will have driving simulation training. Thirdly, the participant will finish the driving tasks mentioned above and fill out the questionnaire. After all of this the participant will get his/her remuneration.
RESEARCH FRAMEWORK The main objective of this study was to measure the influence of HUD interface complexity on drivers’ driving performance and self-perception, which can be measured in terms of perceived complexity, subjective effectiveness, easiness, satisfaction, mental workload, and driving task complexity. Firstly, measuring perceived complexity of these five HUD interfaces can not only provide us with drivers’ real feeling of HUD interface complexity, but it is also a good form of checking the consistency between designed interface complexity and perceived interface complexity (Liu, Y., & Wen, M., 2004). Secondly, measuring subjective effectiveness, easiness, and satisfaction is of great importance since these measurements demonstrate drivers’ feelings and thoughts in the whole driving process (Koss, B., & Sieber, A., 2011). In addition, drivers are the ultimate users and purchasers of HUDs and hence, drivers’ satisfaction and preference are the most vital standards of checking the effectiveness of HUD interfaces (Kiefer, R. J., 1998). Thirdly, it is also of great significance to measure drivers’ mental workload and driving task complexity. For one thing, drivers’ mental workload is a measurement which reflects drivers’ mental requirement and occupation and will play an important role in influencing drivers’ driving performance in the long run. For another, measuring driving task complexity can offer drivers’ subjective efforts in the whole driving process and undoubtedly is a vital index (Wolffsohn, J. S. et al, 1998).
According to the existing researches and a short interview with experienced drivers, a total of 5 hypothesizes are proposed as follows.
Hypothesis 1a: Both the most complex and the simplest HUD interface will not bring drivers with the best perceived effectiveness, thus, the effectiveness curve should be reverse “U” shape (Chu, K. et al, 2008).
Hypothesis 1b: Similar to Hypothesis 1a, there should be a reverse “U” shape relationship between interface complexity and perceived easiness.
Hypothesis 1c: Similar to Hypothesis 1a and Hypothesis 1b, there should be a reverse “U” shape relationship between interface complexity and satisfaction.
Hypothesis 2a: With the increasing of HUD interface complexity, the amount of information that HUD provides is also increasing; thus, there should be a positive relationship between HUD interface complexity and drivers’ mental workload (Frey, T. W., 2001).
Hypothesis 2b: Similar to hypothesis above, there should be a positive relationship between HUD interface complexity and driving task complexity.
RESULTS
Perceived complexity One-way ANOVA with LSD ( α =0.01) was conducted among these HUD interfaces. Results show that there is a significant difference between perceived complexity and HUD interface complexity: F (4, 95) =83.740, p<0.001.
Fig.3 Comparison of mean perceived complexity between different interfaces
As for significance among these interfaces, except for the HUD interface No.1 and No.2, the left ones all have significance between each other (p<0.01). We could also see an increasing trend of interface complexity (see Fig.3).
Subjective Effectiveness Similar method was also conducted to examine the relationship between subjective driving effectiveness and HUD interfaces, and there is a significant difference between them, F (4, 95) =3.983, p=0.005 (see Fig.4).
Fig.4 Comparison of mean effectiveness between different interfaces
There is a nonlinear relationship between subjective driving effectiveness and HUD interface complexity. It is obvious to see that drivers’ subjective effectiveness increases when the interface complexity increases from interface No.1 to No.3. However, there is a significant decreasing trend from interface No.3 to No.4. To step further, three interfaces, namely No.1, No.2 and No.4, have significant differences with interface No.3 (p=0.008, p=0.001 and p=0.002 respectively).
Easiness One-way ANOVA was conducted between easiness and HUD interfaces, and results indicate that there is a significant difference between them: F (4, 95) =4.643, p=0.002. Drivers’ feeling of easiness decreased when the HUD interface complexity increased (see Fig.4), which was beyond our expectation. Three interfaces, namely No.1, No.2 and No.3, have significant differences with interface No.5 (p<0.01, p=0.001 and p=0.004 respectively). As for the interface No.4 and interface No.5, significance was found at the 0.05 level (p=0.011).
Fig.5 Comparison of mean easiness between different interfaces
Satisfaction One-way ANOVA was conducted between satisfaction and HUD interfaces, and results indicate that there is a significant difference between them, F (4, 95) =6.515, p<0.001. As shown in Fig.6, there is an increase of drivers’ satisfaction when the HUD interface complexity increases from interface No.2 to No.3 (p<0.01), which is the same as No.2 to No.5 (p=0.005). Nevertheless, we can also receive that drivers’ satisfaction begin to decrease when it comes to HUD interface No.3 and interface No.4 (p=0.054).
Fig.6 Comparison of mean satisfaction between different interfaces
Mental Workload In addition to measure drivers’ subjective feelings in the driving process, we also wonder the influence of HUD interface complexity on drivers’ mental workload. This is of great importance since high mental workload in driving implies underlying dangers, such as tiredness, distraction, and etc. Significance was found between mental workload and interface complexity, F (4,95)=4.933, p=0.001.Results were shown in Fig.7.
Fig.7 Comparison of mean mental workload between different interfaces
As shown in Fig.7, there is a significant increase of drivers’ mental workload when the HUD interface changes from interface No.2 to No.4 (p=0.001) and No.5 (p=0.004), which is the same as No.1 to No.4 and No.5 (p<0.01). Besides, we can also see a marginally significant increase of drivers’ mental workload from interface No.3 to No.4 (p=0.099) and a slightly decrease of mental workload from interface No.4 to No.5.
Driving Task Complexity Though we have examined the perceived complexity of HUD interfaces, another interesting question is that whether the relationship between driving task complexity and HUD interfaces is the same as the relationship between perceived complexity and HUD interfaces. Significance was found between them, F (4,95)= 8.417, p<0.001. And results were shown in Fig.8.
Fig.8 Comparison of mean driving task complexity between different interfaces
As demonstrated in Fig.8, in general, there is an increase of driving task complexity when HUD interfaces change from interface No.1 to No.5. In addition, we can also obtain that there is a significant difference in terms of mean driving task complexity between HUD interface No.1 and No.3, No.4, No.5 (p=0.003, p=0.009 and p<0.01) and interface No.2 and No.5 (p<0.01).
DISCUSSION
Perceived complexity. Perceived complexity of these five interfaces is dominantly in accord with the amount of information displayed on each interface. That is, the more complex the HUD interface was designed, the more complex the drivers would perceive. This result was also an illustration that the complexity of HUD interface would really determine the perceived complexity of drivers who used it. Among all these five HUD interfaces, interface No.4 and interface No.5 are the most complex ones for drivers and interface No.1 and interface No.2 are the simplest ones.
Subjective effectiveness. There is a significant increase of subjective driving effectiveness when the HUD interface complexity is growing and there also is a significant decrease when the HUD interface complexity is too high. This means the hypothesis that there should be a reverse “U” shape relationship between HUD interface complexity and effectiveness has been proved, that is, there is an optimal HUD interface complexity existing in terms of subjective effectiveness. However, in the existing researches, optimal interface complexity was found related to user characteristics, which means optimal interface complexity is different mutually (JH Carlisle, 1974; TJ Massaro, 1996).
Easiness. Since one of our hypotheses is that drivers will not feel easy in the driving process when the interface complexity is too low or too high, we expect to see a reverse “U” shape in relationship between easiness and interface complexity. Results were shown in Fig.5. Though this result is beyond our expectation, it is still important to pay attention to this finding. Simply speaking, one reason why drivers got less easiness when the amount of information is increasing may be the distraction, which is caused by information shown on the HUD interfaces, is also increasing (Olsson, S. et al., 2000;Nowakowski, C. et al., 2001). Hence, drivers under condition that HUD interface complexity is high may not be able to keep their attention on the road as easy as those under low complexity.
Satisfaction. The most important index of measuring drivers’ performance in a subjective way is drivers’ satisfaction under these five kinds of driving conditions. The result has verified our hypothesis that there should be a reverse “U” shape relationship between drivers’ satisfaction and HUD interface complexity. This is a finding with significance since it reminds both the researchers and HUD designers that appropriate complexity of HUD interface is highly needed. This confirms the previous finding that there is an increase of satisfaction when interface complexity increases not too much and a decrease of satisfaction when interface complexity becomes too high (Nielsen, J., 1993; Ahmed, S. Z., 2004).
Mental workload. There is a significant increase in terms of drivers’ mental workload when the HUD interface changes from interface No.2 to No.4 and No.5 and marginally significant increase from interface No.3 to No.4. This is consistent with the existing studies that driving leads to a great mental workload for the drivers by the more complex driving context (Cantin, V. et al, 2009).
Driving task complexity. To have a comprehensive understanding of the increasing driving task complexity, we know that the increasing information of HUD interface from No.1 and No.2 to the others is road warning, road condition and navigation. Thus, this kind of information may occupy drivers’ attention and hence, increase driving task complexity, which has been shown in other researchers’ work (Wickens, C. D., 1994; Wang, W., 2003).
CONCLUSION
The objective of this study is to measure the influence of HUD interface complexity on drivers’ driving performance and self-perception. The main limitation of this study is that drivers driving in simulated driving environment may not behave the same as when they are in the real world since simulated lane and pedestrian are somewhat different in view. Another underlying influence on the experiment results may situate at the sample characteristic of this study since all drivers recruited in this study are university students. Nevertheless, there are six broad conclusions that we can conclude from this study.
Firstly, drivers’ perceived complexity has been proved to be consistent with designed complexity. Specifically, except for the HUD interface No.1 and No.2, and the left ones all have significance between each other (p<0.01). This is also an illustration of the effectiveness of our study. Secondly, the hypothesis that there should be a reverse “U” shape relationship between effectiveness and HUD interface complexity has been proved. To be specific, on one hand, three HUD interfaces (No.1, No.2 and No.3) have significant differences with HUD interface No.3. On the other hand, we can conclude from this research that HUD interface No.3 is the most welcomed and preferred one by drivers. Thirdly, the hypothesis that the easiness curve should be reverse “U” shape has not been proved. Specifically, drivers’ feeling of easiness decreased step by step when the HUD interface complexity increased. Fourthly, the hypothesis that both the most complex and the simplest HUD interface will not bring drivers with the best satisfaction, and the satisfaction curve should also be reverse “U” shape has been proved. This is the most significant finding of this study. Specifically, there is an increase of drivers’ satisfaction when the HUD interface complexity increases from interface No.1 to No.3. However, drivers’ satisfaction begins to decrease when it comes to HUD interface No.4 and No.5. Fifthly, the hypothesis that the more complex of the HUD interface is, the higher drivers’ mental workload will be has been proved. To be more detailed, there is nearly no increase of drivers’ mental workload when the HUD interface changes from interface No.1 to No.2.and from No.4 to No.5.
Finally, in terms of driving task complexity, the hypothesis that the more complex of the HUD interface is, the higher driving task complexity will be has been proved. This indicates that the driving task complexity is increasing with the increasing of HUD interface complexity. Consequently, this study has started with research on the relationship between HUD interface complexity and driving performance and has found some significant findings. Though the research object is HUD interface, it can also be generalized to similar domain which research on interface complexity.
REFERENCES
Ahmed, S. Z., McKnight, C., & Oppenheim, C. (2004). A study of users’ performance and satisfaction with the Web of Science
IR interface. Journal of Information Science, 30(5), 459-468. Alexander, L. (2005). Driver Assistive System Displays for Highway Vehicles. ADEAC, 5, 38-41. Andersen, G. J. and R. Ni, et al. (2011). "Limits of spatial attention in three-dimensional space and dual-task driving performance." Accident Analysis & Prevention 43 (1): 381-390. Bangor, A., Kortum, P. T., & Miller, J. T. (2008). An empirical evaluation of the system usability scale. Intl. Journal of Human–
Computer Interaction, 24(6), 574-594 Boyer, C., Gauthier, F. H., & Gerbe, J. P. (1986). U.S. Patent No. 4,600,271. Washington, DC: U.S. Patent and Trademark Office. Bozdogan, H. (2000). "Akaike's information criterion and recent developments in information complexity." Journal of
mathematical psychology 44 (1): 62-91. Buckley, E., & Stindt, D. (2008). Full colour holographic laser projector HUD. In Proc. SID Annual Symposium on Vehicle Displays (Vol. 15, pp. 131-135). Cant, S. N., Jeffery, D. R., & Henderson-Sellers, B. (1995). A conceptual model of cognitive complexity of elements of the
programming process. Information and Software Technology, 37(7), 351-362. Cantin, V., Lavallière, M., Simoneau, M., & Teasdale, N. (2009). Mental workload when driving in a simulator: Effects of age and driving complexity. Accident Analysis & Prevention, 41(4), 763-771. Carlisle, J. H. (1974). Man-Computer Interactive Problem Solving: Relationships Between User Characteristics and Interface
Complexity. DTIC Document. (Reprinted). Caudell, T. P. and D. W. Mizell (1992). Augmented reality: An application of heads-up display technology to manual manufacturing processes. System Sciences, 1992. Proceedings of the Twenty-Fifth Hawaii International Conference on, IEEE. Charissis, V. (2006). "Driving Simulator for Head-Up Display Evaluation: Driver's response time on accident simulation cases."
DSC-A/P 2006. Charissis, V. and S. Papanastasiou (2010). "Human–machine collaboration through vehicle head up display interface." Cognition, Technology & Work 12 (1): 41-50. Chen, K., Chiu, S. C., & Lin, F. C. (2007). Kansei design with cross cultural perspectives. In Usability and Internationalization.
HCI and Culture (pp. 47-56). Springer Berlin Heidelberg Coburn, W. J. (2009). Attitudes in psychoanalytic complexity. Beyond postmodern: New dimensions in clinical process and theory. New York: Routledge. Doshi, A. and S. Y. Cheng, et al. (2009). "A novel active heads-up display for driver assistance." Systems, Man, and Cybernetics,
Part B: Cybernetics, IEEE Transactions on 39 (1): 85-93. Easterbrook, J. A. (1959). "The effect of emotion on cue utilization and the organization of behavior." Psychological review 66 (3): 183-201. Fadden, S. and P. M. Ververs, et al. (1998). Costs and benefits of head-up display use: A meta-analytic approach. Proceedings of
the Human Factors and Ergonomics Society Annual Meeting, SAGE Publications. Freides, D. (1974). "Human information processing and sensory modality: cross-modal functions, information complexity, memory, and deficit." Psychological bulletin 81 (5): 284. Horrey, W. J. and C. D. Wickens, et al. (2003). The effects of head-up display clutter and in-vehicle display separation on
concurrent driving performance. Proceedings of the Human Factors and Ergonomics Society Annual Meeting, SAGE Publications. Carlisle, J. H. (1974). Man-Computer Interactive Problem Solving: Relationships Between User Characteristics and Interface Complexity: DTIC Document. (Reprinted). Kiefer, R. J. (1998). Quantifying head-up display (HUD) pedestrian detection benefits for older drivers. 16th International
Technical Conference on Experimental Safety Vehicles. Windsor: NHTSA. Kushwaha, D. S. and A. K. Misra (2006). "Improved cognitive information complexity measure: a metric that establishes program comprehension effort." ACM SIGSOFT Software Engineering Notes 31 (5): 1-7. Lee, D. S., Yoon, W. C., & Choi, S. S. (1998). An entropy-based measure for evaluating the cognitive complexity of user
interface. Korean Journal of The Science of Emotion and Sensibility, 1(1), 213-221. Lewis, J. R. (1995). IBM computer usability satisfaction questionnaires: psychometric evaluation and instructions for use.
International Journal of Human-Computer Interaction, 7(1), 57-78. Liu, Y. (2003). "Effects of using head-up display in automobile context on attention demand and driving performance." Displays 24 (4): 157-165. Liu, Y. and M. Wen (2004). "Comparison of head-up display (HUD) vs. head-down display (HDD): driving performance of
commercial vehicle operators in Taiwan." International Journal of Human-Computer Studies 61 (5): 679-697. Liu, Y. and T. Wu (2009). "Fatigued driver’s driving behavior and cognitive task performance: Effects of road environments and road environment changes." Safety Science 47 (8): 1083-1089. Massaro, T. J., & Schmidt, D. J. (1996). Method and apparatus for variable complexity user interface in a data processing system:
Google Patents. (Reprinted). Miller, G. (1956). "The magical number seven, plus or minus two: Some limits on our capacity for processing information." The psychological review 63: 81-97. Moray, N. (1986). "Monitoring behavior and supervisory control." Handbook of perception and human performance. 2: 40-1. Nielsen, J., & Hackos, J. T. (1993). Usability engineering (Vol. 125184069). Boston: Academic press. Nowakowski, C., Friedman, D., & Green, P. (2001). Cell phone ring suppression and HUD Caller ID: Effectiveness in reducing momentary driver distraction under varying workload levels. NASA STI/Recon Technical Report N, 3, 13747. Olsson, S., & Burns, P. C. (2000). Measuring driver visual distraction with a peripheral detection task. Obtained from August. Seder, T. A. and J. F. Szczerba, et al. (2010). "FULL-WINDSHIELD HEAD-UP DISPLAY ENHANCEMENT: ANTI-
REFLECTIVE GLASS HARD COAT.". Smith, S. and S. Fu (2011). "The relationships between automobile head-up display presentation images and drivers’ Kansei."
Displays 32 (2): 58-68. Svensson, E. and M. Angelborg-Thanderez, et al. (1997). "Information complexity-mental workload and performance in combat aircraft." Ergonomics 40 (3): 362-380. Tonnis, M. and C. Lange, et al. (2007). Visual longitudinal and lateral driving assistance in the head-up display of cars. Mixed
and Augmented Reality, 2007. ISMAR 2007. 6th IEEE and ACM International Symposium on, IEEE. Tönnis, M., Klinker, G., & Plavšic, M. (2009). Survey and Classification of Head-Up Display Presentation Principles.
Proceedings of the International Ergonomics Association (IEA). Tufano, D. R. (1997). "Automotive HUDs: The overlooked safety issues." Human Factors: The Journal of the Human Factors and Ergonomics Society 39 (2): 303-311. Wang, W., Chao, D., Kao, C., Wu, H., Liu, Y., Li, C., King, C. (2003). High levels of plasma dengue viral load during
defervescence in patients with dengue hemorrhagic fever: implications for pathogenesis. Virology, 305(2), 330-338 Watanabe, H. and H. Yoo, et al. (1999). The effect of HUD warning location on driver responses. Sixth World congress on Intelligent Transport Systems, Toronto, Canada. Way, T. C. and R. L. Martin, et al. (1987). "Multi-crew pictorial format display evaluation." Wickens, C. D., & Long, J. (1994, October). Conformal symbology, attention shifts, and the head-up display. In Proceedings of
the Human Factors and Ergonomics Society Annual Meeting (Vol. 38, No. 1, pp. 6-10). SAGE Publications.
LISTED IN THE AHFE DIGITAL BOOKSTORE CATALOGUE
Explore the complete digital volume
Advances in Human Aspects of Transportation: Part II
Read this individual research paper free through the original publisher, or explore the full digital proceedings book.
ISBN 978-1-4951-2098-5
Explore this ISBN in the AHFE Bookstore ↗Listed in the July 2026 bookstore catalogue; search by ISBN to confirm current availability · Digital book purchase optional