Christian Purucker, Fabian Rüger, Norbert Schneider, Alexandra Neukum, Berthold Färber (2021). Comparing the Perception of Critical Longitudinal Distances between Dynamic Driving Simulation, Test Track and Vehicle in the Loop. In: Advances in Human Aspects of Transportation: Part I. AHFE Open Access, vol. 15. https://doi.org/10.54941/ahfe100645
The choice of an appropriate research environment is a fundamental issue for research on advanced driver assistance system controllability which precedes questions regarding the criticality of test scenarios and the deduction of pass-fail-criteria. The methodological trade-off between research on test tracks and driving simulation cannot be resolved easily. While test track research allows for the analysis of human interaction with real vehicle dynamics, the investigation of safety-critical situations requires considerable technological efforts and is sometimes not feasible. E.g., the complexity of real-life urban scenarios cannot be readily replicated on a test track. These restrictions do not apply to driving simulations, but limitations concerning visual and vestibular feedback raise the question of external validity. To the best of our knowledge, the perception of critical longitudinal car following distances, as measured by time headway, has been investigated on a limited scope and not under highly standardized conditions. We aim to extend the knowledge in this domain. In our study, three test environments were compared: a dynamic driving simulator, a test track vehicle, and the novel Vehicle-In-the-Loop (VIL), which is a hybrid between a test track vehicle and a driving simulator. As a result, relative validity for the perception of distance measures was established between the test environments. However, time headways were generally judged to be more critical in both simulator environments compared to the test track – a finding that should be considered when conducting future research.
The German research initiative UR:BAN (German acronym “Urbaner Raum: Benutzergerechte Assistenzsysteme und Netzmanagement”, translated “Urban Space: User oriented assistance systems and network management”) pursues the improvement of safety in urban traffic by investigating and developing new advanced driver assistance systems (ADAS) and traffic control measures (Manstetten et al., 2013). Various new ADAS are currently subject to research, including emergency steering and braking functions that may even steer and brake autonomously for a limited amount of time. These systems are likely to increase overall traffic safety, but they also have introduced new challenges to controllability research, since systems as well as deployment scenarios have become increasingly complex. According to industrial standards, such as the ISO 26262 (2007), overall system controllability for the human driver has to be established even with possible system failures. Various guidelines exist for this context, such as the RESPONSE Code of Practice (RESPONSE Consortium, 2006) or the European Statement of Principles on Human Machine Interface (Commision of the European Union, 2006). However, specifications of the employed research environments often remain unclear or inconsistent. The aim of the subproject KON (“Controllability”) within the UR:BAN key issue Human Factors in Traffic is the development and the evaluation of new and existing methodologies for the assessment of system controllability. The current study pursues to address the choice of test environments and driving simulator validity. As such, the study is part of a series of studies that focus on perceptional aspects that are of particular relevance to controllability research on ADAS in urban contexts. While this generally involves various aspects such as vehicle interaction and the perception of longitudinal and lateral distances, the current study focuses on the perceived criticality of longitudinal distances during car following scenarios. First, the subsequent section gives a short overview on problems involved with the choice of research environments in recent controllability research. Second, a review on driving simulator validity studies is provided with particular focus on longitudinal vehicle distance perceptions in car following scenarios. Third, the empirical section describes a validation experiment on criticality rating of longitudinal distances in a car following task between three test environments, a dynamic driving simulator, a test track vehicle and the new Vehicle in the Loop. Finally, results are discussed and implications for research are provided.
THEORETICAL BACKGROUND Choice of research environments
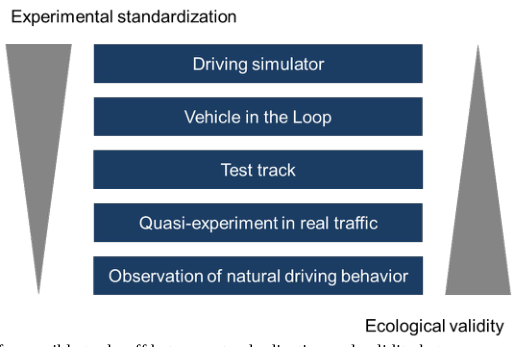
The choice of an appropriate research environment is a central issue in discussions on the suitability of evaluation methodology employed for research on human controllability of ADAS. While there is a wide spectrum of research environments available (cf. Fecher, Regh, Habenicht, Hoffmann, & Winner, 2008 for an overview from research on forward collision mitigation systems), most methods have their particular pros and cons that have to be considered carefully before making a decision. For an illustrative purpose, Figure 1 depicts such a methodological trade-off between some relevant test environments for the dimensions “experimental standardization” and “ecological validity”. However, the trade-off between research environments usually is not clear-cut and often involves multiple judgmental dimensions that may be specific for a particular research question.
Figure 1: Illustration of a possible trade-off between standardization and validity between research environments.
For example, safety-critical system functions can be hardly tested in real traffic conditions for obvious reasons of safety. While controllability researchers traditionally might rely on test track studies in this case to capture participants’ reactions towards functional interventions on vehicle dynamics, this may not be an adequate choice for the evaluation of ADAS that were developed to assist human drivers in complex urban scenarios. Specific features of the road and relevant infrastructure, as well as traffic scenarios that involve multiple road users can be realized on a test track only to a small extent. Particularly in latter test arrangements, another limiting factor is the often tremendous technical and financial effort that has to be taken to avoid putting test track drivers at risk. On the contrary, driving simulators overcome many of the previously mentioned restrictions, as complex or potentially dangerous traffic constellations can be simulated with ease and without endangering participants. However, fundamental issues concerning vestibular or visual feedback in simulator environments (Blana, 1996; Breuer, 2012) might limit the suitability of simulator environments for controllability research. As an approach to overcome some of these limitations, the Vehicle in the Loop (VIL) was developed as a hybrid between a test track vehicle and a driving simulator. Here, the driver actually drives in a real car on a test track while wearing a non-transparent head- mounted display. Visually, the driver is completely immersed in a virtual world, but he feels the real vehicle dynamics from the test track vehicle at the same time (Karl, Berg, Rüger, & Färber, 2013).
Besides the consideration of the specific advantages and disadvantages, the question of validity and generalizability of results is at the core of all decisions for or against a particular research environment. Comparison and calculation of transfer functions for generalization of results between research environments will advance the ability to properly interpret and generalize observed results even beyond a specific research environment. In the following section, we will review results from research on longitudinal traffic and car following maneuvers, particularly focusing on the validity of research environments.
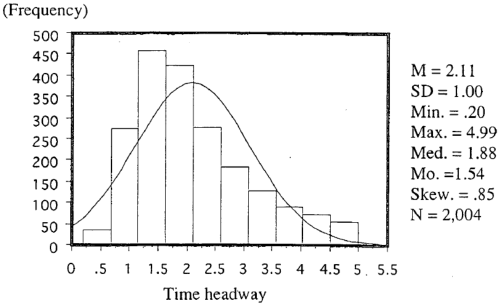
Longitudinal car following and driving simulator validity Longitudinal distances to a preceding vehicle in car-following scenarios are usually measured as time distances (Time Headway, THW). There are several studies that describe observed time distances in real traffic and driving simulators (i.e., Gouy, Diels, Reed, Stevens, & Burnett, 2013; Ichikawa, 2003) or determinants of driven time distances (cf. Brackstone, Waterson, & McDonald, 2009). For urban areas, reported mean THW ranges between 1.75 s (SD = 0.65; Piao & McDonald, 2003) and 2.11 s (SD = 1.00; Ichikawa, 2003; Figure 2).
Figure 2: Distribution of observed THWs in urban traffic (Ichikawa, 2003).
Various predictors have been identified to influence the THW. The speed of the vehicle was found to exert a strong influence on the THW, with lower speed leading to larger THWs and THWs being roughly constant at a value of 1.25 s for speeds larger than 15 m/s (Brackstone et al., 2009). Regarding road type, researchers found that THWs on highways usually were lower than in urban areas with values less than 2 s (Brackstone et al., 2009; Knospe, Santen, Schadschneider, & Schreckenberg, 2002). Another factor that influences the observed THW is traffic density, with higher densities decreasing mean observed THWs down to roughly 1 s (Ayres, Li, Schleuning, & Young, 2001; Knospe et al., 2002).
A large body of research on driving simulator validity provides evidence for at least relative validity (if not absolute validity1) in most areas of investigation, such as choice of speed, brake onset or risky traffic behaviors (cf. Mullen, Charlton, Devlin, & Bédard, 2011). To our best knowledge, however, in-depth investigations of THW have attracted only limited research interest so far (cf. Stam, 2013 for an exception), and particularly validity assessments of THW criticality perceptions during car following tasks are missing largely. In a study comparing THWs at 1 According to Blaauw (1982) absolute validity is reached, when the measured variables have the same numeric values. Relative validity means, that differences between testing environments are detected, but the found effects tend to be in the same direction and of similar magnitude (Godley, Triggs, & Fildes, 2002). Human Aspects of Transportation I (2021) different higher speeds, Stam (2013) finds no difference between a solid base driving simulator and a test track vehicle. However, the study did neither involve lower driving speeds nor the assessment of participants’ criticality perceptions of the different time distances.
In the current study, we investigate drivers’ criticality ratings for THW distances during car following. An investigation of the validity of three different research environments, a dynamic driving simulator, a test track and the VIL, is performed, and transfer functions that will allow for proper comparison and generalization of results will be calculated. In addition, the current study enlarges the research base on validity of the new VIL (Berg, Karl, & Färber, 2011; Bock, Maurer, & Färber, 2007; Sieber et al., 2013) with regard to aspects of controllability research and criticality perception of longitudinal car following distances.
EMPIRICAL STUDY Test procedure and scenario
Each participant was assigned to one of the three test environments, the dynamic driving simulator, the test track or the VIL. In the test, the participant had to drive through each of the experimental conditions (see below) in randomized order to account for possible order effects. Instructions in all three test environments were identical, and great effort was put into creating virtual test scenarios that were as similar to the real world test track as possible.
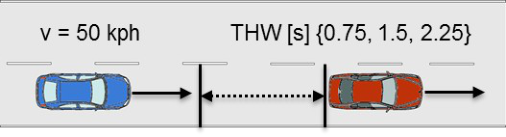
In the study, participants repeatedly drove through longitudinal car-following scenarios, where they had to follow a preceding car at a constant speed of v = 50 kph with different THWs of 0.75 s, 1.5 s, and 2.25 s. In each trial, participants first had to approach the primary vehicle and established the requested THW with the help of visual and acoustic guidance. Once the THW was established, no more guidance was given, and participants were asked to keep the distance constant for at least 2 s before pressing a key. Directly after the keypress, participants were asked to rate the car-following distance on the scale for criticality assessment of driving and traffic scenarios (Neukum, Lübbeke, Krüger, Mayser, & Steinle, 2008).
Figure 3: Sketch of the car-following scenario (participant vehicle in on the left). The THWs were established using acoustic and visual cues.
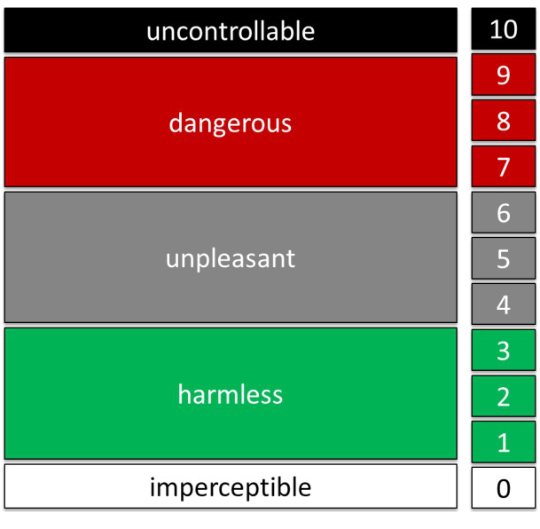
Scale for criticality assessment In the study, we used the scale to assess criticality of driving and traffic situations that has been validated in various contexts of controllability research (Figure 4; Neukum et al., 2008). It is based on a two-step rating procedure, in which participants have to rate the criticality of a situation they experienced while driving. In the procedure, they classify their judgment into the numerically-anchored judgment categories “imperceptible” (0), “harmless” (1-3), “unpleasant” (4-6), “dangerous” (7-9), or “uncontrollable” (10). The numeric values allow participants to indicate tendencies to lower or higher categories. The categories “dangerous” or “uncontrollable” (all numeric values equal or larger than 7) represent scenarios or situations that drivers would not accept in real traffic.
Figure 4: Scale for criticality assessment of driving and traffic scenarios (Neukum et al., 2008).
Participant sample The test drives were performed in all three test environments with sample sizes of n = 30 in each environment. Sample characteristics were balanced for gender and age (see ).
Table 1: Age distribution across the three research environments in the study.
Table available in the original PDF paper.
Dynamic driving simulator Test track Vehicle in the Loop M = 29.5 years (SD = 8.5) M = 29.2 years (SD = 10.9) M = 30.4 years (SD = 10.7)
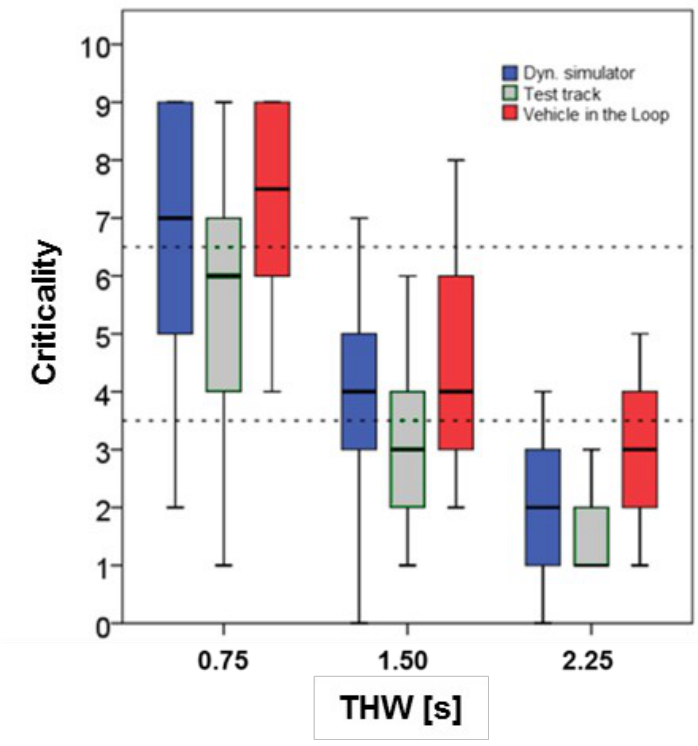
Analysis and results The criticality ratings of the target THWs 0.75 s, 1.5 s and 2.25 s from the car following trials are depicted in Figure 5. Across all simulator environments, the criticality ratings of 1.5 s or 2.25 s are to at least 75 % within the “unpleasant” or “harmless” range, while values of 0.75 s are rated as “dangerous” by 25 to 50 % of the drivers. Generally, lower THWs lead to higher criticality judgments across all research environments. As a tendency, the boxplots show that criticality ratings from the simulator environments are systematically higher than ratings obtained on the test track. In addition, the boxplots suggest that ratings for corresponding target THWs in the VIL are slightly higher than those obtained in the dynamic driving simulator.
Figure 5: Criticality ratings and target THWs across research environments.
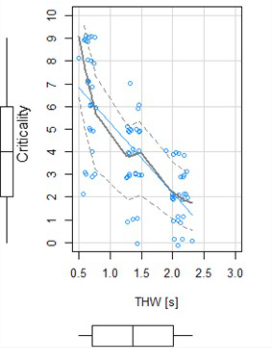
When inspecting the raw THWs and their corresponding criticality ratings (cf. Figure 6), it becomes obvious that measured THWs differ slightly from the respective target THWs across and also within the three different target environments (note that once the target THW was established, participants had to keep the time distance without guidance before making their choice). Across all environments, the observed THW deviations from the target THWs are sometimes even outside a range of +/- 0.5 s, which renders statistical approaches that rely on grouping or binning criticality ratings for target THWs (such as ANOVAs or t-tests for criticality ratings across target THW groups) suboptimal. In addition, the raw data also suggest systematic differences between the test environments, with measured THWs from the dynamic simulator being mostly lower than the target value, while THWs from the VIL seem to be systematically higher.
Dynamic driving simulator Test track Vehicle in the Loop
Figure 6: Scatterplots for criticality ratings and measured THWs across research environments.
To account for the observed data scattering and to obtain a transfer function that allows for a comparison of time distance criticality perceptions across the three different test environments, we used the statistical modeling technique of ordered logistic regressions (cf. Agresti, 2002; Long, 1997). The statistical calculations are performed in R with the MASS package (Venables & Ripley, 2002). For modelling purposes, criticality ratings (serving as the dependent variable) are merged to the ordinal main categories “harmless”, “unpleasant”, and “dangerous”. Independent variables used in the model are the continuously measured THW and the test environment2. The following model is estimated:
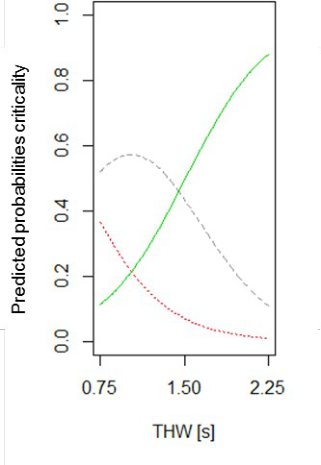
Significant model effects3 were found for THW (β = -2.70, SE = 0.28, t = -9.77, p < .001; thus providing reasonable evidence for relative validity) and for the factor research environment VIL (vs. the dynamic driving simulator as a reference; β = 0.94, SE = 0.33, t = 2.84, p < .01). No statistical effect was found for the factor test track (vs. the dynamic driving simulator as a reference, p = .15). As model coefficients cannot be interpreted directly, predicted probabilities were calculated and displayed in Figure 7, with model results generally confirming the observations from the boxplots in Error: Reference source not found.
2 The dynamic driving simulator was used as a reference in the model calculations, which however does not affect the model results or the model interpretation. 3 The p-value was approximated by comparing the model’s t-value to the standard distribution. Human Aspects of Transportation I (2021)
Dynamic driving simulator Test track Vehicle in the Loop
Figure 7: Predicted probabilities for criticality ratings dependent on THW and research environment.
DISCUSSION
According to common definitions (Blaauw, 1982; Godley et al., 2002), relative validity could be confirmed for the VIL as well as for the dynamic driving simulator for the criticality perception of THW distances to a preceding vehicle in a car following task. Generally, lower THWs led to increased criticality judgments, and criticality ratings with respect to the measured THWs were within the range that would be expected from real traffic data. However, we observed in our study that participants tend to judge time distances they perceive in driving simulator environments to be more critical than similar situations on a test track. This effect could be clearly shown for the VIL, while it was less pronounced for the dynamic driving simulator in a statistical model procedure using ordinal logistic regression.
The observed effects concerning simulator validity are in accordance with the literature. For example, road construction measures for speed reduction were found to be more effective in driving simulators, suggesting that resulting traffic situations were perceived to be more critical and thus led to higher speed reductions (Riemersma, van der Horst, & Heokstra, 1990). A validation study comparing actually driven THWs in car following tasks initially expected to find lower THWs in a static simulator in comparison to a test track vehicle for reasons of physical correspondence, could not confirm this notion based on the empirical results (Stam, 2013). Finally, other not published experiments the authors conducted in theoretical vicinity of the current study seem to confirm that similar longitudinal and lateral traffic scenarios are judged to be more critical in the driving simulator when compared to the test track.
Clearly, these results yield important implications for controllability research and driving simulator research in general. When using longitudinal car following scenarios, researchers should consider that participants tend to rate the distances to a preceding vehicle as more critical than on test tracks. When relying on these criticality assessments for criterion development (e.g., when trying to determine which situational parameters are acceptable to drivers in real traffic), this could easily lead to conservative results. On the other hand, when driving in a driving simulator, participants might also display compensatory behaviors they would not display in real traffic, only because they judge the traffic situation to be more critical. Researchers will have to carefully determine, which effect will be at work in their particular study.
Future research should further investigate psychological mechanisms that underlie or cause the increased perception of criticality in driving simulator experiments, as the current and existing research so far has mainly focused on effect description. A possible explanation for the more critical ratings of a similar traffic scenario in the simulator environments could be the decreased (visual and vestibular) cue availability. This hypothesis could be tested by systematically varying cue availability in future studies. Also, implications for controllability research and the investigation of more complex urban traffic scenarios have to be determined to a bigger extent. Topics for future studies could involve the perception of lateral distances and the perception of longitudinal distances towards standing objects. Finally, further methodological triangulation of the described effect should be pursued (such as letting participants freely determine their THW according to given criticality categories or by extending the data base to further observations, simulators and test drives).
AKNOWLEDGEMENT This study was conducted in the context of the project UR:BAN (Urban Space: User oriented assistance systems and network management). The project UR:BAN is supported by the Federal Ministry for Economic Affairs and Energy due to a decision of the German Bundestag.
REFERENCES
Ayres, T. J., Li, L., Schleuning, D., & Young, D. (2001). Preferred time-headway of highway drivers. 2001 IEEE Intelligent Transportation Systems Conference Proceedings, 827-830. Berg, G., Karl, I., & Färber, B. (2011). Vehicle in the Loop - Validierung de virtuellen Welt. Der Fahrer im 21.
Jahrhundert: Fahrer, Fahrerunterstützung und Bedienbarkeit. VDI-Berichte (Vol. 2134, pp. 143-154). Düsseldorf: VDI-Verlag. Blaauw, G. J. (1982). Driving experience and task demands in simulator and instrumented car: A validation study.
Human Factors, 24(4), 473-486. Blana, E. (1996). Driving Simulator Validation Studies: A Literature Review. Leeds: Institute of Transport Studies. Bock, T., Maurer, M., & Färber, G. (2007). Validation of the vehicle in the loop (VIL) - A milestone for the simulation of driver assistance systems. Proceedings of the 2007 IEEE Intelligent Vehicle Symposium, 612 - 617. Brackstone, M., Waterson, B., & McDonald, M. (2009). Determinants of Following Distance in Congested Traffic.
Transportation Research Part F, 12(2), 131-142. Breuer, J. (2012). Bewertungsverfahren von Fahrerassistenzsystemen. In H. Winner, S. Hakuli & G. Wolf (Eds.), Handbuch Fahrerassistenzsysteme (pp. 55-68). Wiesbaden: Viewweg+Teubner. Commision of the European Union. (2006). Commision recommendation on safe and efficient in-vehicle
information and communication systems: update of the European Statement of Principles on human machine interface. Official Journal of the European Union, 32, 200-241. Fecher, N., Regh, F., Habenicht, S., Hoffmann, J., & Winner, H. (2008). Test- und Bewertungsmethoden für Sicherheitssysteme der Bahnführungsebene. Automatisierungstechnik, 56(11), 592-600. Godley, S. T., Triggs, T. J., & Fildes, B. N. (2002). Driving simulator validation for speed research. Accident
Analysis & Prevention, 44(5), 589-600. Gouy, M., Diels, C., Reed, N., Stevens, A., & Burnett, G. (2013). Preferred or adopted time headway? A driving simulator study. Proceedings of the international conference on Ergonomics & Human Factors 2013, 153– 159. Ichikawa, K. (2003). Considering safe distance between moving vehicles. Memoirs of the Faculty of Education, 53,
123-138. ISO 26262. (2007). Road vehicles - Functional Safety: International Organization for Standartization. Karl, I., Berg, G., Rüger, F., & Färber, B. (2013). Driving Behavior and Simulator Sickness While Driving the Vehicle in the Loop: Validation of longitudinal driving behavior. IEEE Intelligent Transportation Systems Magazine, 23, 42-57.
Knospe, W., Santen, L., Schadschneider, A., & Schreckenberg, M. (2002). Single-vehicle data of highway traffic: microscopic description of traffic phases. Physical Review E, 65(5), 056133-056149. Manstetten, D., Bengler, K., Busch, F., Färber, B., Lehsing, C., Neukum, A., . . . Schendzielorz, T. (2013).
“UR:BAN MV” – a German project focusing on human factors to increase traffic safety in urban areas. Proceedings of the 20th ITS World Congress. Tokyo. Mullen, N., Charlton, J., Devlin, A., & Bédard, M. (2011). Simulator validity: Behaviors observed on the simulator and on the road. In D. L. Fisher, R. Matthew, J. K. Caird & J. D. Lee (Eds.), Handbook of Driving Simulation for Engineering, Medicine, and Psychology. Boca Raton: CRC Press. Neukum, A., Lübbeke, T., Krüger, H.-P., Mayser, C., & Steinle, J. (2008). ACC-Stop&Go: Fahrerverhalten an
funktionalen Systemgrenzen. In M. Maurer & C. Stiller (Eds.), 5. Workshop Fahrerassistenzsysteme - FAS 2008 (pp. 141-150). Karlsruhe: fmrt. Piao, J., & McDonald, M. (2003). Low speed car following behaviour from floating vehicle data. Proceedings of IEEE Intelligent Vehicles Symposium 2003, 462-467. RESPONSE Consortium. (2006). RESPONSE 3: a PReVENT Project Code of practice for the design and
evaluation of ADAS. Riemersma, J. B. J., van der Horst, A. R. A., & Heokstra, W. (1990). Driving simulator in evaluation speedreduction measures. Traffic Engineering and Control, 31, 416-420. Sieber, M., Berg, G., Karl, I., Siedersberger, K.-H., Siegel, A., & Färber, B. (2013). Validation of Driving Behavior
in the Vehicle in the Loop: Steering Responses in Critical Situations. Proceedings of the 16th ITSC.
Stam, T. (2013). Headway performance in the University of Twente driving simulator: a validation study. Master thesis report, University of Twente, Amsterdam.
LISTED IN THE AHFE DIGITAL BOOKSTORE CATALOGUE
Explore the complete digital volume
Advances in Human Aspects of Transportation: Part I
Read this individual research paper free through the original publisher, or explore the full digital proceedings book.
ISBN 978-1-4951-2097-8
Explore this ISBN in the AHFE Bookstore ↗Listed in the July 2026 bookstore catalogue; search by ISBN to confirm current availability · Digital book purchase optional