Dennis Befelein, Christian Purucker, Frederik Schewe, Janik Dostert, Alexandra Neukum (2024). The impact of secondary in-vehicle display animations and their location on driver attention and glance behavior. In: Advances in Human Factors of Transportation. AHFE Open Access, vol. 148, pp. 575–590. https://doi.org/10.54941/ahfe1005249
This driving simulator study explores which kind and amount of non-driving-related animations can be implemented in cars’ front displays without causing significant driver distraction. While in recent years, a large amount of research has been conducted on how driving-relevant information must be displayed to capture the driver’s attention, the question on how non-driving-related animations can be conveyed in front displays without compromising the driver’s attention has rarely been addressed. However, due to the omnipresence of digital displays in present-day vehicles combined with observable efforts of vehicle manufacturers to increase the visual design appeal, the topic currently gains practical relevance. N = 53 participants were presented 16 animations that differed in stimulus salience features like fade-in time, brightness, target color, as well as internal and external movement. These animations were either displayed in the Cluster display or in the Central Infotainment Display (CID) and they were all irrelevant to the three driver tasks: To follow a lead vehicle (Car Following Task), perform a visual Detection Response Task (vDRT) and, optionally, react to a small set of driving-relevant info texts. In Test Drive 1, texts appeared in the Cluster only, whereas Test Drive 2, they appeared in both the Cluster and the CID. This was done to alter the task relevance of the two locations. Although a general effect of animations on vDRT performance could be observed across all study parts, this was with the exception of slow fading-in animations and other factors such as reduced brightness, target color, and the object size in the animation. Additionally, in Test Drive 1 a location effect could be observed: Animations displayed in the Cluster display led to a reduced vDRT performance when compared to animations that were displayed in the more distant CID. This effect disappeared when driving-relevant information texts were introduced to the CID in Test Drive 2. Taken together, visual attention was more vulnerable to animations of increased salience and to animations at lower-effort locations - an effect that can be moderated when the value of a more distant location is increased. The resulting design recommendations may be used to consider the risk of distractive features throughout the whole design process of in-car animations, reducing development costs, maximizing driving safety and providing a positive user experience.
their way into mass-market passenger cars. Modern in-vehicle displays offer projection areas for various animations that are not directly driving-relevant but aim to create a positive user experience. While certainly in contrast to the old and established philosophy of minimizing driver distraction by non- driving relevant stimuli (cf. AAM, 2006), these technical capabilities have aroused the desire for marketers and designers to use them to raise visual appeal and likely increase consumers’ product desires.
In addition to generally condemning driver distraction from non-driving- related tasks, numerous studies have been conducted to investigate how driving-relevant information must be displayed to grasp the driver’s atten- tion and be correctly understood (e.g., Carney, Campbell & Mitchell, 1998; Stanton & Edworthy, 2019), which in turn has resulted in design guidelines by governmental bodies (NHTSA, 2013; Stevens, Quimby, Board, Kersloot & Burns, 2002). However, from the perspective of in-vehicle information system (IVIS) designers, a neglected research question is what kind and amount of non-driving-related animations can be implemented nonetheless (for bespoke reasons) in front displays without distracting drivers.
Animation Distraction in Automotive Research While research exists on the distraction potential of animated displays in basic and applied research (e.g., Bartram, Ware & Calvert, 2001; McKee & Nakayama, 1984; Plaue & Stasko, 2007; Yoo, Kim & Stout, 2004), only a few studies have addressed this topic in an automotive context.
In a driving simulator study, Chen, Hoekstra-Atwood, and Donmez (2018) compared irrelevant animations as involuntary distraction stimuli and a vol- untary distraction task regarding their impact on distraction engagement and driving performance in situations with a braking lead vehicle. Invol- untary distraction appeared to cause longer accelerator pedal release times and shorter minimum time to collision than baseline driving. However, the authors observed large variability in participants’ engagement with the self- paced secondary task and irrelevant stimuli. Brome, Awad, and Moacdieh (2021) compared the effects of different types of digital billboard advertise- ments on driver performance and attention allocation. They found impaired driving performance and decreased driver attention to the road for ani- mated digital billboard advertisements compared to static advertisements. Kim, Kim, Kim, Shim, and Ji (2023) explored animated transition effects on perceived duration and satisfaction on an vehicle touchscreen and found that confusing animation sequences are perceived as distracting by users. How- ever, the study exclusively focused on subjective evaluations, and the impact on driving performance was not included in the analysis.
Nouzovský, Vrtal, Kohout, and Svatý (2022) assessed the impact of several types and sizes of road advertising devices as a potential distraction source for drivers and concluded that dynamic advertising devices attract more attention than conventional static devices. However, dynamic advertising devices did not significantly affect driving quality (number and types of driving mistakes).
SEEV Models in Automotive Research The theoretical derivation of the research hypotheses originates from the SEEV (Salience, Expectations, Effort and Value) models (Eisma, 2021). These
The Impact of Secondary In-Vehicle Display Animations and Their Location 577
are a family of mainly qualitative models that predict or explain the attention- capturing potential of stimuli as a function of salience, expectations, (user) effort, and value (for the user). Within the logic of the models, salience refers to the static features inherent to the stimulus, such as color, size, and lumi- nance, as well as dynamic aspects, such as movement and flashing. Effort refers to the effort necessary for users to observe a specific region distant from their current focus of attention, which may be determined by eye and head movements in the case of a vehicle operator. Expectancy refers to the operator’s expectation that a certain stimulus will appear at a specific posi- tion, which is determined by the base rate of the stimulus. The value refers to the task relevance of the stimulus.
THE CURRENT STUDY: RESEARCH QUESTION AND HYPOTHESES This study investigated the distraction potential of non-driving-related dis- play animations from the perspective of infotainment system designers. The goals were (1) to identify basic animation features (e.g., speed of stimu- lus appearance) relevant to driver distraction, (2) to quantify the effect of different grades of these features, and (3) to evaluate these grades regard- ing their distraction potential. The resulting design recommendations can support designers in conceptualizing safe in-vehicle display animations. By avoiding animation features with high distraction potential from the start of the design process, development costs are reduced, and driving safety aspects are addressed.
The theoretical derivation of the research hypotheses comes from the SEEV models. Within the context of our research, it should be highlighted that the original formulation of SEEV models usually refers to the probability of an important stimulus being perceived and not whether it distracts operators from their primary task. However, drawing attention from the road ahead to a stimulus in the vehicle cockpit may reduce attentional capacities directed toward the road, thereby increasing the likelihood of missing information relevant to driving safety. Therefore, we formulated the following generic hypotheses:
H1: A salient animation (determined by color, brightness, movement, etc.) displayed in the vehicle cockpit is expected to negatively impact visual behavior, particularly visual attention to the road scenery.
H2: The more salient an animation displayed in the vehicle cockpit, the more it is expected to negatively impact visual behavior, particularly visual attention to road scenery. In the current study, various animations were implemented with varying degrees of salience, for example, onset or fade-in duration, brightness, color, movement object, and type of movement. Visual attention was measured via an adopted visual detection response task (vDRT), and general gaze behavior was measured via eye-tracking.
H3: The less effort (i.e., close peripheral view vs. head movement) neces- sary to perceive a certain stimulus at a closer location, the more likely drivers will be distracted by an animation shown there. In this study, animations were presented at a lower-effort location (cluster display) and a higher-effort location, the Central Infotainment Display (CID). Lower-effort locations are expected to impact visual attention more negatively.
H4: The task relevance of a certain stimulus may increase the value and expectancy associated with the specific location where the stimulus is shown. Indirect value-expectancy associations linked to a specific location moderate the distraction potential of an unrelated stimulus shown at a certain location because users are more likely to direct their attention there. In the current study, the expectancy-value association of the CID location between Test Drive 1 and Test Drive 2 varied by displaying the information texts at the CID in the latter drive. The increased expectancy-value association of CID is expected to impact visual behavior, particularly visual attention to the road scenery elicited by unrelated animations shown at this location, more negatively.
METHODS
Driving Simulator The study was conducted using a moving-base driving simulator at the Würzburg Institute for Traffic Sciences (WIVW GmbH) and the WIVW driv- ing simulation software SILAB version 7.0 (Krüger, Grein, Kaussner & Mark, 2005). The integrated vehicle console is identical to a production-type BMW 7 series with an automatic transmission. Three liquid crystal display (LCD) projectors were installed in the dome of the simulator to project a 240
screen image. The motion system of the simulator was not required in this study and remained inactive.
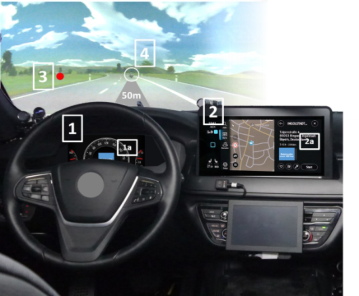
In-Vehicle Displays The driver’s workplace consists of a series vehicle dashboard (Figure 1). The 8-inch cluster display (1) showed a series vehicle instrument cluster, and the animations appeared at the core of the central speedometer (1a). The 13-inch CID (2) showed a contemporary infotainment display with a map, radio, and menu tiles, and the animations appeared in the right half of the screen (2a). At both locations, the animation field was rectangular, with edge lengths of 4.5 cm (horizontal) and 3 cm (vertical).
Figure 1: The driver’s workplace in the study with cluster display (1), cluster animation space in blue (1a), CID (2), CID animation space in blue (2a), red dot from the vDRT (3), and lead vehicle (4, in white circle).
The Impact of Secondary In-Vehicle Display Animations and Their Location 579
Participants This study comprised 53 participants (21 females and 32 males) aged between 20 and 80 years (m = 43.1; SD = 18.1). Table 1 presents the age and sex distributions of the sample. Besides a slight deviation in female participants, the ISO 16673 (ISO, 2017) sample requirements were met.
Table 1. Participants of the study by age group and gender.
Table available in the original PDF paper.
Age group (range in years) Gender 18–24 25–39 40–54 55+ Total
Male n = 8 n = 9 n = 6 n = 9 n = 32 Female n = 4 n = 5 n = 7 n = 5 n = 21 Total n = 12 n = 14 n = 13 n = 14 N = 53
ANIMATION MANIPULATIONS Sixteen animations were tested (Table 2). The animations differed systemat- ically in five dimensions: fade-in time and brightness, target color, internal movement, external movement, and location. The starting point of each ani- mation was the animation field in black, which hardly contrasts with the respective display surroundings. All animations were displayed for 2000 ms, including the fade-in times. For the sake of brevity and available space, only the the categories “internal movements” and “external movements” will be described in detail.
Table 2. Overview of the experiment’s animations.
Table available in the original PDF paper.
Internal Movement Four “internal” movement animations were realized in the experiment (see Figure 2). These animations were intended to resemble animations such as filling a battery, fuel level, or, more generally, an indicator needle. In “Fill Side” (#9), the blue rectangle gradually filled from the left side to the right with a fill-up time of 2000 ms. “Fill Up” (#10) only differed in the filling direction. In “Line Side” (#11), a vertical white line passed the screen from left to right. In “Line Up” (#12), a horizontal white line passed the screen from the bottom to the top. All passages took 2000 ms.
Figure 2: The four internal movement animations of the study.
External Movement Four external movement animations were used in the experiment. These ani- mations were intended to extend the movements of the previous set in various ways. In “Horizontal” (#13), a blue rectangle with half the original width of #1 moved from left to right, and in “Vertical” (#14), a blue rectangle with half the original height of #1 moved from bottom to the top. Both animations had a movement duration of 2000 ms. In “Rotation” (#15), the original blue rectangle made one counterclockwise rotation over a period of 2000 ms. In “Increase/Decrease,” the original rectangle retracted to half width and height and re-expanded over a total period of 2000 ms.
Figure 3: The four external movement animations of the study.
Location All animations were presented twice in the cluster display (1a in Figure 1) and twice in the CID (2a in Figure 1).
DRIVER TASKS Throughout the study, drivers performed three tasks: to follow the lead vehicle, react to dots that were presented in the driving scene, and react to information texts that could be presented in a cluster and/or CID, depending on the study part. None of the 16 animations displayed was relevant to the tasks.
Car Following Task The primary task in all parts of the study was to follow a lead motorcy- cle at a distance of approximately 50 m (the common delineator distance in Germany; see 4 in Figure 1). The lead vehicle speed varied continuously and unpredictably at intervals around the average value of approximately 80 km/h (SD ∼5 km/h). When combined with a Detection Response Task,
The Impact of Secondary In-Vehicle Display Animations and Their Location 581
this so-called car-following task allows for the judgment of the distrac- tion potential of a certain non-driving-related task or stimulus set under ecologically valid conditions.
vDRT While driving, participants in all parts of the study performed a vDRT adapted from ISO 17488:2016 (cf. Van Winsum, 2018). In the vDRT, red dots appear at five fixed locations on the road scenery (see 3 in Figure 1). While driving, the participants had to react to these stimuli by pressing a button on the left side of the steering wheel. Because this task measured the driver’s ability to react to unforeseen road circumstances in the study, partic- ipants were instructed that reacting to the dots was of elevated importance, just as the reaction towards any appearing red light would be under natural driving conditions. Notably, many adverse events in real-world driving are accompanied by red lights, for example, braking of front vehicles, warnings at train crossings, or general cross-traffic at traffic lights.
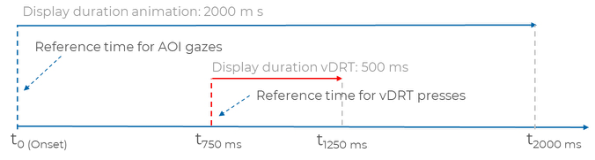
To test the distraction potential of animations, the vDRT was occasionally shown after the animation display started. In these cases, the dots were shown 750 ms after the beginning of the animation for a duration of 500 ms, ending 750 ms before the animation stopped (Figure 4). This timing was the most sensitive to vDRT misses in the pretests.
Figure 4: vDRT timing regarding the animations shown in the study. AOI: areas of interest.
Info Texts The third driver task was to press a button on the right side of the steering wheel whenever an information text appeared in one of the two animation areas (see 1a and 2a in Figure 1) and to read the text aloud. Participants were instructed that their reaction to the texts was of lower priority than the driving and vDRT tasks and that they should only perform it when they felt safe. Eight short information texts in German were displayed in white font on a blue background, identical in color, size, and location to the rect- angular animations described above. These task-relevant information texts served as a driver incentive to look at the Cluster or CID and to prevent drivers from ignoring the animations altogether. The content of the texts was primarily driving-related, non-urgent information (e.g., “No traffic dis- ruptions”) – no warnings or other content that would lead the driver to believe something unexpected would happen on the road section ahead. Fur- thermore, the introduction of texts made it possible to compare animation
locations where task-relevant information was expected with those where task-relevant information was not expected. Info texts appeared only in the Cluster Display in Test Drive 1, while in Test Drive 2, they were also shown in the CID – thereby elevating the relevance of the CID location.
TESTING PROCEDURE Familiarization Drive
After welcoming informed consent and pre-questioning, a familiarization drive took place. In this drive, the participants were first familiarized with eye-tracking glasses, and it was ensured that the glasses did not impair their sight on the road or in-vehicle displays. Subsequently, the car following task was introduced and practiced. Next, the vDRT task was explained to the par- ticipants, who were trained to press the button as the correct reaction to the dots. In the last step, the information texts were introduced, and again, the participants were trained on the correct response (i.e., button press and read- ing the texts aloud). When the participants reported having understood all tasks, they continued another five minutes practicing with the experimenter supervising their reactions.
First Contact Drive In the first contact drive, participants were instructed to perform the car- following, vDRT, and text information tasks, as instructed in the familiar- ization drive. They were told that the driving task had the highest priority, followed by the vDRT. To measure the distraction potential of unexpected animations, participants encountered the first (task-irrelevant) animation after a sequence of previously practiced tasks (car following, vDRT, and information texts). The event sequence during the first contact drive was as follows:
1. vDRT dot 2. Info text 3. vDRT dot 4. Animation in cluster (with vDRT dot) 5. Animation in CID (with vDRT dot) The order of events 4 and 5 was randomized. Animation #16 (increase/de- crease) was presented for both cases.
Test Drive 1 Test Drive 1 was performed immediately after the First Contact Drive. The participants were instructed to perform the car-following, vDRT, and infor- mation text tasks. They were also told that the driving task had the highest priority, followed by the vDRT. Throughout the drive, the participants encountered a randomized sequence of 96 events split as follows: each of the 16 animations was presented twice in the cluster and twice in the CID group. To measure driver distraction caused by animations in an unpredictable man- ner, only one of the two identical animations in the cluster and one of the two
The Impact of Secondary In-Vehicle Display Animations and Their Location 583
in the CID were coupled with vDRT dots (32 in total). In these cases, the dots were shown 750 ms after the beginning of the animation for a duration of 500 ms (Figure 4). To make the appearance of the dots even less predictable and create a baseline measure that was not influenced by animation, another 16 dots were displayed without animation. Additionally, the eight (task-relevant) information texts were presented twice in the cluster to prevent drivers from ignoring animations altogether, but not in the CID. Animation frequency var- ied between three and six animations per minute, resulting in a total duration of approximately 25 min for Test Drive 1. After the test drive, participants were instructed to leave the simulator and take a 10-minute break.
Test Drive 2 Test Drive 2 was similar to Test Drive 1, with the only difference being that each of the eight (task-relevant) information texts were displayed twice in the CID to increase the relevance (or value-expectancy-association) of that loca- tion, adding another 16 events for a total of 112 events that were presented in a randomized order. For the sake of brevity and available space, results of Test Drive 2 will only be briefly discussed.
DATA RECORDING All simulation data, such as vehicle dynamics (e.g., vehicle distances, speeds, accelerations), driver input data (e.g., button presses, vehicle operation), and parameters of additional tasks controlled by the simulation (i.e., vDRT: task parameters, event triggers) were recorded with the SILAB® driving simu- lation (version 7.0, WIVW GmbH) at a frequency of 100 Hz. In addition, eye tracking data from the DIKABLIS eye tracker were recorded using the recording and processing software D-LAB (version 3.54; Ergoneers GmbH) at 100 Hz. The subjective data were recorded on pen and paper and directly digitized after each experimental run by the experimenter using Microsoft Excel 2013.
RESULTS-SUBJECTIVE MEASURES First Contact Drive Distraction Ratings
Driver distraction ratings after first contact with animation #16 in Cluster and CID were generally low but slightly higher for Cluster (m = 6.4) than for CID (m = 5.1).
Recalled Animations From Test xrives In free recall after the test drives, instant appearance (#1), color change (#5–7), line movements (#11, #12), rotation (#15), and increase/decrease (#16) were recalled most frequently by the participants. Less distinctive ani- mations, such as variations in appearance, speed (#2, #3), brightness (#4), or movements of the rectangle (#13, #14), were rarely mentioned and did not seem to have left any impression on the participants’ memories.
Distraction Ratings From Test Drives After the test drives, most participants (74 %) chose the CID as the more dis- tracting animation location. Interestingly, greater distance (CID) and smaller distance (cluster) were reported most frequently as reasons for increased distraction ratings. Presumably, some participants based their choices on increased attentional demand (CID) and others on increased attentional capture (cluster).
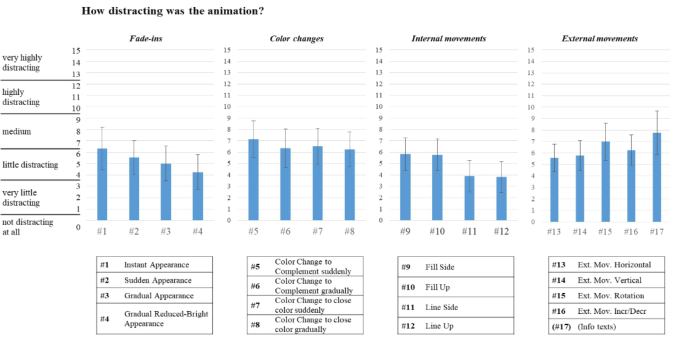
Distraction ratings are shown in Figure 5. Among the four animation types, instant appearance (#1), sudden color changes (#5), and rotation (#15) were rated as rather distracting, and so were the information texts (#17). Gradual appearances (especially when only reduced-bright) and line move- ments were rated as the least distracting. However, these retrospective ratings must be interpreted with caution, as many participants reported that dur- ing the test drives, they quickly scrutinized animations for info text-related features and disregarded all other animations (e.g., those involving color or movement).
Figure 5: Mean distraction ratings by animation and animation location.
Driving Activity Load Index (DALI) Regarding the five DALI rating dimensions, participants reported relatively high attentional (m = 4.1) and visual (m = 4.1) demands throughout the study. The perceived motor demands (m = 2.4), stress (m = 2.4), and time pressure (m = 1.9) were in the medium range, indicating that the participants perceived the task as not very stressful or pressing.
RESULTS- OBJECTIVE MEASURES Visual Distraction and vDRT Performance
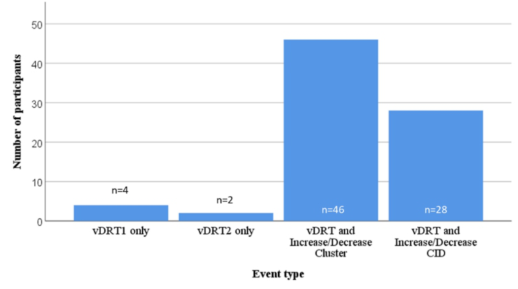
First Contact Drive Misses of the vDRT dots in the First Contact Drive are shown in Figure 6. The presentation of the increase/decrease animation caused many participants to miss the vDRT dots presented in the road scenery. This effect was strongest
The Impact of Secondary In-Vehicle Display Animations and Their Location 585
when the animation was presented in the cluster where almost all partic- ipants missed the vDRT dot. Without animations, the vDRT performance was excellent.
Figure 6: Number of participants that missed the vDRT dots during first contact drive as a function of the event type.
For a statistical assessment of the effects of the increase/decrease in ani- mation on vDRT misses in the First Contact scenario, a generalized linear mixed model was calculated using the binary vDRT misses variable as the target (binomial probability distribution, logit linkage function) and event type (vDRT only, vDRT with animation in cluster, vDRT with animation in CID) as model factor (AIC = 1125.94, BIC = 1139.12). Highly significant effects were observed for all model components (Table 3). Simple contrasts showed significant differences between animation conditions and the vDRT (p < 0.001).
Table 3. Model coefficients and significance levels for the generalized linear mixed model on vDRT misses.
Table available in the original PDF paper.
Fixed coefficientsa Model component Coeff. SE t p Constant −2.930 0.445 −6.586 .000 Increase/Decrease CID 3.040 0.524 5.796 .000 Increase/Decrease Cluster 4.814 0.605 7.957 .000 vDRT 0b
Probability distribution: Binomial Linkage function: Logit a. Target: vDRT misses b. This coefficient was set to zero, as it is redundant.
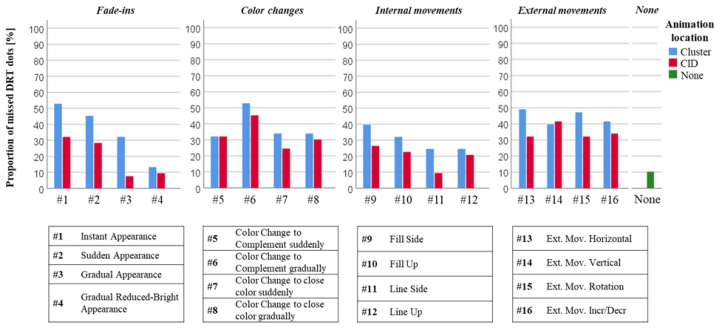
Test Drive 1 Misses of vDRT dots in Test Drive 1 are displayed in Figure 7. From visual inspection, vDRT misses in Test Drive 1 are mostly higher under conditions
with animations than without (vDRT only, location “None”). However, ani- mations #3, #4, and #11 in the CID and animation #4 in the cluster appear to produce equally low missing rates as no animations. In general, vDRT misses during cluster animations seem equal to or higher than those during CID animations, presumably because participants awaited information text at that location only.
Close inspection of the data tables (Table 4) further underlines this obser- vation. Whereas the vDRT-only tasks led to a missing rate of 10 %, anima- tions #3, #4, and #11 in the CID resulted in misses of 8%, 9%, and 9%, respectively.
Figure 7: Proportion of missed vDRT dots in test drive 1 as a function of animation and animation location.
Animation #4 in the cluster also produces equally low percentages as no animations at all (9%). In general, vDRT misses during cluster animations seem equal to or higher than during CID animations, presumably because participants only awaited information text at that location.
Table 4. Tabular display of the observed vDRT misses in test drive 1. Here, information texts were shown at the cluster only.
Table available in the original PDF paper.
Performance Event type Animation Nr. Dot only 1 2 3 4 5 6 7 8 9 10 11 12 13 14 15 16
For a statistical assessment of the effects of animations on vDRT misses in the first main-drive scenario, a generalized linear mixed model was calculated with the binary vDRT misses variable as the target (binomial probability dis- tribution, logit linkage function) and animation and animation location as model factors (AIC = 189.67, BIC = 294.54). Highly significant effects were
The Impact of Secondary In-Vehicle Display Animations and Their Location 587
obtained for all fixed effects in the model, that is, animation and location (Table 5).
Generally, animations increase the number of misses and are displayed in cluster. (Note that in Test Drive 1, no information text was shown in the CID).
Planned contrasts/pairwise comparisons of the whole data against the vDRT showed significant differences regarding the vDRT misses for almost all animations, except for animation #4 (padj. = 0.333); the gradual reduced- bright fade-in of the blue rectangle does not lead to a significantly different misses-percentage across presentations in the cluster display and the CID when compared to the vDRT.
Table 5. Model fixed effects with significance levels for the generalized linear mixed model on vDRT misses.
Table available in the original PDF paper.
Fixed effectsa Source F df df 2 p Corrected Model 15.817 17 15 .000 Animation (1-16, vDRT) 5.670 15 15 .001 Location of animation 25.596 1 15 .000
Probability distribution: Binomial; Linkage function: Logit a. Target: vDRT misses
Test Drive 2 For the sake of brevity and available space, results from Test Drive 2 cannot be reported here. However, analyses showed that the effect of location dis- appeared when elevating the importance of the CID by introducing driving relevant info tests there (p = 0.061 as obtained by a similar model as shown in Table 5) – animations in the CID where now shown to be more distracting in the vDRT task than before.
DISCUSSION
The study aimed to explore the type and amount of non-driving-related ani- mations that can be implemented in car front displays without having a significantly negative impact on driver attention. The participants’ vDRT per- formance primarily operationalized driver attention, and a general effect of animations on driver attention was observed across all parts of the study. In general, displaying animations in a cluster display or CID decreases the detection performance of the vDRT dots. However, this effect could not be observed for all animations under all conditions. For example, slower fade-in animations and sometimes other factors, such as reduced brightness, target color, and object size, left performance unimpaired. All these observations support the research hypotheses H1 and H2, which state that animations of increased salience (compared to animations with lower salience) may negatively impact visual attention.
LOCATION, EFFORT, AND VALUE In several study parts, a location effect could be observed. For example, con- cerning vDRT performance, animations displayed in the cluster display led to reduced attentional performance compared to animations displayed in the more distant CID, at least in Test Drive 1, where no information texts were displayed in the CID. Therefore, H3 is supported under this condition.
This effect disappeared when the informational texts were introduced into the CID on Test Drive 2. This finding supports H4, which states that indi- rect value-expectancy associations linked to a specific location moderate the distraction potential of an unrelated stimulus shown at certain locations, as users are more likely to direct their attention there.
Practical Implications Animations should be designed to reduce salience and avoid visual distrac- tions. The current study provides the first insight into how this can be achieved; slow fade-ins, reduced brightness, and smaller object surfaces may lead to the desired effect. In addition, displaying animations at more distant locations, such as the CID, or even farther away from the cluster display, might help the driver keep his visual attention unimpaired by animations. A clear differentiation of locations where potentially important messages would appear to the driver, as opposed to locations that serve entertainment func- tionalities, may further decrease the distraction potential for drivers. This study did not directly investigate the design differentiation between relevant messages and unrelated design elements. In the current study, information texts shared some design components with animations (i.e., a blue rectangle), and clear-cut differentiation was likely to lead to reduced distraction.
Future Research and Limitations Although the study’s simulation environment, vehicle interior, and display design were state-of-the-art, the transferability of the gathered insights to real-life traffic environments is limited. For example, the study’s results were limited to the implemented display size, color, and brightness, given the evidence that color and brightness are important attentional factors.
Furthermore, to cover a large set of animation features while maintain- ing sufficient statistical power for the hypotheses, many animations were displayed to the study participants within a short time while driving. This is unlikely to occur in real-world driving scenarios and may raise concerns regarding time effects. However, the introduction of task-relevant informa- tion texts prevented participants from habituating to animations or ignoring them altogether, and analyses of the dependent variables over time did not confirm any temporal trends.
As previously mentioned, the information texts share some design com- ponents with animations (i.e., blue rectangle). In future studies, the design differentiation of relevant messages and unrelated design elements will be particularly promising when introducing animations that should not distract drivers.
The Impact of Secondary In-Vehicle Display Animations and Their Location 589
Taken together, the present study provides empirically founded recom- mendations for the design of non-driving-relevant display animations. By considering this paper’s findings throughout the whole design process of in- car animations, the likelihood of developing safe and user-friendly systems should increase.
DECLARATION OF COMPETING INTEREST The authors declare that they have no competing financial interests or per- sonal relationships that may have influenced the work reported in this study.
ACKNOWLEDGMENT
We would like to thank all co-workers from WIVW GmbH who provided technical support during our research.
FUNDING This study was funded by CARIAD SE. Customers did not influence the results of this investigation.
REFERENCES
Bartram, L., Ware, C., & Calvert, T. (2001, July 9–13). Moving Icons: Detection and Distraction. Paper presented at the International Conference on Human- Computer Interaction (INTERACT), Tokyo, Japan. Brome, R., Awad, M., & Moacdieh, N. M. (2021). Roadside digital billboard
advertisements: Effects of static, transitioning, and animated designs on drivers’ performance and attention. Transportation research part F: Traffic psychology and behaviour, 83, 226–237. Carney, C., Campbell, J. L., & Mitchell, E. A. (1998). In-vehicle display icons and other information elements: Literature review. (FHWA-RD-98-164). Chen, H.-Y. W., Hoekstra-Atwood, L., & Donmez, B. (2018). Voluntary-and
involuntary-distraction engagement: An exploratory study of individual differ- ences. Human factors, 60(4), 575–588. Eisma, Y. (2021). Visual Attention in Human- Machine Interaction. Delft University of Technology. ISO. (2017). Ergonomic aspects of transport information and control systems —
Occlusion method to assess visual demand due to the use of in-vehicle systems (Vol. 16673:2017): International Organization for Standardization. Kim, G. Y., Kim, S. R., Kim, M. J., Shim, J. M., & Ji, Y. G. (2023). Effects of Animated Screen Transition in In-Vehicle Infotainment Systems: Perceived Duration, Delay Time, and Satisfaction. International Journal of Human–Computer Interaction, 39(1), 203–216. Krüger, H.-P., Grein, M., Kaussner, A., & Mark, C. (2005). SILAB-A task-oriented
driving simulation. Paper presented at the Driving Simulation Conference North America 2005 (DSC-NA 2005), University of Central Florida, Orlando. McKee, S. P., & Nakayama, K. (1984). The detection of motion in the peripheral visual field. Vision research, 24(1), 25–32.
Nouzovský, L., Vrtal, P., Kohout, T., & Svatý, Z. (2022). Using the Eye Tracking Method to Determine the Risk of Advertising Devices on Drivers’ Cognitive Perception. Applied Sciences, 12(13), 6795. Plaue, C., & Stasko, J. (2007). Animation in a peripheral display: distraction, appeal,
and information conveyance in varying display configurations. Paper presented at the Proceedings of graphics interface 2007. Stanton, N. A., & Edworthy, J. (2019). Auditory warnings and displays: An overview.
Human factors in auditory warnings, 3–30. Stevens, A., Quimby, A., Board, A., Kersloot, T., & Burns, P. (2002). Design guidelines for safety of in-vehicle information systems. TRL Limited. Van Winsum, W. (2018). The effects of cognitive and visual workload on peripheral
detection in the detection response task. Human factors, 60(6), 855–869. Visual-manual NHTSA driver distraction guidelines for in-vehicle electronic devices NHTSA-2010-0053 C. F. R. (2013). Yoo, C. Y., Kim, K., & Stout, P. A. (2004). Assessing the effects of animation in online
banner advertising: Hierarchy of effects model. Journal of interactive advertising, 4(2), 49–60.
LISTED IN THE AHFE DIGITAL BOOKSTORE CATALOGUE
Explore the complete digital volume
Advances in Human Factors of Transportation
Read this individual research paper free through the original publisher, or explore the full digital proceedings book.
ISBN 978-1-964867-24-3
Explore this ISBN in the AHFE Bookstore ↗Listed in the July 2026 bookstore catalogue; search by ISBN to confirm current availability · Digital book purchase optional