Hamish Mackie, Colin Brodie, Ken Holst, Fergus Tate, Richard Scott (2021). Development and Evaluation of a Rural Intersection Active Warning System. In: Advances in Human Aspects of Transportation: Part I. AHFE Open Access, vol. 15. https://doi.org/10.54941/ahfe100630
This study describes the development of a Rural Intersection Active Warning System (RIAWS) and the outcomes from the first two RIAWS pilot sites in New Zealand. The RIAWS trial is part of a wider programme by the NZ government to address safety at high risk intersections. The evaluation measures reported here include system performance, motorist speed and driver perception. The RIAWS has the aim of reducing fatal and serious crashes at high risk intersections by reducing traffic speed when potential for a collision exists. Side road and right turn sensors trigger a variable speed limit of 70 km/h on major roads with existing 100 km/h speed limits. Motorist behaviour and perceptions since RIAWS implementation have been positive. Modal traffic speeds at the intersections when the 70 km/h speed limit sign is activated range from 68-72 km/h compared with modal speeds of 81-96 km/h before RIAWS installation, when potentially conflicting traffic is present. Driver feedback via a questionnaire suggests that most motorists understand the purpose of the system and believe the signs are conspicuous, legible and credible. The findings suggest that RIAWS is likely to significantly reduce the crash forces involved in collisions at high speed intersections and potentially reduce the likelihood of collisions.
New Zealand’s Safer Journeys Road Safety Strategy includes a strategic priority of improving the safety of high risk intersections. Intersection crashes accounted for 38% of all injury crashes on New Zealand roads between 2006 and 2010. The development, trial and implementation of a Rural Intersection Active Warning System (RIAWS) is part of this wider programme to address safety at high risk intersections.
As part of the action plan to address high risk intersections in New Zealand, a scoping study was carried out (Mackie 2010) to understand various intersection ITS based safety systems that have been developed overseas and the potential for the trial of such a system in New Zealand. The most compelling of the overseas examples was a system that has been trialled by the Swedish Road Administration (SRA) between 2003 and 2007 where variable speed limit (VSL) field trials were implemented at 19 locations in different parts of the country. Many of the installations were at intersections where the variable speed limit was triggered by the presence of a side road vehicle that may have the potential for a collision. At locations where a permanent 90 km/h speed limit existed, a variable 70 km/h speed limit was installed. At these sites, vehicle speeds reduced by 14 km/h on average, accepted gap time increased by 1-2 seconds and the system was perceived very positively by the motoring public (Lind 2009).
It was determined that an intersection variable speed limit system triggered by potentially conflicting vehicles could be implemented in New Zealand. However, since no technical specifications for the system were available, it was designed from first principles.
DEVELOPMENT OF THE RURAL INTERSECTION ACTIVE WARNING SYSTEM A structured process was used to develop the RIAWS. The sign design utilized a Delphi method, which involved an iterative improvement process via an expert group. This included key stakeholders and representatives from NZ Transport Agency (National office as well as regional representation), NZ Police and Automobile Association. A further step to determine the RIAWS sign design included focus groups administered in five regional centres around New Zealand. In total, 60 road safety experts participated in the process.
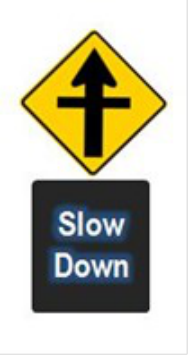
Following this process, the sign formats for RIAWS were agreed (Figure 1). A “Slow Down” sign option was included in the trial as some believed this format would be more appropriate than a variable speed limit.
Figure 1. Signs developed for use as part of the RIAWS trial
A further small study was carried out to assist with the decision making process for setting the variable speed limit for the system (Mackie 2011). The purpose of this study was to examine the role of speed in rural crashes in general and then specifically examine the likely effects of various speeds on rural intersection crashes.
Key to this analysis was the considerable evidence that vehicle speed magnitude is highly related to crash risk and severity (Nilsson 2004, OECD 2006, Fildes and Lee 1993, Wramborg 2005, Richards and Cuerden 2009), but the distribution of speed has also been shown to affect crash risk (Aarts and Van Schagen 2006, Archer et al. 2008 and Garber and Gadiraju 1989).
From the analysis it was determined that a variable speed limit of 60 km/h would be a ‘Safe System’ solution for the RIAWS. However, further discussion among the project team and wider reference group resolved that a 70 km/h variable speed limit may have overall better compliance by motorists. Based on this, a 70 km/h variable speed limit was chosen for RIAWS by the project reference group and project team.
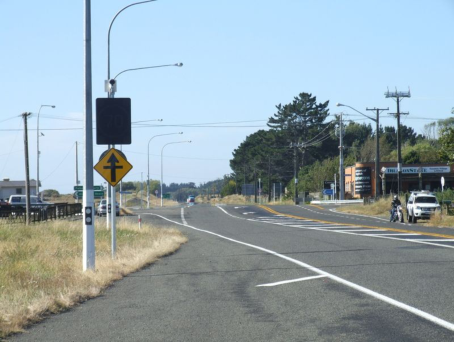
The RIAWS is designed to slow major road through traffic on approaches to an intersection when a potential collision risk exists. Variable speed limit signs on the major road intersection approaches are triggered by the presence of side road and turning traffic (Figure 2):
Figure 2. The RIAWS in operation at Himitangi with no conflict risk (left) and a potential conflict risk (right) with a side road vehicle present (circled).
A number of human factors questions arose from the RIAWS development process as follows:
- What conspicuity, comprehension and compliance would be associated with the RIAWS in a rural intersection setting?
- How might drivers respond to sudden activation or de-activation of the sign
- To what extent might risk homeostasis apply? Will crossing drivers compensate for the lower speed environment by taking more risks in gap selection?
- Will the system have novelty effects or will the affects be lasting?
SYSTEM EVALUATION METHOD
Because it will take some time to determine the safety improvement benefits of RIAWS, surrogate safety measures have been developed to evaluate short to medium-term effectiveness. Therefore, the more immediate objectives of the RIAWS trial are to evaluate the feasibility and indicative safety benefits of RIAWS. This study evaluated the following outcomes:
1. RIAWS development and operational performance
2. Major road traffic speed through the intersection
3. Public perception and understanding of the system
Further work is underway to understand the motorist gap selection patterns following RIAWS installation.
To understand the operational performance of RIAWS, the project team attended a ‘launch’ of each system and observed it operating. Further, a regional engineer carried out a structured audit of various characteristics of the system shortly afterwards. The data collection system also provided data from which an analysis of sign activation time could be carried out.
Traffic speed was measured for each direction on the major road, both at the sign (using radar) and at the intersection (using inductive loops). A target of 14 days of data collection prior to, and following RIAWS commissioning, was set. In reality, eight days of data were collected before and after RIAWS commissioning at the pilot sites.
A public perceptions survey was carried out for Himitangi only, by capturing number plate information for vehicles passing through the intersection using automatic number plate recognition (ANPR) and then accessing vehicle owner address details through the motor vehicle registry (following NZ Transport Agency approval). A paper survey was then mailed to vehicle owners, with an option of completing the survey online. The survey asked motorists a range of questions related to the meaning, conspicuity and legibility of the signs and any perceived hazards and suggested changes associated with the system.
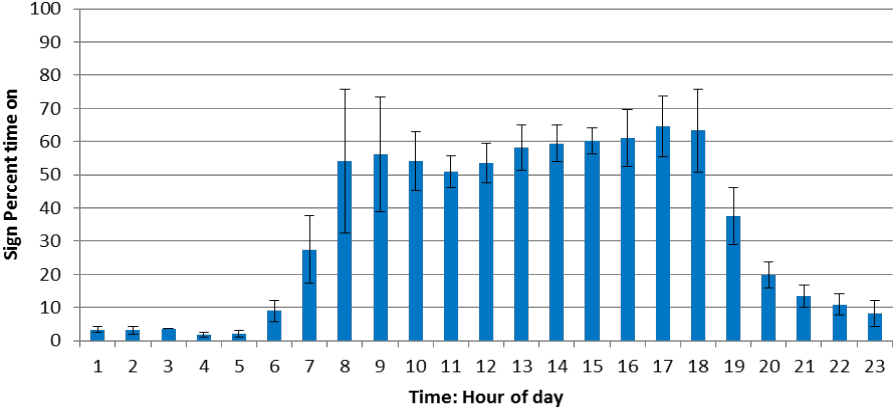
The proportion of time the variable speed limit signs spent on and off was measured and analysed, to check power demand and ensure that the system was not being overused or underused. Underuse might make the sign ‘surprising’ whereas overuse could lead to de-sensitization. An example of the sign activation patterns for one of the sites is shown in Figure 3. At times the sign was active for over 50% of the time for large parts of daylight hours, transitioning to minimal activation at night. The project team has concluded that this activation pattern is acceptable as it reflects the periods of demand and does not unduly slow through vehicles when there is no collision risk.
Figure 3. Average and standard deviation (error bars) percent time on for each hour of the day (for seven days) for the northbound direction at one of the pilot sites
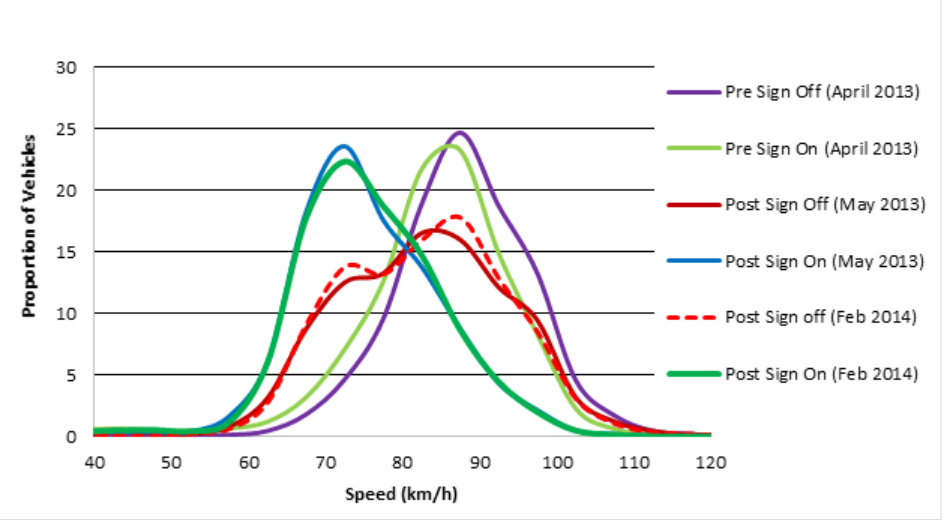
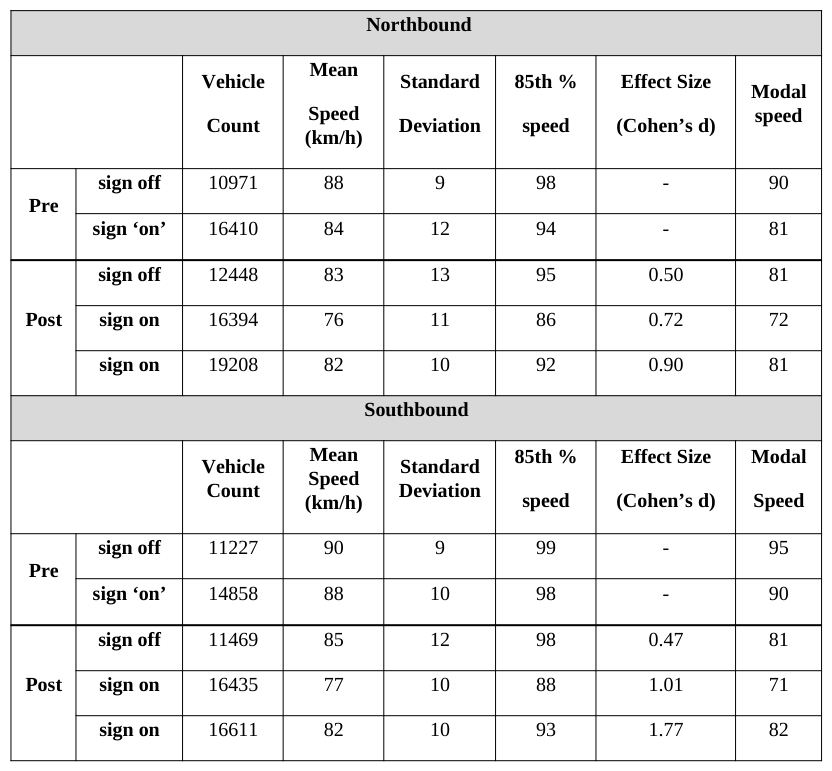
Major road traffic speed through the intersection The RIAWS has been effective in reducing traffic speed through the intersections. When the signs are activated by potentially conflicting traffic, modal speeds are now typically very close to the speed limit of 70 km/h and this effect has been maintained 9-months following system commissioning (Figure 4). Statistically it is clear that the RIAWS system has positively reduced traffic speed at the intersections. For example, a t-test comparing the mean speed at the Yaldhurst intersection before and after RIAWS installation (with the sign activated in the post condition) returns the following results:
Degrees of freedom = 16393, t statistic = 64.9, p = < 0.001 (very close to zero) Further, effects sizes (Cohen’s d statistic) for the intersection comparisons with the sign on were typically between 0.72 and 1.0 (Error: Reference source not found), reinforcing a strong real effect in reduced mean speed.
Figure 4. Speed profiles for Yaldhurst RIAWS site
However, statistical significance is less relevant here because it is very obvious that the system has positively affected mean speed. More importantly is whether RIAWS has had sufficient effect to improve road safety at high risk intersections. Prior to RIAWS, modal intersection speeds ranged between 81-96 km/h across the Himitangi and Yaldhurst sites. Following RIAWS, when the sign was active, modal intersection speeds ranged between 68-72 km/h.
It is also important to note that there is not a perfectly clear distinction between those motorists exposed to the 70 km/h speed limit, compared with those who were not. A proportion of motorists who passed the sign (approx. 150m from the intersection) will have assumed the speed limit is either 100 km/h if the sign was ‘off’, or 70 km/h if the sign was activated, but then before they reached the intersection speed loops the signs will have been either activated or turned off. For example, a motorist could pass the sign without it being activated and so the motorist will consider the speed limit to be 100 km/h. Meanwhile a side road or turning vehicle triggers the system and signs are activated. By the time the major road vehicle triggers the speed loops at the intersection, the data will be recorded as ‘sign on’ data, yet the motorist will have assumed the speed limit is still 100 km/h. So in reality, the ‘sign off’ traffic speed data is likely to be slightly lower than the actual speed of those motorists who were exposed to the sign being inactive. Likewise, the ‘sign on’ data is likely to be slightly higher than the actual speed of those motorists who were exposed to the sign being active. For this reason, it is recommended that the modal speeds provide the best indication of the change in motorist speed behaviour before and after the installation of the RIAWS system.
In Table 1, ‘sign off’ and ‘sign on’ sub-conditions exist for the pre-RIAWS condition. Before the electronic signs were made operational, it was possible to categorise the pre-RIAWS speed data in the same way as the post-RIAWS speed data, using the sign triggers to determine whether the sign would be on or not, without them actually being illuminated. This allows motorist speed behaviour, when potential conflict situations exist, to be differentiated from motorist speed when there are no potentially conflicting vehicles and allows a direct comparison with the RIAWS ‘sign on’ and ‘sign off’ data.
The data shows that even without the RIAWS, traffic speed through the intersections were slightly slower when potentially conflicting vehicles were present. However, the RIAWS has caused traffic speed to reduce even further, with modal speeds during RIAWS sign activation being 68-72 km/h across each direction and both sites.
Table 1. Speed data for Yaldhurst pre and post RIAWS installation.
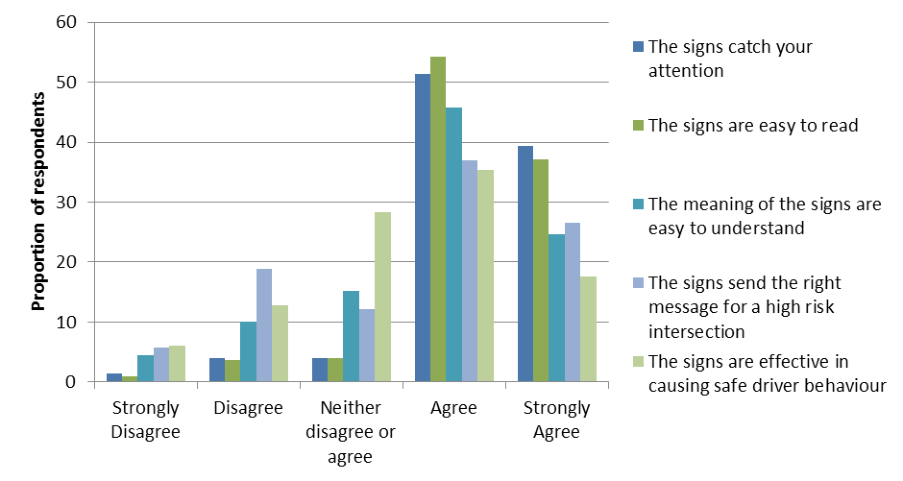
Public perception and understanding of the system In total 307 survey responses were collected (297 posted paper surveys and 10 online) representing a 31% response rate. Overall, based on the driver feedback, the RIAWS has been positively received. A minority of negative comments elude to various deficiencies however it is important to distinguish between drivers’ opinions of the system as opposed to their actual behaviour, which generally appears to be positive to date. Nevertheless, some of the feedback can be used to further improve the RIAWS at future sites. The majority of respondents correctly understood the key message from the RIAWS at Himitangi, although a minority did not understand the regulatory nature of the signs or why they were being instructed to slow down by the signs. More conspicuous signage indicating the up-coming intersection and the potential for conflict, could be considered.
Figure 5. Survey response to question: “For the signs shown in the picture, and from the perspective of a motorist driving through this intersection, please circle the number that most closely matches your level of agreement with each statement”
DISCUSSION
From the data it is clear that generally, motorists slow down slightly at rural intersections when the potential for a collision exists, although this was clearer at Yaldhurst than at Himitangi. However, it appears that most motorists do not adjust their speed sufficiently to mitigate the effects of a potential collision situation, possibly trading off safety with convenience, or perhaps being unaware of the consequences of an intersection collision at 80-100 km/h. The relatively high level of compliance with RIAWS suggests that the system is highly credible to most motorists and the variable speed limit of 70 km/h simply represents an extension of reasonable precautionary behaviour at rural intersections. It could be said that RIAWS helps motorists by extending their existing precautionary behaviour, in line with current evidence of the survivability of crash situations at various speeds.
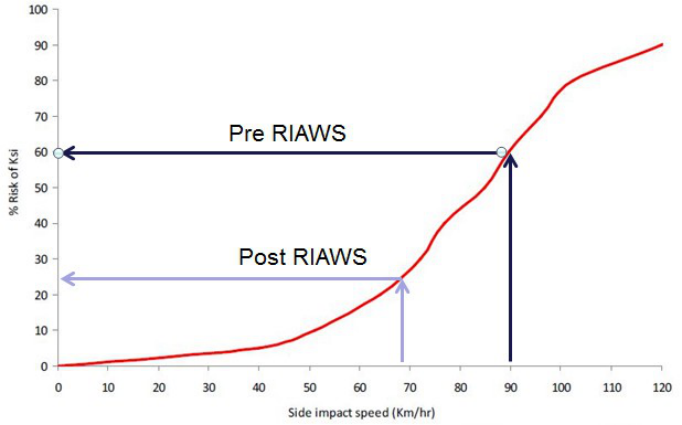
Applying the analysis that was carried out earlier (Mackie, 2011), it could be interpreted that the RIAWS is likely to significantly reduce the crash forces involved in collisions at the intersection and potentially reduce the likelihood of collisions. Applying the RIAWS speed outcomes to the risk of KSI curve for side impacts (adapted from Richards and Cuerden 2009), it is clear that in theory the RIAWS system should have substantial effects on intersection safety (Figure 6). But only the crash behaviour of the intersections over time (minimum five years) will determine if this eventuates in reality.
Figure 6. Estimated improvements to risk of death or serious injury following RIAWS installation
Following the application of the selection criteria outlined earlier, four more RIAWS sites have been chosen, are currently in operation and are being evaluated. Further analyses of motorist gap selection at Himitangi (using video collected at the intersection) and evaluation of the further four trial sites will also help to confirm the merits of RIAWS (or otherwise). There are a number of considerations for the wider use of RIAWS in New Zealand including cost, the nature of the problems present at specific intersections and the potential programming of ‘Safe System’ physical infrastructure such as a rural roundabout.
There may be a case for using RIAWS when a high risk intersection warrants transformational remediation such as a rural roundabout, but funding does not allow this to happen for a number of years. In such situations RIAWS may provide a useful and relatively cost effective interim countermeasure until transformational works are implemented. At other intersections, the prioritisation process might identify that an intersection ranks relatively high in terms of road safety risk but it doesn’t quite meet the threshold for significant infrastructure works. In such a situation, RIAWS might also provide a useful road safety solution.
The human factors questions that were posed at the beginning of the project have mostly been positively answered and there do not appear to be any significant risks associated with the system. A minority of people did find the meaning of the system confusing so it will be important to monitor the sites for any behavioural signs of driver confusion. Also, the side road gap study will help to determine whether RIAWS improves or worsens motorist gap judgement.
CONCLUSION
A RIAWS has been developed and evaluated in New Zealand. The findings to date suggest that the system performs well and has the potential to significantly reduce fatal and serious casualties at rural high risk intersections by extending drivers’ natural intersection risk management strategies. Longer-term evaluation of crash data from the pilot sites and further trial sites will help to confirm the efficacy of RIAWS in New Zealand.
REFERENCES
Aarts, L., Van Schagen, I. (2006). Driving speed and the risk of road crashes; a review. Accident Analysis and Prevention, 38(2), p215–224. Archer, J., Fotheringham, N., Symmons, M., Corben, B. (2008). The Impact of lowered speed limits in
urban/metropolitan areas. Monash University Accident Research Centre Rpt No. 276, Australia. Charlton, S. (2003). Restricting intersection visibility to reduce approach speeds. Accident Analysis and Prevention, 35(5), p817-23. Charlton, S., Baas, P. (2006). Assessment of hazard warning signs used on New Zealand roads. Wellington: Land
Transport NZ Research Report 288. Fildes, B.N., Lee, S.J. (1993). The speed review: Road environment, behaviour, speed limits, enforcement and crashes. Report CR127. Federal Office of Road Safety. Canberra, Australia. Garber, N.J., Gadiraju, R., (1989). Factors affecting speed variance and its influence on accidents. 1989-01-01 1213.
Transportation Research Record, Washington D.C., USA Lind, G. (2009). Estimation of safety benefits of VSL at intersections and on weather-controlled links. 27th International Baltic Road Conference, p10, Riga, Latvia. Mackie, H.W. (2010). Rural Intersection Warning Systems: Review of information and recommendations Stage 1
Report. A report prepared for NZ Transport Agency by TERNZ Ltd.
Mackie, H.W. (2011). The effects of speed on rural intersection crashes. A report prepared for the NZ Transport Agency by TERNZ Ltd.
Nilsson, G. (2004). Traffic safety dimensions and the Power Model to describe the effect of speed on safety.
Bulletin 221. Lund Institute of Technology, Lund, Sweden. OECD/ECMT, (2006). Speed management. Paris. OECD Publishing.
Richards, D. And Cuerden, R. (2009). The Relationship Between Speed And Car Driver Injury Severity, Department for Transport, UK. Tate, F. (2003). Jaws: The Safety Impacts, Phd Thesis, Leeds: University Of Leeds Institute For Transport Studies. Wramborg, p. (2005). A New Approach to a Safe and Sustainable Road Structure and Street Design for Urban
Areas. Paper presented at Road Safety on Four Continents Conference, Warsaw Poland. Yamanaka, H. And Mitani, T. (2005). Vehicle behavioural safety assessment for unsignalised small intersections to evaluate collision avoidance system. Journal of the Eastern Asia Society for Transportation Studies, 6, p2667– 2675.
Acknowledgement
This work was funded by the NZ Transport Agency.
LISTED IN THE AHFE DIGITAL BOOKSTORE CATALOGUE
Explore the complete digital volume
Advances in Human Aspects of Transportation: Part I
Read this individual research paper free through the original publisher, or explore the full digital proceedings book.
ISBN 978-1-4951-2097-8
Explore this ISBN in the AHFE Bookstore ↗Listed in the July 2026 bookstore catalogue; search by ISBN to confirm current availability · Digital book purchase optional