Elisabeth Brandenburg, Stefanie Zander, Asmus Figge, Grischa Beier (2018). Recommendations for Tracelink Decisions – An Empirical Investigation of Visualizations. In: Advances in Human Factors, Software, and Systems Engineering. AHFE Open Access, vol. 4. https://doi.org/10.54941/ahfe100121
Today, engineering processes integrate many subsystems from different domains like Mechanics, Electrics or Software. Therefore the systems that are engineered become more and more complex. As system complexity increases, the number of dependencies between subsystems increases as well. Hence, engineers are obliged to keep track on these dependencies via tracelinks. The present paper investigates four types of decision support (percentages, brief information, a traffic light metaphor and a half-star rating) that help engineers to decide if a tracelink should be set or not. Moreover multiple objective and subjective dependent measures were assessed. Despite the pre-study character of the present work results indicate that the half-star rating system was best in terms of objective performance, at least for experts. Implications of these findings are discussed.
The goal of Systems Engineering is the development of successful products or services (Sage, 1992). Modern complex systems do not only consist of many mechanical, electrical/electronical and software subsystems (VDI 2206), they also comprise the interaction of subsystems. This multidisciplinary approach to system design enables innovative functions, requiring a multitude of data types, describing languages, data formats that different engineers have to deal with in order to design their subsystem. One of the engineers biggest challenge is to oversee the dependencies between these interrelated subsystems, which is crucial e.g. if changes occur. One approach to this problem is to establish traceability between the digital information artifacts from different domains and processes during the system development. Traceability is realized by explicitly documenting the dependencies between the elements of the various artifacts (such as requirements specification or bill of material) with tracelinks. Today, for engineering technical systems, traceability is mandated by many standards (e.g. ISO 26262) and by developers needs. However it has to be established manually. This is a time consuming activity requires a comprehensive knowledge of the product, as dependencies between systems are not always obvious. Current methods and tools usually provide the means to manage tracelinks, but they do not support the engineer of the decision if a tracelink should be set. These decisions are affected by many parameters, for example the engineers’ expertise, his involvement or time pressure. Additionally, the decision to set a tracelink is influenced by the quality of the information provided. For example, the tracelink modeling method EcoTracing (Stark and Figge, 2011) shows two hierarchical artifacts (e.g. requirements and a system structure) to the engineer and highlights elements of interest.
In this paper we present a novel approach, which supports engineers in deciding whether a tracelink should be set.
Therewith the process of decision-making should be facilitated. We investigate different visualization techniques that aim at enhancing the method EcoTracing by visualizing additional information. This additional information provides the probability of the existence of a dependency and thus a recommendation (or not) to model a tracelink. Common information retrieval techniques that determine such probabilities are the Vector Space Model (Antoniol, Canfora, Casazza and De Lucia, 2000), Latent Semantic Indexing or Tf-Idf Retrieval (Hayes, Dekhtyar, Sundaram, 2006).
THEORY A common way of supporting tracelink decisions is to supply information about the decision problem, for instance by visualizing probabilities or giving relevant details about the artifacts’ dependencies. These information function as essential cues for coming to a decision according to the Information processing model of decision making (Wickens, Hollands, Banburry & Parasuraman, 2012). Thus the decision maker seeks for cues available in his surroundings that are connected to the current problem. With the help of selective attention subjectively important cues are filtered out and integrated in the decision process. Additionally, experiences (long-term memory), expertise, time pressure, cognitive abilities, need for cognition and involved risk are considerable examples for parameters affecting how cues and information are evaluated and consequently how a decision is finally made.
Need for cognition (NFC) is a personality trait reflecting an individual’s tendency to perform and enjoy effortful cognitive activities (Cacioppo, Petty & Richard, 1982). Related to decision making and supported by displayed verbal and visual information, NFC plays a moderating role affecting the relationship between the type of presented information and test persons’ performance. Individuals with a high NFC prefer and perform better with verbal information. Conversely, low NFC is connected to a preference and better outcome when information are presented in a non-verbal, visual way (Sojka & Giese, 2000). Additionally to NFC expertise is a considerable variable related to the process of decision-making and its support by presenting additional information. As claimed by the elaboration likelihood model (ELM; Petty & Cacioppo, 1986) experts are dealing generally more accurate and critical with presented information whereas novices rely on it heavily. Consequently novices are less sensitive to manipulated information leading to a higher error probability. Especially in designing and developing decision support systems the inclusion of experts and novices is a vital component. For example, a common field for the application of decision support systems is the medical sector. The development of such clinical decision support systems (CDSS) involves testing usability by applying experts and novices to improve the prototype (e.g. Caroll, Marsden, Soden, Naylor, New & Dornan, 2002).
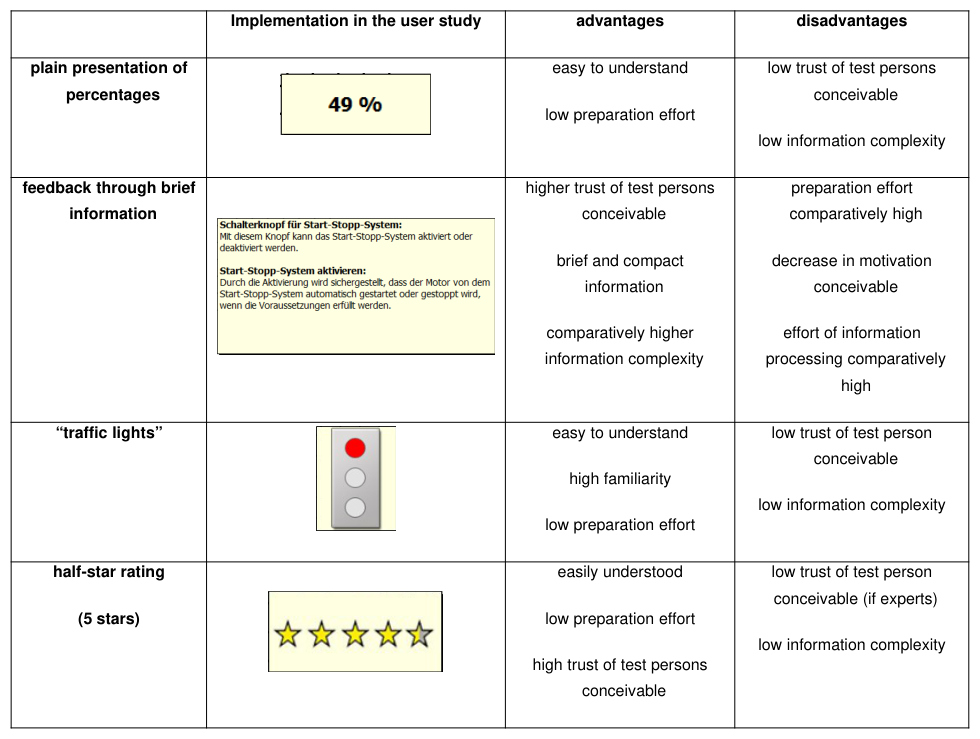
As mentioned previously, visualization of probabilities is one way to support decision making, in this particular case as recommendation to model a tracelink or not. However, there are several alternatives of visualization methods differing in complexity, test persons’ trust, understandability, and preparation effort (see also Table 1). For example, people prefer finer-grained scales like half-star ratings (Cosley, Lam, Albert, Konstan & Riedl, 2003) and appreciate more or less complex information depending on the decisions’ importance (Schengber, 2011). Furthermore the trust in ratings and probability visualization is generally high, even if given information were deliberately manipulated to be incorrect (Cosley et al., 2003). Additionally, perception of probabilities underlies several biases affecting how a decision is finally made. There are differences in the quality of deciding depending on the kind and complexity of probability visualization (Beuer-Krüssel & Krumpal, 2009). Hence it is necessary to compare how different alternatives of information visualization influence the decision-making process. Therefore a comparison between sheer textual/ numerical (feedback through brief information/plain presentation of percentages) and graphical (“traffic lights”, half-star rating) displays is made (Table 1).
Table 1: Visualization types for decision-making support and our implementation in the present experiment
RESEARCH QUESTIONS The present paper aims to find out which kind of information presentation is suitable to support users of a tracelink modeling method (EcoTracing) to make the right tracelink-decision. More specifically, this study addresses the following questions:
(1) Is there a difference in performance (number of errors, time exposure) and subjective measurements (system trust, decision complacency, workload and usability) between subjects who received decision support by additionally presented information and test persons who got no support? That question addresses if supporting decision making by information is useful at all.
As mentioned before, additional information can be divided into two classes of information presentation, textual/numerical and graphical. Thus it will be of interest to compare sheer textual/numerical displays against graphical alternatives.
(2) If it becomes apparent that the provided information generally turns into advantages for decision-making, it is consequently important to ascertain which alternative of information presentation leads to the ‘best’ performance (e.g. low number of errors)? Furthermore there should be a ‘medium’ trust in the entire method or system, because subjects are supposed to have a general but not blindly trust.
(3) Due to the fact that experiences can affect the performance of subjects when using methods like EcoTracing, a comparison between experts and novices is appropriate. In particular differences in performance and preferences for a specific alternative of information presentation may occur between subjects with more or less expertise.
In addition need for cognition (NFC) is measured due to the chance that this personality trait may affect the process of decision making significantly. Imaginable is a moderating role of NFC. To detect indications to improve the current version of the method EcoTracing by adding decision support, usability parameters are also acquired. Last but not least the current paper contributes to the research area of decision support concepts used for simplifying the work with technical systems and is supposed to give suggestions for further investigations on this subject.
METHOD
Design For answering the question if the decision support by advanced information visualization is useful at all a user study was done. This study used a 4 x 2 x 2 factorial design. The main independent variable was the kind of information presentation in four different varieties that can be additionally subdivided into sheer textual (plain presentation of percentages, feedback through brief information) and graphical (“traffic lights”, half-star rating) visualizations (see table 1). The variation was applied between subjects. Furthermore the differences between experts (n = 7) and novices (n = 8) have been explored. Finally the correctness of information given to support the decision was manipulated in the experimental conditions “plain presentation of percentages”, “traffic lights” and “half-star rating” within subjects. Thus 12 of in total 88 decisions were supported by deliberately incorrect information.
The objective measures of the study were the mean processing time to model one tracelink and its corresponding error rate. Two kinds of errors were distinguished: tracelinks that were not modeled at all (misses) and tracelinks that were wrong modeled (“real” error). Furthermore as subjective dependent variables work load caused by the task, post-decision satisfaction, trust in the system and usability were measured. Additionally demographic variables and the personality trait need for cognition were collected.
Due to the fact that the current study is constituted as an explorative analysis just a relatively small sample was tested and not all effects caused by the independent variables were analyzed and interpreted. Hence the effect of deliberately incorrect manipulated information was not investigated in the current paper yet. The collected data will be used for further analysis when the results give more specific indications for future research.
Participants Fifteen mostly male participants (1 female and 14 males) attended the current study. Their age ranged from 23 to 48 years with a mean age of 28.00 years (SD = 1.29). Seven participants were qualified as specialists by taking part in a course of TU Berlin referring to start-stop assistance for automobiles. Each of them was randomly assigned to one of two experimental conditions, respectively two different kinds of information presentation or the control group. The remaining test persons took part by signing in voluntary as novices in a web portal for participants. They completed just one experimental condition. The current profession was 7% unemployed, 7% employed and 86% were students at university.
Each experimental condition, inclusively the control group, was accomplished by four test persons. Members of the expert group received bonus for their course, novices were provided the opportunity to win a voucher. Two participants did not fill up all required demographic variables.
Materials
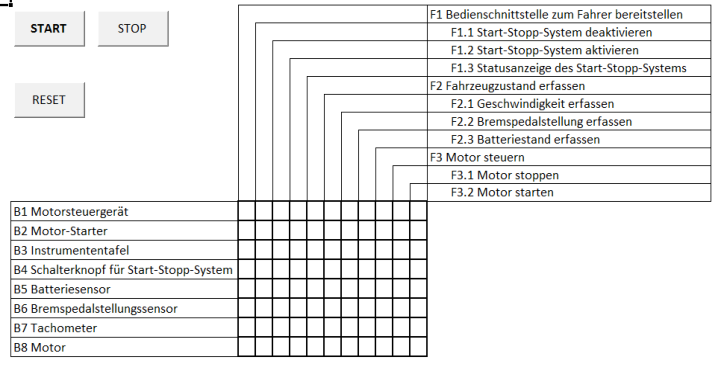
Description of the application: Tracelinks were modelled in a matrix implemented in EXCEL (version 2010). Functions were presented on top of the matrix and mechanical components were shown on the left-hand side (see
figure 1). With the three buttons in the upper left corner users were able to start, stop and reset the task. To provide an easier handling, the currently processed cell was yellow highlighted.
Figure 1. Matrix for modelling tracelinks. The artifacts on the left side are building components like "the engine" of a car. On the top is a functional structure of the start-stop assistance system with elements like "the engine stops".
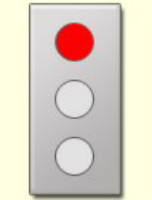
In the experimental conditions decision support by different kinds of information presentation were implemented. As mentioned before sheer textual (plain presentation of percentages, feedback through brief information) and graphical (“traffic lights”, half-star rating) displays were used. More specifically graphical information presentation can be subdivided in the finer-grained half-star rating and the traffic light visualization with just three increments (see figure 2). In detail, focusing the half-star rating each half-star corresponded to a likelihood of 10% that a tracelink may exist. Referring to the research of Wiczorek (2012) the intervals of the traffic lights were defined: 65% to 100% likelihood that a tracelink may exist conformed to green light, 11% - 64% to yellow light and 0% - 10% to red light. Decision support by information popped up when moving the mouse cursor over a chosen cell or when working on the cell.
Figure 2. Increments of traffic light visualization and examples for half-star rating (left: 60-69%, right:
10-19%).
Survey instruments: In total five questionnaires were used to measure the subjective dependent variables.
• Task load was recorded by NASA-TLX (Hart & Staveland, 1988). Therefore the 6 Items mental demand, physical demand, temporal demand, performance, effort and frustration were rated on a ten-point scale each. [Equation or mathematical symbol available in the original paper PDF] To collect data relating to post-decision satisfaction the decision attitude scale (Sainfort & Booske, 2000) was used. This survey instrument includes 10 items with scales ranging from 1 (strongly disagree) to 5 (strongly agree). Four of them are reversed items. [Equation or mathematical symbol available in the original paper PDF] Furthermore system trust was measured with a questionnaire by Wiczorek (2011). Two of the 16 items are inverted. Scores were recorded on a 4-point scale (1-4) without neutral responding option.
• The short form of the instrument IsoMetrics (Willumeit, Gediga & Hamborg, 1996) was applied to measure seven common usability factors: suitability for the task, self descriptiveness, controllability, conformity with user expectations, Error tolerance, suitability for individualization and suitability for learning. Nine of in total 90 items are reversed and the scores were recorded on a 5-point scale. [Equation or mathematical symbol available in the original paper PDF] Finally the personality trait need for cognition was investigated by using 5-point need for cognition scale (Cacioppo, Petty, & Kao, 1984). Half of the 18 items are reversed.
Task and Procedure Participants completed the experiment individually. After giving written consent to take part in the study, subjects filled up demographical variables and read some short texts introducing them to the topics traceability, modelling of tracelinks and to the task they had to do. Except the control group the different experimental groups received a written explanation of the information visualization they were supported by. Subjects were asked to model tracelinks for given sets of sub-elements (mechanical components x functions) in a matrix presented in EXCEL. After reading the instruction every test person practiced the task with a simple example without any decision support. In this example the matrix in EXCEL had 56 cells. When the example was completed and no question remained, the actual task started. Participants were instructed to process a matrix referring to start-stop assistant in automobiles. For the test trials, the matrix consisted of 88 cells. Now the experimental groups received support by the information visualization that was assigned to their condition. Subsequently participants completed a questionnaire for recording subjective dependent variables. In contrast to novices experts had to deal with two different kinds of information presentation (textual/numerical or graphical) and hence these participants had to fill up two questionnaires – one for each condition. The entire experiment took a total of approximately 45 to 60 minutes; experts needed about 20 minutes more time to complete the tasks. During the course of the experiment an examiner was present to answer questions.
RESULTS
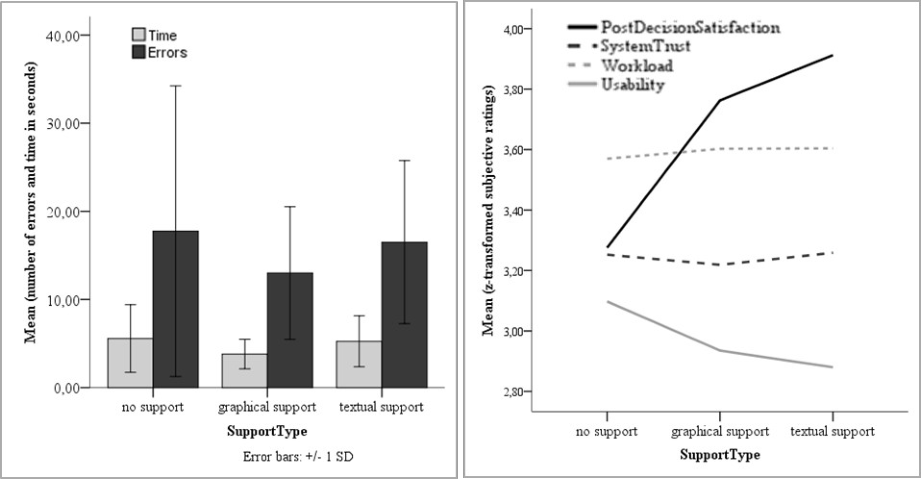
The first research question was, whether the information visualization supports subjects’ performance of tracelink modeling. For information visualization being present we expected decreasing errors and task completion time. However, the differences between the groups support (time: M = 4.52, errors: M = 17.75) and no support (time: M = 5.57, errors: M = 14.75) are not significantly different (ANOVA). Still the means for time and number of errors are increasing with support for decision-making. On a descriptive level, task completion time and the error rate with graphical support is better than textual support. Figure 3 (left hand side) visualizes these results.
Additionally we expected that the given visualizations decrease subjective workload and increase subjective trust in the system, usability and post decision satisfaction. But three of the four of these dependent variables perform the other way round (not significantly). Only the post decision satisfaction increases with the decision support (no support: M = 3.27, support: M = 3.84) and has a medium effect size, η² = .09 (but no significance). In detail the post decision satisfaction is higher with the textual than the graphical support (see fig. 3, right hand side).
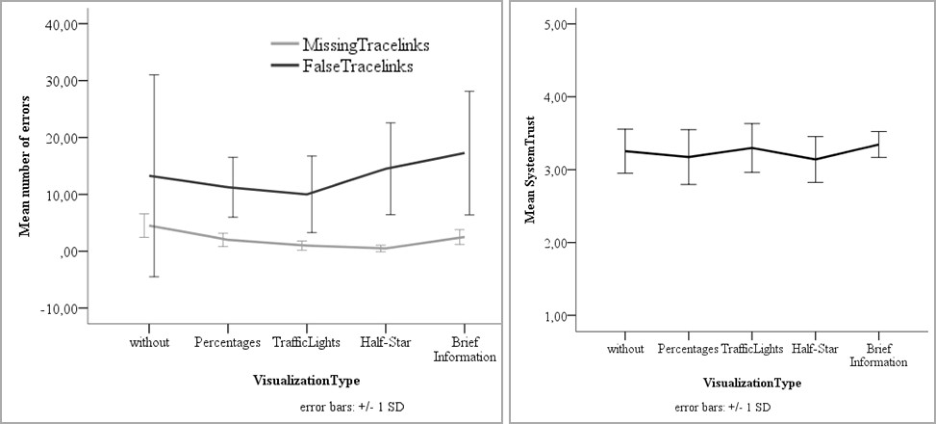
In relation to the second research question, which kind of information presentation is the “best”, first the errors were analyzed. Overall the error rate is least in the “traffic-lights” group with seven errors less to the without information presentation condition. More specifically the error type missing tracelinks is significantly lower to the no support group in the “traffic-lights” (Bonferroni corrected pairwise comparison, p = .016) and in the half-star rating condition (p = .005). Figure 4 (left) displays the results. Additionally we analyzed system trust to find a visualization type with no blind trust but “enough” trust that the information presentation is used by the engineer to prevent false tracelinks. However, the system trust is equal in each condition and besides the trust in on a medium level (see fig. 4 right side).
Figure 3: left: performance data (errors and time) in dependency of support type; right: subjective ratings in dependency of support typeFigure 4: left: number of two error types depending on visualization type; right: subjective trust in the system (scale 1-5) in dependency of visualization type
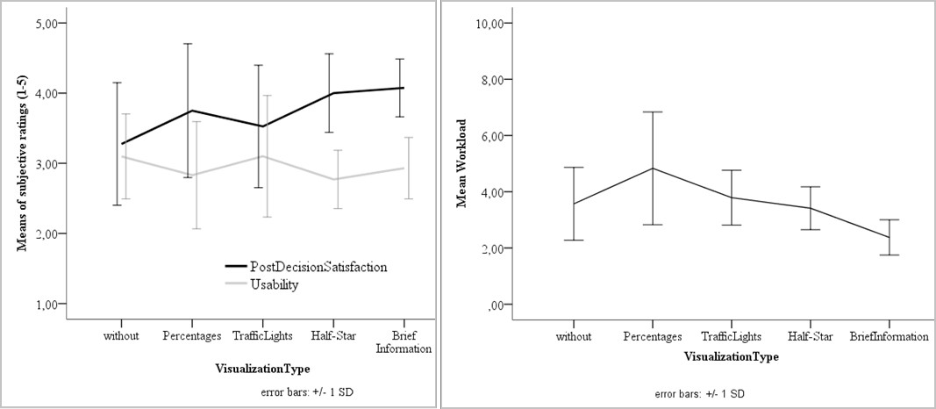
To complete the analysis of the four different visualizations subjective ratings for workload, usability and post decision satisfaction are studied. The highest usability ratings were obtained for the “traffic-lights” visualization. The highest satisfaction ratings were given for the condition with brief information (see fig. 5, left). Furthermore the satisfaction correlates significantly with the workload (Pearson correlation, two-sided, r = .50, p = .02). In terms of workload, the participants rated the experimental condition showing brief information lowest (see fig.5 right).
Figure 5: left: subjective ratings of post decision satisfaction and usability (both scale 1-5); right: subjective workload depend on visualization type
With reference to the third research question, whether the experience of users influences their performance and subjective ratings, we analyzed errors, time and subjective ratings again over all conditions. First novices made (not significant) more errors (missing and false tracelinks) and needed significantly more time than the experts (F(1) = 5.51, p = .03, η² = .23 (large effect)). With respect to workload and system trust results were not significant. The experts felt significantly more post decision satisfaction (F(1) = 7.21, p = .01, η² = .29 (large effect)) compared to the novices. With large effect size but no significance the experts rated lower usability in all conditions. In detail, the information presentation with half-stars is most fast and in the novice group the highest satisfaction.
At least the co-variable need for cognition shows a tendency (p<0.10) on the dependent variables time and workload and was a little bit higher in the expert group.
DISCUSSION AND CONCLUSION The aim of the present study was to find the best visualization of a decision support for modelling tracelinks of a mechatronic system. Most important dependent variables were performance times, number of errors and subjective ratings. Regarding the results, better performance in tracelink modelling with graphical visualization support (“traffic-lights” and half-star rating) than with textual information presentation (percentages and brief information) was demonstrated. Post decision satisfaction also increases with support and was higher in the textual/ numerical condition than in the graphical conditions. However, there were unexpected patterns of subjects’ performance (many errors) and subjective trust and usability (both high, too) ratings. For example the presentation type “brief information” was related to high system trust and post decision satisfaction but also to good usability and low workload. However with this decision support the most errors were generated. This result is similar to (Beuer- Krüssel & Krumpal, 2009) who found more biases in support systems with more complex information.
Conditions with graphical support did not differ systematically. Therefore it is not clear which one is better, the traffic-lights or the half-star rating. The results showed effects with medium or large effect sizes, descriptive differences between the visualization types and a positive manipulation effect for the expert group. Hence, we tend to prefer the half-star ratings as best visualization, because in the expert group the performance and the subjective ratings were best in with this visualization type. This consequence matches the results of (Cosley, Lam, Albert, Konstan & Riedl, 2003), who found out that people prefer finer-grained graphical visualizations for decision making support.
To conclude, the present work investigated different visualization types for tracelink decision support systems. Results showed a slight advantage for half-star ratings. However, the present study can only serve as a pre-study. One reason is that the samples size in this pre-study not large enough to obtain generalizable results. Another reason is that the experts used in the investigation did not have long-term experience in modeling tracelinks. Future work should include more experienced experts to be able to better generalize the results beyond the experimental setting. However, this first investigation yielded valuable results that can be used to further investigate this issue.
ACKNOWLEDGEMENT
The research project opTRAC is funded by the German Federal Ministry of Education and Research (BMBF) within the funding program ”IKT 2020” (funding number 02PC105x) and managed by the Project Management Agency – part of the German Aerospace Center (PT-DLR).
REFERENCES
Antoniol, G., Canfora, G., Casazza, G., and De Lucia, A. (2000). Information Retrieval Models for Recovering Traceability Links between Code and Documentation. In Proceedings IEEE International Conference on Software Maintenance (ICSM'00), San Jose, CA. Beuer-Krüssel, M., & Krumpal, I. (2009). Der Einfluss von Häufigkeitsformaten auf die Messung von subjektiven
Wahrscheinlichkeiten. Methoden, Daten, Analysen, 3, 31-57. Cacioppo, John T. & Petty, Richard E. (1982). The need for cognition. Journal of Personality and Social Psychology 42,116-131.
doi:10.1037/0022-3514.42.1.116 Caroll, C., Marsden, P., Soden, P., Naylor, E., New, J., & Dornan, T. (2002). Involving users in the design and usability evaluation of a clinical decision support system. Computer Methods and Programs in Biomedicine, 69, 123-135. Cosley, D., Lam, S.K., Albert, I., Konstan, J.A., & Riedl, J. (2003). Is Seeing Believing? How Recommender System Interfaces
Affect Users' Opinions. In Proceedings of the CHI 2003 Conference on Human factors in Computing Systems, Fort Lauderdale, FL. Hayes, J. H., Dekhtyar, A., Sundaram, S. K. (2006). Advancing Candidate Link Generation for Requirements Tracing: The Study of Methods. IEEE Transactions on Software Engineering 32(1), 4-19. Petty, R.E. & Cacioppo, J.T. (1986). The elaboration likelihood model of persuasion. In L. Berkowitz (Ed.), Advances in
experimental social psychology (Vol. 19, pp. 123-205). New York, NY: Academic Press. Sage, A. P. (1992). Systems Engineering. New York: Wiley. Schengber, R. (2011). Social Media Einfluss auf das Kaufverhalten im Internet. Retrieved from http://www.dsaf.de/downloads/Studie_-_Social_Media_Einfluss_auf_das_Kaufverhalten_im_Internet.pdf Sojka, J. Z., & Giese, J. L. (2000). The Influence of Personality Traits on the Processing of Visual and Verbal Information.
Marketing Letters, 12, 91-106. doi:10.1023/A:1008132422468 Stark, R.; Figge, A. (2011): Eco Tracing - A Systems Engineering Method for Efficient Tracelink Modelling. In: Culley, S. J. et al. (Hg.): Proceedings of the 18th International Conference on Engineering Design. Product and Systems Design, Vol. 4, ICED '11, Kopenhagen, Dänemark, August 15-18, S. 21–32. Wickens, C. D., Hollands, J., Banburry, S., & Parasuraman, R. (2012). Engineering Psychology and Human Performance. (4th
ed.). New York, NY: Pearson. Wiczorek, R. (2011). Entwicklung und Evaluation eines mehrdimensionalen Fragebogens zur Messung von Vertrauen in technische Systeme. In Schmid, S., Elepfandt, M., Adenauer, J. & Lichtenstein, A. (Hrsg.) Reflexionen und Visionen der Mensch-Maschine-Interaktion - Aus der Vergangenheit lernen, Zukunft gestalten. 9. Berliner Werkstatt Mensch-Maschine- Systeme. (pp.621-626) Berlin: Spektrum. Wiczorek, R. (2012). Verhaltenswirksamkeit von Likelihood Alarmsystemen. Dissertation Technische Universität Berlin.
Universitätsverlag TU Berlin
LISTED IN THE AHFE DIGITAL BOOKSTORE CATALOGUE
Explore the complete digital volume
Advances in Human Factors, Software, and Systems Engineering
Read this individual research paper free through the original publisher, or explore the full digital proceedings book.
ISBN 978-1-4951-2096-1
Explore this ISBN in the AHFE Bookstore ↗Listed in the July 2026 bookstore catalogue; search by ISBN to confirm current availability · Digital book purchase optional