Hiroyasu Miwa, Kentaro Watanabe, Tomohiro Fukuhara (2019). Proposal of Quality Studyfor Nursing-Care Service. In: Advances in The Human Side of Service Engineering. AHFE Open Access, vol. 8. https://doi.org/10.54941/ahfe100285
Quantitative measurement of service process and service quality are necessary to evaluate the service productivity. We have measured employee behaviors at nursing-care facilities using the time and motion study, and visualized their nursing-care service processes. However, we have not assessed the service quality. Therefore, this paper describes development of a service quality model and a measurement system for it in nursing-care services. We examined a nursing-care facility and assessed employee consciousness related to service quality using interviews and questionnaire surveys to develop service quality model. We then proposed a quality study for methods of measuring service quality, along with prototype software developed for the quality study.
Nursing-care services are provided in Japan as facility care services, home care services, and day services. The facility care services are provided at nursing homes where elderly people live. Home care services are provided at individual homes of elderly people. Day services are provided at nursing facilities that elderly people visit. At nursing care facilities, employees such as care workers, nurses, and care managers provide nursing-care services according to care plans designed to meet residents’ physical and mental conditions and needs. In addition, they have heavy physical and mental workloads because of limited human resources. Hence, they must improve service productivity to fulfill residents’ satisfaction and reduce the workload.
The service productivity is defined as the ratio of input resources to provide service and the additional value provided to the customer. It is expected to be increased by the improvement of operational efficiency and additional value or by creation of new business (Research Group on Innovation and Production of Service Industry, 2007). We considered that the additional value included factors to increase customer satisfaction such as quality, safety, and security of nursing-care service, and that the resources were employment and management cost. Improvement of service quality while maintaining costs is one means to improve the service productivity in nursing-care services.
However, traditional evaluation of service quality has not been based on engineering methods but on the inspiration of managers or employees involved in nursing-care services because service quality includes many subjective factors. The authors inferred that a measurement system of service quality would be useful to improve the service productivity. Therefore, this study was undertaken to develop a service quality measurement system. As described in this paper, we propose a service quality model and a service quality measurement method.
PREVIOUS WORK The authors previously defined service processes as a flow of humans, objects, information, tools, time, and money in the service field, and also defined nursing-care service processes. The nursing-care service process indicated when, where, who, what, and to whom the employees acted. We developed a task classification for nursing-care services and a description of nursing-care service processes using a state transition model to visualize the nursing- care service process and to support the improvement of service productivity. Figure 1 presents the task classification structure for nursing-care services. We measured employees’ behaviors at nursing-care facilities using a time and motion study, and visualized their nursing-care service process. We confirmed that visualization was effective for quantitative feedback, and evaluated the nursing-care service process (Miwa et al., 2012) (Miwa et al., 2013). Additionally, we are continuing development of a communication enhancement system to support the improvement and design of a nursing-care service process (Watanabe et al., 2013).
Service type Purpose / Situation Operation Guide of wheel Care Residents’ transfer chair
Change of position Nursing Walking assistance Dressing/Cosmetic cleaning Rehabilitation Transfer assistance
Excretion Care management Eating Preparation Meal and Nutrition
Equations and mathematical formulas are available in the original paper PDF.
Indirect work
Data recording
Residents’ Understanding Information share Calculation Off duty
Measurement Data recording
Printing / Copy
error
Figure 1. Three-layer structure of task classification for nursing-care service.
Figure available in the original PDF paper.
SERVICE QUALITY MODEL Service Quality
In the field of manufacturing, productivity is defined as the ratio of production value and production cost calculated using the number of employees and their working hours. The production value would not vary if the amount of production remained constant. Accordingly, reduced working hours would be effective to increase productivity.
However, in the field of services, the concept of productivity is extended, and service productivity is defined as the ratio of additional value provided to a customer and input resources to provide services. Nursing-care services provide many services such as walking assistance, meal assistance, excretion assistance, health management, medicine management, and rehabilitation. The additional value of the nursing-care service is created by provision of appropriate service by service providers such as care workers and nurses to service receivers such as elderly people and facility residents. In addition, uniform services do not satisfy service receivers because their physical and mental condition are individualized. Optimization to their condition is necessary to increase their satisfaction. Therefore, we defined service quality as adequacy of service provided to the service receivers, and inferred that service quality is proportional to the additional value created in the service.
Moreover, the additional value varies according to the employees’ skill and assistance procedures even if the provided service is the same in the nursing-care service. The service productivity does not increase when the additional value is decreased by reduction of the resources. In the worst case, service productivity decreases and becomes trapped in a negative loop because of emergent difficulties related low service quality.
Therefore, modeling and measurement of service quality and input resources are necessary to evaluate service productivity of nursing-care services. As described in the previous section, we measured nursing-care service processes with the time and motion study. This work contributed to the evaluation of input resources. However, we have not measured how employees provided their services and developed the service quality model.
Modeling of Service Quality We examined a health institute on long-term care for the aged “Wakouen”, located in Nanao, Japan. We interviewed two care workers to survey differences of service quality among employees. They responded that large differences prevailed in terms of meal assistance and excretion assistance among employees. Especially, the meal assistance had the features shown below.
* Meals are pleasurable for elderly people. * Employees have longer contact with elderly people during meal assistance than during other services. * Employees must check more points when providing meal assistance than during other services. * Employees have higher awareness of meal assistance more than of other services. * Elderly people face a risk of death or injury in case of aspiration.
Providing high-quality meal assistance service increases satisfaction of elderly people. Moreover, meal assistance constitutes an important nursing-care service. Therefore, we chose to develop a service quality model for meal assistance from among many service that employees performed.
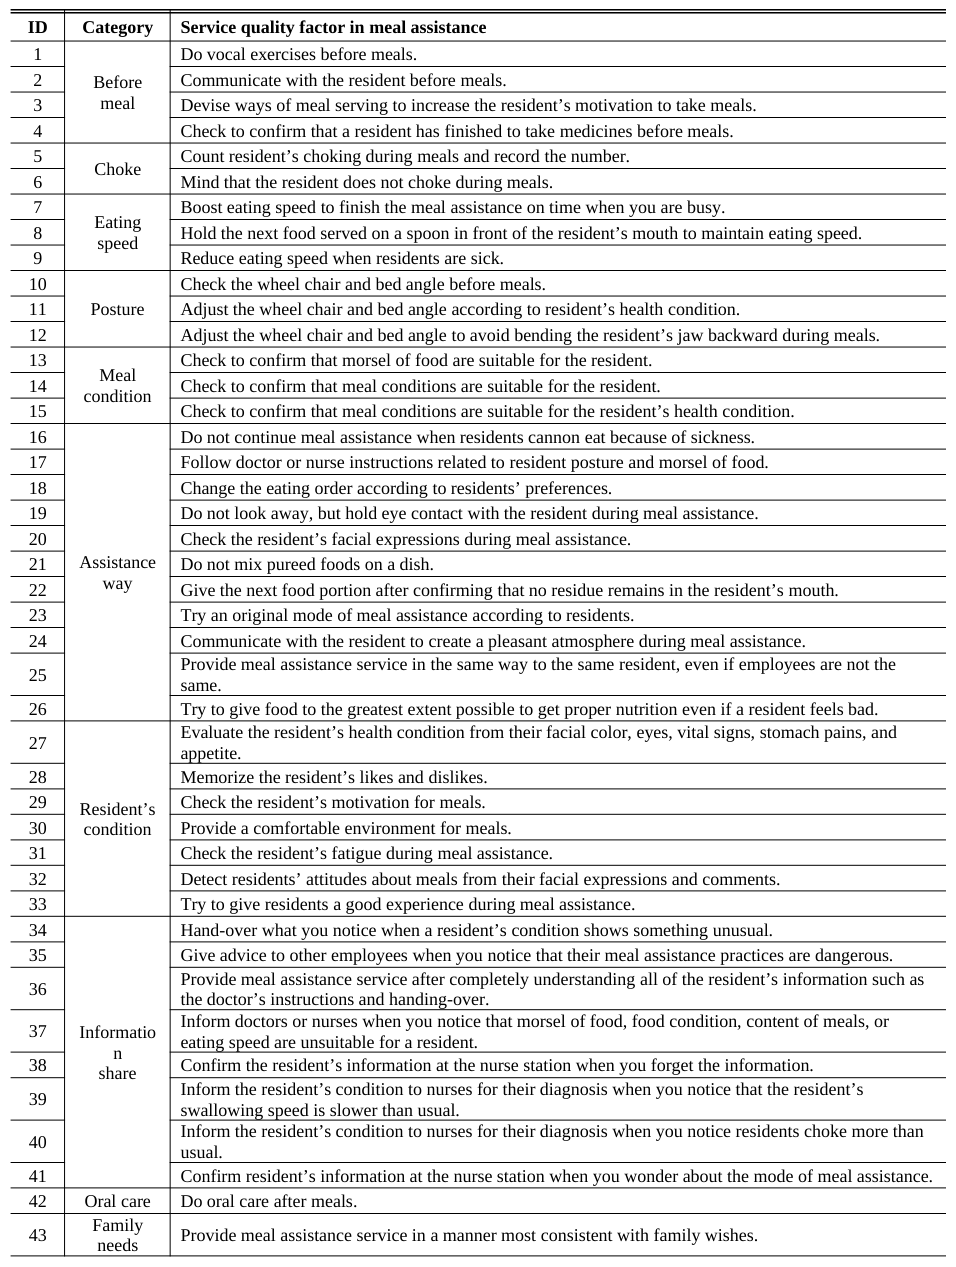
Quality of Meal assistance We interviewed a care worker, a nurse, and a managerial dietician, all of whom were key persons related to meal assistance. Based on their responses, we developed a meal assistance service quality model. Results for meal assistance showed 28 important points related to service quality from the care worker, 14 points related to the nurse, and 30 points related to the managerial dietician. We extracted 11 categories and 43 service quality factors composing meal assistance service quality, as shown in Table 1.
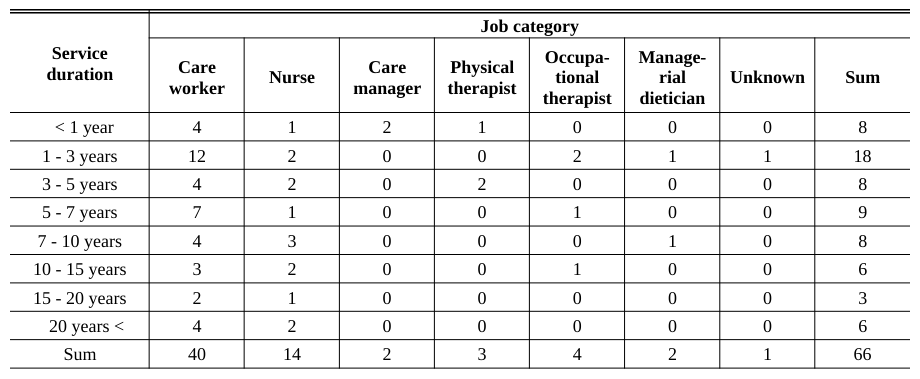
Subsequently, we surveyed employee attitudes using a questionnaire. Employees chose items practicing daily meal assistance from the service quality factor of meal assistance. 66 employees giving meal assistance to the facility residents answered the questionnaire as shown in Table 2. Figure 2 shows response rate of each service quality factor of meal assistance. We inverted the response rates of factors 7, 8, and 26 which were negative questions. The average quantity of responses for an employee was 32.4 (SD: 6.35), the average quantity of responses for a service quality factor was 49.7 (SD: 11.9). The average response rate was 75.3% (SD: 18.0%).
Consideration We assessed the relation between the service duration and the average response rate. Then, the average response rate showed a linear increase with the service duration, as shown in Figure 3. Longer-term employees were able to practice more service quality factors in daily work. The correlation coefficient between service duration and the average response rate was 0.92. The regression model is shown as equation (1). Its coefficient of determination R2
was 0.844.
However, not all factors were proportional to service duration. Results showed that short-term employees got a high response rate of some service quality factors. We calculated the mean and standard deviation (SD) of the response rate. Service quality factors with high mean value had low SD. Those with low mean value had high SD, as shown in Figure 4. We classified them into two groups using discriminant analysis. Group 1, including 28 factors, had a high mean value and low SD. Group 2, including 15 factors, had a low mean value and high SD.
Table 1: Service quality factors of meal assistanceTable 2: Survey conditions related service quality factors of meal assistance
Figure 2. Survey results of response rate about service quality factors of meal assistance.
Figure available in the original PDF paper.
Figure 5 shows the relation between average response rates of each group and service duration. Group 2 increased the average response rate according to service duration more than Group 1. We assumed that all employees could practice the service quality factors in Group 1 irrespective of the service duration and that the factors should be provided to residents as usual services. We named it “Fundamental Quality (FQ)”. However, we considered that employees experientially acquired service quality factors in Group 2, and that the resident’s satisfaction was increased by providing the factors in Group 2. We named it “Experimental Quality (EQ)”.
As explained above, results showed that the service quality in meal assistance consisted of 43 service quality factors classified into two groups: FQ and EQ.
Average response rate %
0 5 10 15 20 25
Service duration year
Figure 3. Relation between service duration and average response rate.
Figure available in the original PDF paper.
Group 1 Group 2
Standard deviation of response rate %
Average response rate %
Figure 4. Average and standard deviation of response rate.
Figure available in the original PDF paper.
Average respons rate %
Service duration year
Figure 5. Average response rate of fundamental and experimental quality.
Figure available in the original PDF paper.
QUALITY STUDY Proposal of Quality Study
To measure nursing-care service quality, we proposed a “quality study” by extension of the time and motion study used for our measurement of nursing-care service process.
The time and motion study is defined as “the observation and analysis of movements in a task with emphasis on the amount of time required to perform the task.” A continuous measurement method or work sampling method is generally used for the time and motion study. The subjects’ behaviors are assessed through observation by a third person or by self-reporting of the subjects (Pigage et al., 1954). Similarly, the quality study assessed the subjects’ service quality through observation by a third person or by self-reporting of the subjects.
In addition, service quality should be classified to standardize and compare the service quality similar to task classification for nursing-care services. We regarded service quality factors as applicable for the classification of service quality. For example, when we would like to measure the service quality of meal assistance, we can use the service quality factors of meal assistance proposed in the previous section. And, we observe and evaluate the employees’ FQ and EQ.
In the future, we expect to conduct continuous measurement for use in a quality study and for applications to employee training, as well as service process evaluation, by comparison of service quality among employees.
Development of proto type software We considered not only that quality study but also time and motion study should be conducted and that overlapping visualization of their results was effective for deep evaluation of the service productivity. Nevertheless, it is difficult to record both quality study and time and motion study simultaneously in notebooks because employee behaviors in nursing-care service change quickly.
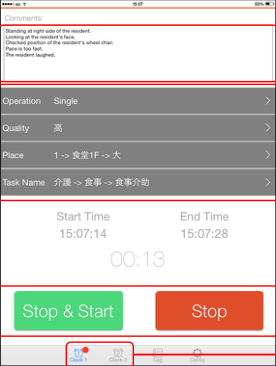
Therefore, we developed prototype software to support both quality study and time and motion study. Figure 6 presents a screen image. The prototype software runs on iOS (iPod touch, iPhone, and iPad, Apple Computer Inc., USA) and was released from the AppStore (Apple Computer Inc., USA). We were able to input free description as comments and service type, select service quality, location, and behavior from predefined lists. The “Start and Stop” button recorded the employee state and time. We were also able to measure two conditions or two employees in parallel using individual clocks implemented inside the software.
We will conduct the quality study and the time and motion study using the prototype software in the service field. Then, we will evaluate its efficiency and usability.
Input comments as free description.
Select service type, service quality, location and behavior from pre-defined lists.
Start and Stop the clock.
Choose clock.
Figure 6. Prototype software to support quality study.
CONCLUSIONS
As described herein, we surveyed employees’ attitudes related to service quality using interviews and questionnaires administered to employees at a health institute on long-term care for the aged: “Wakouen”. We proposed a service quality model for meal assistance consisting of 43 service quality factors classified into two groups: Fundamental Quality (FQ) and Experimental Quality (EQ). FQ was acquired irrespective of the service duration; EQ was acquired from experiments. Additionally, we proposed the quality study as a method of measuring service quality, and proposed development of prototype software to conduct quality study and time and motion study simultaneously.
ACKNOWLEDGMENTS
This study was supported in part by the Ministry of Education, Culture, Sports, Science and Technology (MEXT) of Japan, KAKENHI, Grant-in-Aid for Scientific Research (C), Grant Number 24500676. The authors also would like to express their appreciation to Keiju Healthcare System and to Wakouen.
REFERENCES
Ministry of Health, Labour and Welfare (MHLW) (2011), “Survey results of nursing-care service facilities and companies in 2009” (in Japanese). Miwa, H., Fukuhara, T., Nishimura, T. (2012), “Service process visualization in nursing-care service using state transition
model”, Advances in the Human Side of Service Engineering, pp.3-12. Miwa, H., Nakajima, M., Fukuhara, T., Nishimura, T. (2012), “Proposal of handing-over support system for nursing-care service with service engineering approach”, The Philosopher's Stone for Sustainability, pp.131-136. Pigage, L.C., Tucker, J.L. (1954), “Motion and time study”, The University of Illinois Bulletin, Vol. 51, No 73. Research Group on Innovation and Production of Service Industry (2007), “Report of innovation and productivity improvement
of service industry”, Vol. 25 (in Japanese). Watanabe, K., Nishimura, T., Niino, Y., Kobayakawa, M., Yamada, K., Sunaga, T., Motomura, Y. (2013), “UPAD Toolkit for Service Design”, Proc. Design Engineering Workshop 2013.
LISTED IN THE AHFE DIGITAL BOOKSTORE CATALOGUE
Explore the complete digital volume
Advances in The Human Side of Service Engineering
Read this individual research paper free through the original publisher, or explore the full digital proceedings book.
ISBN 978-1-4951-2091-6
Explore this ISBN in the AHFE Bookstore ↗Listed in the July 2026 bookstore catalogue; search by ISBN to confirm current availability · Digital book purchase optional