Jingyu Huang, Wu Yinglin, Tingru Zhang (2025). Designing transparency for automated driving: Effects of ambient light cues and explanations on driver performance. In: Human Factors in Design, Engineering, and Computing. AHFE Open Access, vol. 199, pp. 592–602. https://doi.org/10.54941/ahfe1006871
Autonomous vehicle (AV) demonstrates significant potential to reduce traffic accidents, lower harmful emissions, and enhance mobility, potentially transforming traditional road transportation. However, AV based on artificial intelligence algorithms exhibits characteristics such as black-box nature, uncertainty, and autonomy, posing challenges including low public acceptance and difficulties in human-machine collaboration. In this context, enhancing transparency is crucial for promoting AV adoption, optimizing the human-AV co-driving experience, and improving driving safety. This study employs the Situation awareness-based Agent Transparency (SAT) theory, treating the system’s level of uncertainty in complex driving scenarios as transparency information conveyed via ambient lighting. Driving simulator experiments were conducted, manipulating light pattern (constant, blinking, breathing) and explanatory information provision (presence, absence) as independent variables. Data from 54 participants—including eye tracking, skin conductance, questionnaires, and takeover performance—were collected and analysed.Results indicate that both breathing ambient lighting and explanatory information effectively enhance drivers’ perception of potential risks, with explanatory information significantly reducing takeover reaction time. However, compared to constant lighting, both blinking and breathing patterns substantially increase driver workload, while explanatory information impairs driving stability and reduces driver acceptance and perceived usefulness of AV. This research expands transparency literature, validates the applicability of SAT theory in autonomous driving contexts, quantifies the trade-off between safety and subjective experience, and establishes uncertainty visualization as a distinct transparency construct. It provides a theoretical foundation for improving human subjective driving experiences with AV2. Also, the findings offer actionable guidance for AV transparency design, assisting manufacturers in determining how to design and present transparency information to enhance user safety during automated driving.
Designing Transparency for Automated Driving: Effects of Ambient Light Cues 593
evolving. They hold great potential to reduce traffic accidents, lower harmful emissions, and improve transportation convenience, thereby poised to fundamentally transform traditional road transportation patterns (Nastjuk, Herrenkind, Marrone, Brendel, & Kolbe, 2020; Waung, McAuslan, & Lakshmanan, 2021). Although autonomous driving technology is advancing rapidly, AI-based autonomous vehicles exhibit characteristics such as black- box behavior, uncertainty, and autonomy. This makes it difficult for users to comprehend their operations and decision-making processes, leading to challenges including low public acceptance and potential safety risks stemming from difficulties in human-machine collaboration (De Freitas, Agarwal, Schmitt, & Haslam, 2023).
Therefore, enhancing transparency, defined as a system’s capacity to convey its state, purpose, intent, and decision-making logic in a understandable way (Arrieta et al., 2020), is essential to promoting adoption and optimizing the human-machine driving experience(You, Deng, Hansen, & Zhang, 2022). Its core objective is to help users construct a cognitive framework for understanding the behavioral logic of automated systems to assess the rationality, reliability, and expected outcomes of system behavior (Dzindolet, Peterson, Pomranky, Pierce, & Beck, 2003). Chen et al. (2014) proposed the Situation Awareness-based Agent Transparency (SAT) theory, categorizing transparency into three dimensions: intent transparency (what the system plans to do), rationale transparency (why it acts that way), and capability transparency (how confident or uncertain it is under varying conditions, e.g., environment or traffic). These dimensions are fundamental to enhancing users’ situational awareness, trust, and acceptance (Lee & Jeon, 2022). Most existing studies on autonomous vehicle transparency examine “what”and “why”explanations. For example, Koo et al. (2015) conducted a driving simulation experiment to compare the effects of “what”, “why”, and “what + why” explanations on drivers’ attitudes and behaviors; Kaufman, Costa, and Kimani (2024) designed an experiment incorporating both “what” and “why” multimodal explanations (presented through visual and auditory modalities). In addition, some studies have explored the impact of the presentation methods of transparency information on drivers’ subjective perceptions and takeover performance. Kunze, Summerskill, Marshall, and Filtness (2019) introduced a visualization resembling heart rate variability to dynamically convey changes in system reliability. They observed that while this visual display increased drivers’ monitoring frequency and improved takeover performance, it also led to excessive attentional capture.
In summary, existing research on information presentation predominantly relies on foveal vision within the visual modality, requiring drivers to focus their attention on specific interface elements (such as instrument panels or center consoles). However, since driving information presentation already consumes focal visual resources, overreliance on focal vision for transparency information display may create additional attention competition. According to Multiple Resource Theory (Wickens, 2008), human information processing resources are limited. When multiple tasks compete for the same sensory channel, performance is likely to decline.
Therefore, it is necessary to explore utilizing peripheral vision to convey transparency information to alleviate cognitive conflict. Currently, this area requires further research.
Guided by the SAT framework, this study uses a driving simulator experiment to convey uncertainty through ambient lighting designed for peripheral vision. To further enhance system transparency, textual explanations are incorporated via foveal vision during high-uncertainty scenarios. The research aims to: (1) investigate how different dynamic lighting patterns affect users’ subjective experience and driving performance metrics in autonomous vehicles; (2) examine how combining peripheral lighting with textual explanations under high-uncertainty conditions influences user experience and driving indicators.
METHOD
Participant A total of 54 participants were recruited for the experiment, most of whom were students from Shenzhen University. Their ages ranged from 18 to 35 years, and their driving experience varied from 0 to 5 years. The average age of the participants was 22.78 years, with an average driving experience of 2.04 years. Among them, 21 were female and 33 were male.
Driving Scenarios The driving scenarios in this experiment were simulated using UC-win/Road software, featuring a two-way six-lane urban road. Each participant experienced eight driving events (see Table 1). These included four medium uncertainty scenarios where ambient lighting alternated between green and yellow, two high uncertainty scenarios where the lighting cycled through green, yellow, and red without takeover warnings, and two extremely high uncertainty scenarios where the same tri-colour lighting was accompanied by takeover alerts. Due to the critical nature of these extreme uncertainty scenarios, which prevented the driving system from providing extended preparation time, the takeover lead time was set to 3 seconds.
Table 1: Driving scenario introduction.
Table available in the original PDF paper.
Scenario Uncertainty Introduction Driving in fog Medium The vehicle entered a foggy area. As visibility decreased, it decelerated and the ambient light changed from green to yellow. After leaving the area, the ambient light returned to green.
Continued
Designing Transparency for Automated Driving: Effects of Ambient Light Cues 595
Table 1: Continued Scenario Uncertainty Introduction
Table available in the original PDF paper.
Faded lane markings
Medium The vehicle entered a section with unclear lane markings, decelerated, and the ambient light changed from green to yellow. After leaving the section, the light returned to green. Driving in dense fog
Extremely high
The vehicle entered a foggy area, where reduced visibility triggered a change in ambient light from green to yellow and a decrease in speed. As it entered a denser fog zone, the light turned red and the vehicle continued to decelerate. When an abnormally stopped vehicle was detected 33 meters ahead (a 3-second headway), a takeover alert was issued. After bypassing the vehicle and leaving the foggy area, the ambient light changed from red to yellow and finally returned to green. Driving in rain High After the vehicle entered a rainy area, the ambient light changed from green to yellow and the vehicle began to decelerate. Ten seconds later, as rainfall intensified and visibility decreased, the light turned red and the vehicle continued to slow down. Upon leaving the area, the ambient light returned to green. Road work Medium As the vehicle approached a road construction area, the ambient light changed from green to yellow and the vehicle decelerated. After leaving the area, the ambient light returned to green. Nighttime intersection
High At night, the vehicle on an unlit road approached an unsignalized intersection. The ambient light changed from green to yellow with deceleration, turned red near the intersection, and returned to green after passing.
Experimental Design The experiment employed two between-subjects factors: ambient light rhythm and explanation. Ambient light rhythm featured three variations (constant, flashing, and breathing) using green, yellow, and red colors
to convey uncertainty, while explanation had two conditions (present vs. absent), creating a 3×2 between-subjects design with six groups.
For the light rhythms: the constant mode maintained constant brightness; flashing activated once every 3 seconds; and breathing simulated human breathing patterns with color-specific frequencies: green light cycled once every 5 seconds, yellow light once every 3 seconds, and red light once per second.
When system uncertainty was high (indicated by red ambient light), a textual explanation was displayed centrally above the driving interface for participants in the explanation group. For example, when the vehicle driving in the dense fog, the explanation “Dense fog area, visibility too low” was presented to drivers.
Procedure Upon arrival, participants provided informed consent and received a standardized briefing on experimental procedures, including ambient light semantics and task protocols. A 5-minute practice session followed, featuring acceleration, deceleration, takeover manoeuvres, and a secondary Schult grid task (sequential selection of numbers 1–16 in a 4×4 matrix) designed to simulate divided attention scenarios.
Participants were then instrumented with Tobii Glasses 2 for eye tracking and a Kingfar wireless GSR sensor. During the formal experiment, each participant completed eight driving scenarios with a 2-minute break after the fourth scenario. Subjective evaluations of workload, satisfaction, perceived usefulness, and trust were collected via questionnaire upon completion.
Data Collection and Analysis The experimental dependent variables included participants’ eye movement, electrodermal activity, subjective experience, and driving behavior data. This study selected the road fixation ratio as the eye movement feature, as drivers typically allocate more attention to the road under complex road conditions and high system uncertainty, making eye movement data more representative; the mean and maximum values of skin conductance level and skin conductance response were extracted as electrodermal indicators. Additionally, takeover reaction time, maximum longitudinal deceleration, minimum time to collision, and standard deviation of lateral position were selected as takeover performance metrics (Cao et al., 2021). Specific definitions of the dependent variables are presented in Table 2.
Designing Transparency for Automated Driving: Effects of Ambient Light Cues 597
Table 2: Independent variables and meanings.
Table available in the original PDF paper.
Data Dependent Variable Meaning Eye-tracking data
Road Fixation Ratio
The proportion of total gaze duration directed toward the road center, reflecting drivers’ attention allocation to the driving task
EDA data Skin Conductance Level
The tonic component of electrodermal activity representing general physiological arousal over time
Skin Conductance Response
The phasic change in skin conductance triggered by specific stimuli or events, indicating transient emotional or cognitive activation
Driving data Takeover Reaction Time
The elapsed time between a takeover request and the driver’s initial control input (e.g., steering or braking)
Maximum Longitudinal Deceleration
The peak braking intensity observed during the takeover process, reflecting urgency or control performance
Minimum Time to Collision
The smallest estimated time remaining before a potential collision if current trajectories are maintained
Standard Deviation of Lateral Position
The variability of the vehicle’s lateral position within the lane, representing lane-keeping stability
RESULT
Driving Behavior Data Analysis To comprehensively examine the effects of different independent variable levels on the safety of the driving takeover process, this experiment selected scenarios featuring takeover warnings for analysis. It compared differences across experimental groups in four takeover performance metrics: takeover reaction time, maximum longitudinal deceleration, minimum time to collision, and standard deviation of lateral position.
The ANOVA results revealed that explanation significantly affected takeover reaction time (F(1,78) = 7.567, p = 0.007), minimum time to collision (F(1,78) = 7.636, p = 0.007), and standard deviation of lateral position (F(1,78) = 4.092, p = 0.047). In contrast, ambient light rhythm showed no significant effects on any of the four takeover performance
metrics: takeover reaction time (F(2,78) = 0.629, p = 0.536), maximum longitudinal deceleration (F(2,78) = 1.212, p = 0.303), minimum time to collision (F(2,78) = 0.585, p = 0.560), and standard deviation of lateral position (F(2,78) = 0.035, p = 0.965). Similarly, explanation did not significantly affect maximum longitudinal deceleration (F(1,78) = 1.667, p = 0.200). Furthermore, no significant interaction effects were found between light rhythm and explanation on the takeover performance metrics: takeover reaction time (F(2,78) = 0.182, p = 0.834), maximum longitudinal deceleration (F(2,78) = 1.118, p = 0.332), minimum time to collision (F(2,78) = 0.195, p = 0.823), and standard deviation of lateral position (F(2,78) = 0.577, p = 0.564).
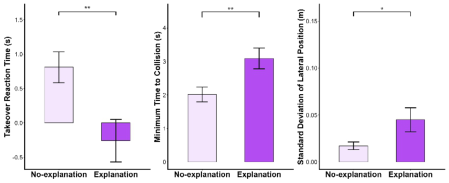
The post-analysis results for takeover reaction time, minimum time to collision and standard deviation of lateral position are shown in Figure 1.
Figure 1: Takeover performance by explanation condition.
Post-hoc analysis of takeover reaction time revealed that participants in the explanation condition demonstrated significantly faster response times, longer minimum time to collision, and greater standard deviation of lateral position compared to the no-explanation group. Furthermore, drivers provided with explanations demonstrated the ability to anticipate takeover warnings and initiate early interventions.
Eye-Tracking Data Analysis Eye-tracking data were analyzed for participants exposed to red ambient lighting (indicating high uncertainty) to calculate the proportion of time spent fixating on the road. Results indicated that neither the rhythm pattern (F(2, 65) = 0.100, p = 0.905), explanation (F(1, 65) = 1.358, p = 0.247), nor their interaction (F(2, 65) = 0.097, p = 0.908) had a significant effect on the proportion of time spent gazing at the road.
EDA Data Analysis The ANOVA on electrodermal activity indicators revealed significant main effects of light rhythm on both mean skin conductance level (F(2,90) = 4.829, p = 0.012) and maximum skin conductance level (F(2,90) = 5.262, p = 0.009). Explanation showed significant main effects on mean skin conductance response (F(1,90) = 4.372, p = 0.042) and maximum skin conductance response (F(1,90) = 5.262, p < 0.001). However, light rhythm demonstrated non-significant effects on mean (F(2,90) = 0.004,
Designing Transparency for Automated Driving: Effects of Ambient Light Cues 599
p = 0.996) and maximum skin conductance response (F(2,90) = 1.109, p = 0.338), while explanation showed non-significant effects on mean (F(1,90) = 0.773, p = 0.384) and maximum skin conductance level (F(1,90) = 0.332, p = 0.567). No significant interaction effects were found between light rhythm and explanation for any electrodermal measures: mean skin conductance response (F(2,90) = 2.254, p = 0.116), maximum skin conductance response (F(2,90) = 5.177, p = 0.784), mean skin conductance level (F(2,90) = 1.691, p = 0.195), and maximum skin conductance level (F(1,90) = 0.679, p = 0.512).
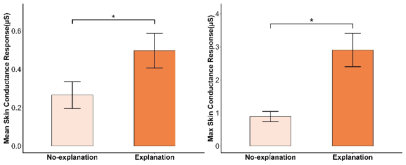
Post-hoc analysis of electrodermal responses, as shown in Figure 2, demonstrated that the explanation group exhibited significantly higher mean skin conductance response and maximum skin conductance response compared to the no-explanation group.
Figure 2: Skin conductance responses by explanation condition.
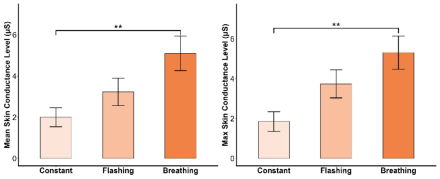
Post-hoc analyses of skin conductance levels across light rhythm conditions are presented in Figure 3. The results indicate that the breathing mode elicited significantly higher mean and maximum skin conductance levels compared to the constant mode. No significant differences were found between the constant and flashing conditions, or between the flashing and breathing modes.
Figure 3: Skin conductance levels by light rhythm condition.
Questionnaire Data Analysis The ANOVA results on questionnaire data revealed significant main effects of light rhythm on workload (F(2,95) = 7.795, p < 0.001) and significant main effects of explanation on acceptance (F(1,96) = 5.921, p = 0.017) and perceived usefulness (F(1,96) = 7.392, p = 0.008). In contrast, no significant effects were found for light rhythm on acceptance (F(2,96) = 0.646,
p = 0.526), satisfaction (F(2,96) = 1.873, p = 0.159), perceived usefulness (F(2,96) = 0.266, p = 0.767), or trust (F(2,96) = 2.518, p = 0.086); explanation showed no significant effects on satisfaction (F(1,96) = 3.183, p = 0.078), workload (F(1,96) = 0.203, p = 0.653), or trust (F(1,96) = 1.865, p = 0.175). Furthermore, no significant interaction effects were observed between light rhythm and explanation for any measured perceptual factors: acceptance (F(2,96) = 0.051, p = 0.822), satisfaction (F(2,96) = 0.157, p = 0.855), perceived usefulness (F(2,96) = 0.412, p = 0.663), workload (F(2,96) = 1.593, p = 0.209), and trust (F(2,96) = 0.087, p = 0.916).
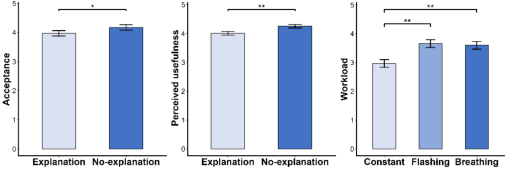
Post-hoc analyses of questionnaire data are presented in Figure 4. The results indicate that participants in the explanation condition reported significantly lower acceptance and perceived usefulness of AV compared to those in the no-explanation condition. Meanwhile, both breathing and flashing light rhythms induced significantly higher workload than the constant mode.
Figure 4: Post-hoc analysis of questionnaire data.
CONCLUSION
This study employed a driving simulator experiment to investigate how ambient light rhythms conveying system uncertainty, together with explanations provided during high uncertainty scenarios, influence drivers’ subjective experience, eye movements, electrodermal activity, and takeover performance.
Analysis of takeover performance showed that drivers receiving explanation demonstrated longer minimum time to collision and faster response times, with some participants anticipating warnings and executing early takeovers. This indicates that explanation enhances drivers’ psychological preparedness for potential risks, leading to more proactive responses. This finding is consistent with Taylor, Wang, and Jeon (2023). However, heightened risk awareness may also increase cognitive load during lateral vehicle control, resulting in reduced stability.
Eye movement analysis showed that breathing and flashing light rhythms did not significantly increase drivers’ road gaze time compared to the constant mode. This finding contrasts with Domenichini, La Torre, Branzi, and Nocentini (2017). Furthermore, providing explanation also failed to improve the proportion of attention allocated to the road. This limitation may stem from the finite nature of human visual attention resources. The constant lighting condition has furnished sufficient information, thereby saturating the drivers’ attention to the road; thus, additional dynamic visual stimuli
Designing Transparency for Automated Driving: Effects of Ambient Light Cues 601
offer limited benefits for further improving attention levels. Consequently, ambient light design should avoid excessive visual load to prevent attention diversion.
Electrodermal response results indicated that both dynamic lighting and explanation significantly elevated skin conductance levels during high uncertainty states, enhancing drivers’ physiological arousal to risk. Explanation likely aids in understanding system state changes, while breathing lights maintain alertness through sustained dynamic variations, thereby prolonging risk perception duration. This finding aligns with Caberletti, Elfmann, Kummel, and Schierz (2010) supports the effectiveness of these transparency mechanisms.
Regarding subjective experience, dynamic light rhythms (e.g. flashing, breathing) induced higher workload. This outcome may be related to enhanced risk perception. Omeiza, Bhattacharyya, Jirotka, Hawes, and Kunze (2025) found that high uncertainty significantly increases driver anxiety, which positively correlated with workload (Greenglass, Burke, & Moore, 2003). Additionally, drivers tended to prefer systems that do not provide explanation, perceiving them as more useful. This is consistent with Ma and Feng (2023). A possible explanation is that ambient lights acted as the primary transparency source in this experimental setup, making additional explanations appear redundant and consequently reducing acceptance and user experience.
In summary, if driving safety is the primary consideration, it is recommended to use breathing ambient lights to indicate uncertain information, supplemented by explanations of the cause during high uncertainty to enhance risk perception and improve the efficiency of driver intervention responses. If user experience is the central focus, constant ambient lights are generally preferred. Balancing safety and user experience requires further exploration in future research.
ACKNOWLEDGMENT
This work was supported by the Guangdong Basic and Applied Basic Research Foundation (grant number: 2024A1515030219) and the Foundation of Shenzhen Science and Technology Innovation Committee (grant number: JCYJ20241202124304007, JCYJ20240813141633044).
REFERENCES
Arrieta, A. B., Díaz Rodríguez, N., Del Ser, J., Bennetot, A., Tabik, S., Barbado, A.,... Benjamins, R. (2020). Explainable artificial intelligence (XAI): Concepts, taxonomies, opportunities and challenges toward responsible AI. Information fusion, 58, 82–115. Caberletti, L., Elfmann, K., Kummel, M., & Schierz, C. (2010). Influence of ambient
lighting in a vehicle interior on the driver’s perceptions. 42(3), 297–311. doi: 10.1177/1477153510370554. Cao, Y., Zhou, F., Pulver, E. M., Molnar, L. J., Robert, L. P., Tilbury, D. M., & Yang, X. J. (2021). Towards standardized metrics for measuring takeover performance in conditionally automated driving: A systematic review. Paper presented at the Proceedings of the human factors and ergonomics society annual meeting.
Chen, J. Y., Procci, K., Boyce, M., Wright, J. L., Garcia, A., & Barnes, M. (2014).
Situation awareness-based agent transparency. De Freitas, J., Agarwal, S., Schmitt, B., & Haslam, N. (2023). Psychological factors underlying attitudes toward AI tools. Nature Human Behaviour, 7(11), 1845–1854. Domenichini, L., La Torre, F., Branzi, V., & Nocentini, A. (2017). Speed behaviour in
work zone crossovers. A driving simulator study. Accident Analysis & Prevention, 98, 10–24. Dzindolet, M. T., Peterson, S. A., Pomranky, R. A., Pierce, L. G., & Beck, H. P.
(2003). The role of trust in automation reliance. International Journal of Human- Computer Studies, 58(6), 697–718. Greenglass, E. R., Burke, R. J., & Moore, K. A. (2003). Reactions to increased workload: Effects on professional efficacy of nurses. Applied Psychology, 52(4), 580–597. Kaufman, R., Costa, J., & Kimani, E. (2024). Effects of multimodal explanations
for autonomous driving on driving performance, cognitive load, expertise, confidence, and trust. Scientific Reports, 14(1), 13061. Koo, J., Kwac, J., Ju, W., Steinert, M., Leifer, L., & Nass, C. (2015). Why did my car just do that? Explaining semi-autonomous driving actions to improve driver understanding, trust, and performance. International Journal on Interactive Design and Manufacturing (IJIDeM), 9, 269–275. Kunze, A., Summerskill, S. J., Marshall, R., & Filtness, A. J. (2019). Automation
transparency: Implications of uncertainty communication for human-automation interaction and interfaces. Ergonomics, 62(3), 345–360. doi: 10.1080/ 00140139.2018.1547842. Lee, S. C., & Jeon, M. (2022). A systematic review of functions and design features of in-vehicle agents. International Journal of Human-Computer Studies, 165, 102864. Ma, J., & Feng, X. (2023). Analysing the Effects of Scenario-Based Explanations
on Automated Vehicle HMIs from Objective and Subjective Perspectives. Sustainability, 16(1), 63. Nastjuk, I., Herrenkind, B., Marrone, M., Brendel, A. B., & Kolbe, L. M.
(2020). What drives the acceptance of autonomous driving? An investigation of acceptance factors from an end-user’s perspective. Technological Forecasting and Social Change, 161, 120319. Omeiza, D., Bhattacharyya, R., Jirotka, M., Hawes, N., & Kunze, L. (2025). A transparency paradox? Investigating the impact of explanation specificity and autonomous vehicle imperfect detection capabilities on passengers. Transportation Research Part F: Traffic Psychology and Behaviour, 109, 1275–1292. Taylor, S., Wang, M., & Jeon, M. (2023). Reliable and transparent in-vehicle agents lead to higher behavioral trust in conditionally automated driving systems. Frontiers in Psychology, 14, 1121622. Waung, M., McAuslan, P., & Lakshmanan, S. (2021). Trust and intention to use
autonomous vehicles: Manufacturer focus and passenger control. Transportation Research Part F: Traffic Psychology and Behaviour, 80, 328–340. Wickens, C. D. (2008). Multiple resources and mental workload. Human Factors, 50(3), 449–455. You, F., Deng, H., Hansen, P., & Zhang, J. (2022). Research on transparency design
based on shared situation awareness in semi-automatic driving. Applied Sciences, 12(14), 7177.
LISTED IN THE AHFE DIGITAL BOOKSTORE CATALOGUE
Explore the complete digital volume
Human Factors in Design, Engineering, and Computing
Read this individual research paper free through the original publisher, or explore the full digital proceedings book.
ISBN 978-1-964867-75-5
Explore this ISBN in the AHFE Bookstore ↗Listed in the July 2026 bookstore catalogue; search by ISBN to confirm current availability · Digital book purchase optional