The factors influencing the visual recognizability of traffic signage are diverse. To study the synergistic effects and critical value models of these visual recognition elements, it is necessary to conduct experiments and collect data on the recognition influence factors. However, data collection based on human testers is limited by experimental conditions, making it difficult to establish large-scale datasets and avoid individual errors.The full-reference algorithm for image quality evaluation is a technique used in the field of computer image recognition to identify image distortions and assess distortion scores. Therefore, this study attempts to apply this method in cross-modal transfer learning, simulating the clarity judgment of drivers for images representing different presentations of multivariable elements. By varying three variables—font height, weight, and recognition distance—this approach simulates signage presentation images at different recognition distances. Using a Back propagation neural network (BPNN) to model signage recognizability and the computer Zernike moment algorithm to simulate recognition for given variable settings, large-scale calculations are performed to analyze the regression curves of recognition variables and compare them with data from human testers.The results show that using computational algorithms to process images with different variables helps analyze the critical points of these variables, significantly improving the accuracy and efficiency of the research. It reduces the individual differences in subjective judgment and can be applied to future studies on visual recognizability experiments.The findings evince that the utilization of computer algorithmic processing of images formulated via distinct variables facilitates the identification of critical points within the variable space, thereby markedly enhancing the precision and efficacy of research endeavors while concurrently mitigating the inherent subjectivity endemic to individual judgments. This paradigm holds promise for future research endeavors germane to visual recognition experimentation.
Urban traffic signage plays a crucial role in ensuring road safety and improving traffic efficiency, as its design and legibility directly influence pedestrians’ and drivers’ understanding of the road environment and their subsequent decision-making processes (Borowsky et al., 2008). In the context of increasingly complex and diverse urban traffic environments, ensuring high recognition and readability of traffic signage text under varying distances, lighting conditions, and environmental contexts has become a
key research issue in the fields of traffic human factors engineering and visual recognition (Babi´c et al., 2020). Although current national or industry standards regulate aspects such as font size, letter spacing, and typeface for traffic signage, the rapid development and widespread adoption of intelligent signage technologies have significantly altered traditional lighting methods and visual recognition principles. As a result, existing research and standards require optimization. However, current studies still exhibit two key shortcomings: first, there is a lack of a systematic, multi-factor coupled evaluation model, which makes it difficult to comprehensively analyze the effects of parameters such as font, character height, distance, and character width; second, there remains a relative scarcity of large-scale sample data collection. Field testing or subjective evaluations by participants are often constrained by time and cost, leading to a lack of quantitative support for recognition performance under boundary or extreme conditions.
In recent years, with the rapid development of artificial intelligence, diverse experimental designs and evaluation methods have been introduced into related research. By combining computer image recognition algorithms with subjective cognitive evaluation methods, and developing controllable multivariable simulation platforms, deep learning algorithms can be applied to perform batch recognition tests on traffic signage images generated in large-scale virtual environments. This approach enables a more refined understanding of the mechanisms by which various visual factors influence recognition, thereby improving data-driven insights into the impact of these factors (Dewi et al., 2020).
Therefore, this study aims to integrate multivariable experimental methods from human factors engineering with automatic recognition algorithms from computer vision to conduct collaborative research on multidimensional parameters such as character height, typeface, font weight, and recognition distance. The study has undertaken the following tasks: (1) Based on human factors experimental data related to traffic signage previously collected by our team, and leveraging computer vision processing technologies, we developed an application capable of randomly adjusting key variables such as character height, font weight, typeface, and observation distance. The application generates and recognizes a large number of traffic signage text images with different variables, creating a comprehensive database. (2) The machine recognition results were cross-verified with subjective evaluation data from a set of actual participants. This not only enhances the external validity of the recognition conclusions, but also allows for the correction or supplementation of the parameter settings in the simulation model to better align with the requirements of real-world road environments.
In summary, this study proposes a research paradigm that combines machine vision with human factors evaluation, offering a reference for the design and assessment of urban road traffic signage, as well as providing an intelligent approach for research in the field of human factors engineering.
LITERATURE REVIEW
Visual Recognition and Ergonomics-Related Research Visual recognition is an important research field in ergonomics. For information carriers such as traffic signs, text readability primarily depends on whether the human eye can quickly perform the basic parsing of visual symbols. Chrysler et al. (2002) explored the relationship between font, character height, font weight, and readability for road traffic signs. Additionally, the research showed that character height is positively correlated with readability. Optimizing the matching of font weight and character height can effectively improve the readability of traffic signs. Kim & Chung (2012) established a scenario composed of vision, reaction time, the number of lanes, and the letter size of traffic signs in each scene from an ergonomics perspective, providing a basis for determining the font size of traffic signs. Meeker et al. (2010) studied the relationship between traffic sign layout character design and reference font size, determining the amount of information in the layout design and its composition arrangement. Lataifeh et al. (2024) used eye-tracking technology for ergonomic research and found that features of road signs, such as information density, content length, lighting, color, placement height, and proximity to speed limits, are significantly related to timely responses and potential traffic hazards. To quantify the collaborative effect of character height and font, Elbardawil’s (2022) study pointed out that the interaction between letter height and font weight has a significant impact on nighttime readability. Tejero et al. (2018) also included letter spacing in their considerations, discussing how increasing the default letter spacing positively affects drivers’ ability to read signs from a distance.The results of the above studies show that visual recognition and text recognition are not determined by a single dimension, but are the result of the interaction of multiple dimensions and stages. Therefore, when studying the readability of urban traffic signs, the collaborative mechanism of multiple factors should be considered.
Application of Computer Vision in Traffic Sign Recognition With the advancement of artificial intelligence and image processing technology, computer vision has received widespread attention in the automatic recognition of traffic signs. In recent years, deep learning (such as CNN, BPNN) and feature extraction techniques have provided new approaches for traffic text recognition under complex conditions. Shustanov & Yakimov (2017) used CNN combined with TensorFlow to train a traffic sign recognition model. The test showed that the final model achieved an accuracy of 99.94%. However, in real-world road video tests, the model needs further optimization to adapt to complex environments. Weng & Chiu (2018) proposed a traffic sign recognition method based on CCL+HOG+SVM, achieving detection and recognition rates of over 90%. The above studies focused on the recognition of sign images, colors, and numbers, without conducting experimental testing on text recognition in signs. Gonzalez et al. (2013) proposed a traffic sign text detection and recognition method based on visual appearance features, using BOVW
Traffic Sign Visual Recognition Study 337
technology to detect traffic signs and classifying sign content using Naïve Bayes and SVM. The results indicated that this method provided higher text detection and recognition accuracy in complex scenarios than traditional methods, making it suitable for automated road sign management.
Above all, existing literature on the readability and recognizability of traffic signs has accumulated rich results. This study aims to further advance on this basis by randomly adjusting multiple text elements and integrating machine vision with ergonomics methods to construct a more complete readability and recognizability evaluation system, providing scientific basis and practical guidance for the standardized design of urban traffic signs in the future.
RESEARCH METHODS AND FRAMEWORK This study aims to explore the mechanisms through which different font thicknesses, character heights, and observation distances affect the readability and recognizability of Chinese traffic sign text. To achieve this, we combined the team’s previous ergonomics experimental data with computer vision recognition algorithms to develop an application capable of automatically generating and recognizing large-scale text images, and we collected key indicators such as clarity and recognition accuracy under multiple variable conditions. The following sections will systematically elaborate on the application design, overall experiment overview, experimental variables and levels, data collection and evaluation indicators, and experimental process.
Application Design This study designed and implemented a comprehensive application integrating ergonomics experimental data and computer vision algorithms. Based on the multi-dimensional ergonomics data obtained earlier, the system constructed a representative training dataset aimed at efficiently measuring and simulating the readability of sign text under large-scale and diverse experimental conditions. The core methodology of the system can be summarized in the following three stages:
Embedding Ergonomics Experimental Data and Constructing the Training Dataset Based on the single-variable ergonomics experimental data collected by our team earlier, a training dataset was established (Figure 1). The data includes indicators such as text recognition accuracy, response time, and subjective ratings for subjects of different age groups under conditions of single font, varying character heights, and diverse observation distances.
Image Generation and Environmental Simulation Processing For any given combination of independent variables (e.g., character height, font thickness, and observation distance), the system automatically generates the corresponding initial text image. To simulate the degradation process of text display effects under different distance conditions, the application
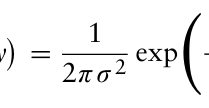
applies Gaussian blur and resolution downsampling to the generated images. Gaussian blur can be defined using the following standard formula (Flusser et al., 2015):
!
−x2 + y2
G x, y
(1)
Equation reproduced from the original PDF.
2σ 2
Figure 1: Input multi-dimensional training dataset.
Here, σ represents the standard deviation, which is appropriately set based on actual observation distance or lighting conditions. Such preprocessing methods effectively restore the visual performance of text under non-ideal conditions. In this study, the σ value is used to simulate the visual blurring effect at different observation distances. The farther the observation distance, the blurrier the text edges captured by the human eye or camera, requiring a larger σ value to replicate this effect. Based on experimental data, an empirical formula can be derived to map the observation distance (d) to the σ value, expressed as: σ = k · d (2)
Here, k is a proportional coefficient calibrated through subsequent recognition evaluation tasks.
Feature Extraction, Recognition Algorithm, and Indicator Output (1) Zernike Moment Feature Extraction After image preprocessing, the system first employs the Zernike moment algorithm to extract the global morphological features of the strokes in the image. Zernike moments exhibit rotational invariance, making them well-suited for describing the shape characteristics of image regions. Their
Traffic Sign Visual Recognition Study 339
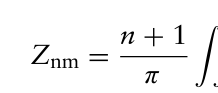
standard calculation formula is given by (Khotanzad & Hong, 1990):
ZZ
V∗
x, y
f
x, y
dxdy (3)
Equation reproduced from the original PDF.
Here, Vnm (x, y) represents the Zernike polynomial, f(x, y) denotes the grayscale distribution of the image, and n and m satisfy the condition that n−| m | is even.
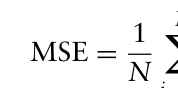
(2) BPNN Recognition The system employs a neural network model based on the BPNN algorithm to train and recognize the extracted features, thereby enabling efficient classification and evaluation of traffic sign text in images. Mean Squared Error (MSE) (Chicco et al., 2021) is commonly used as the loss function in neural network training, defined as:
N X
Equation reproduced from the original PDF.
2 (4)
yi −byi
Equation reproduced from the original PDF.
where yi and byi represent the actual and predicted outputs, respectively, and N denotes the total number of samples. Through iterative optimization and parameter updates, the model effectively maps image features to the corresponding text recognition results with high accuracy.
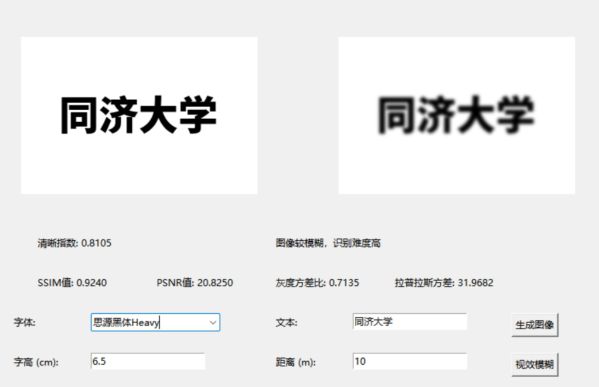
(3) Image Quality Metrics Evaluation To quantify image clarity and text edge sharpness, the system calculates multiple image quality metrics, primarily including Structural Similarity Index (SSIM) (Bakurov et al., 2022), Peak Signal-to-Noise Ratio (PSNR) (Huynh-Thu & Ghanbari, 2022), and Laplacian variance, to quantitatively describe image sharpness and edge definition. PSNR is used to measure image noise levels and is most closely related to blurriness; however, it is not sensitive to structural information, necessitating the combination with SSIM and other metrics. Laplacian variance is employed to assess edge sharpness in images. For text images, edge sharpness provides a more effective measure of blurriness and recognizability compared to noise levels. SSIM evaluates the structural similarity between the blurred image and the original image; however, for complex and simple text, the SSIM threshold requires adaptive adjustment. The application features a user-friendly interface that instantly displays recognition results and related metrics (Figure 2). The entire process, from image generation and feature extraction to model recognition, is fully automated, providing an efficient and quantitative research tool for in-depth exploration of the interaction effects of font design, character height, and observation distance on text readability.
Figure 2: Application interface in operation.
Experimental Overview During the experimental design process, we incorporated insights from human factors research on traffic sign readability and the current traffic regulations regarding Chinese character height. In this study, we conducted multivariable testing on various font weights that had not been examined in previous human factors experiments. Using the four Chinese characters “同济大学” as the base text for image generation, we applied a full-factorial combination approach, generating a total of 1,092 simulated images under different experimental conditions. With the application developed by our research team, the system automatically generates corresponding blurred text images for each condition and applies machine vision algorithms to output image quality metrics and recognition results. Finally, we recorded the output data along with annotation information in an Excel spreadsheet, forming a comprehensive dataset. Given the large number of independent variable levels and the extensive experimental combinations, relying solely on manual recognition and scoring would lead to participant fatigue and make it difficult to complete all test scenarios within a short period. Therefore, this study prioritized automated batch simulations for primary data collection, while selectively conducting manual verification under key experimental conditions to ensure system reliability and external validity.
Experimental Variables (1) Font Weight
For font selection, we used the widely recognized sans-serif typeface— Source Han Sans. Considering the varying font weight in Chinese characters, we selected seven levels of font weight, ranging from thinnest to thickest: ExtraLight, Light, Normal, Regular, Medium, Bold, and Heavy. This
Traffic Sign Visual Recognition Study 341
classification covers the primary stroke variations that may occur in practical applications of urban traffic signage.
(2) Character Height The research team previously conducted human factors experiments focused on the variable of character height. In this study, we aim to cross-validate and expand upon the original experimental data boundaries with the help of computer image recognition algorithms, providing a more comprehensive understanding of the impact of character height on readability. In the experiment, 12 character heights were selected within the range of 25 cm to 100 cm, using 5 cm as the unit, taking into account both conventional and extreme scenarios.
(3) Recognition Distance The reading distance for urban roads varies; some signs need to be recognizable from 30 meters (m), while others must remain legible even at distances of 100 m or beyond. Therefore, this study selected 13 recognition distances ranging from 30 m to 150 m, increasing in increments of 10 m.
Through the full-factorial design of the three aforementioned factors, we obtained more than 1,092 experimental conditions. For each condition, the system generated image quality metrics and recognition results.
Data Collection and Evaluation Metrics To achieve a multidimensional quantification of text readability, we integrated both machine vision detection and human factors subjective evaluation methods, enhancing the interpretability and reference value of the data. In machine vision detection, the system categorized the recognized image results into three types: (1) clear images with easily recognizable text, (2) moderately blurred images with increased recognition difficulty, and (3) severely blurred images that are unrecognizable. These were assigned the numerical codes of 1, 0, and −1, respectively, to quantitatively describe text recognition performance under different conditions.
For specific evaluation metrics, the machine vision component employed multiple image quality assessment parameters. These included the clarity index, which analyzes overall sharpness based on edge information; the structural similarity index (SSIM), which measures the similarity between blurred images and the original in terms of brightness, contrast, and structure (typically ranging from 0 to 1, with values closer to 1 indicating less distortion); the peak signal-to-noise ratio (PSNR), which reflects differences in signal noise between an image and its reference image; the grayscale variance ratio, which quantifies the dispersion of grayscale distribution; and the Laplacian variance, calculated using the Laplacian operator to assess image sharpness. Additionally, under certain key experimental conditions, the research team invited participants to conduct subjective assessments of the text images displayed on screens or projection screens. Participants rated the images based on clarity, readability, and the speed and accuracy of text comprehension. These evaluations helped calibrate system accuracy and validate its applicability in real-world human factors applications.
Experimental Procedure The experimental procedure in this study consists of four stages: variable configuration, image generation and recognition, data recording, and result validation. First, the experimenter inputs the variables, including font weight, character height, and Recognition Distance, into the application according to the pre-designed experimental combination table. For each experimental combination, the system automatically records the “font type,” “character height,” and “recognition distance” and generates the corresponding text image. These images undergo scaling and blurring processes to simulate the visual appearance of real traffic signs under different viewing conditions, especially for distant or large-sized characters.
During the image generation and recognition stage, the system automatically applies a predefined blurring algorithm based on user input to generate the final displayed image. It then employs an integrated character detection and neural network recognition model to process the text in the image while calculating key image quality metrics, such as the clarity index, structural similarity index (SSIM), and peak signal-to-noise ratio (PSNR).The system outputs recognition results, categorizing the text as “recognizable,” “unrecognizable,” or providing specific text recognition results. During the data recording stage, the experimenter compiles the objective metrics and recognition results for each experimental combination into an Excel spreadsheet. Recorded information includes the experiment ID, font type, character height, recognition distance, clarity index, SSIM value, PSNR value, grayscale variance ratio, Laplacian variance, recognition result, and relevant notes. For cases where the image is severely blurred or recognition fails, the system prompts “Image is blurry, recognition is difficult” and records the result as “−1.”
To ensure the reliability of the generated images and recognition results, the research team randomly selected 20 experimental conditions during the result validation stage and invited five participants to conduct recognition tests under actual screen or projection conditions. Comparative analysis indicated that machine recognition results were largely consistent with human subjective judgment, confirming a high level of data quality. After processing all 1,092 records, this study obtained a comprehensive and systematic experimental dataset, providing robust data support for further in-depth analysis of the impact of multi-factor interactions on text readability.
RESULTS AND DISCUSSION
This study, based on computer vision recognition algorithms and experimental data, analyzes the impact of different font weights, character heights, and recognition distances on the readability and recognizability of traffic sign text. The experimental results reveal the effects of key variables on text recognition rates under different combination conditions and quantify the visual characteristics of signage using image quality evaluation metrics.
Traffic Sign Visual Recognition Study 343
Interactive Effects of Character Height, Font Weight, and Recognition Distance (1) The Effect of Font Weight on Recognition Rate
Under different font weight conditions, excessively thin fonts (ExtraLight, Light) perform poorly at greater distances, particularly beyond 50 meters, where the recognition failure rate increases significantly. This may be related to the spatial distribution of font strokes, as thinner strokes tend to lose distinguishability due to pixel down sampling at long distances. In contrast, fonts of Regular weight and Medium exhibit greater recognition stability across different character heights and recognition distances, maintaining a relatively high recognition rate even at farther distances. The recognition performance of Bold and Heavy is relatively poor when the character height is less than 50 cm.
(2) The Effect of Character Height on Recognition Rate The relationship between character height and recognition rate data validates the results of the previous experiments. Further experiments indicate that when the character height exceeds 70 cm, the recognition rate can reach over 80% within a 100-meter recognition distance. However, beyond 100 m, even with a character height of 100 cm, the recognition rate shows a declining trend, suggesting that extreme long-distance conditions still lead to some degree of visual information loss.
(3) The Effect of Recognition Distance on Recognition Rate Increasing recognition distance leads to greater recognition difficulty, particularly beyond 70 m, where even signage with larger character heights is affected. The data indicate that within the 30m–50m range, font recognition success rates are relatively high, with both the clarity index and SSIM values maintaining consistently high levels.
Implications and Future Work This study demonstrates the significant value of computer vision recognition algorithms in quantifying the readability and recognizability of traffic signage. Image quality metrics such as clarity index, SSIM, and PSNR exhibit a positive correlation with recognition success rates, providing a critical basis for optimizing traffic sign design.
Through automated image analysis and large-scale data processing, it is possible to effectively reduce individual errors in subjective evaluations, facilitate multivariable experiments, increase the volume of experimental data, and expand the data boundaries, greatly enhancing the efficiency of the research.
Future work of this study includes: (1) The image processing algorithm used in the experiment was not optimized for varying lighting conditions. Future research could incorporate HDR image enhancement techniques to improve recognition accuracy in low-light environments. (2) The experiment primarily relied on a BPNN model, whereas more advanced deep learning methods may offer superior performance in complex scenarios, making this an important direction for further optimization.
REFERENCES
Bakurov, I., Buzzelli, M., Schettini, R., Castelli, M., & Vanneschi, L. (2022).
Structural similarity index (SSIM) revisited: A data-driven approach. Expert Systems with Applications, 189, 116087. Chicco, D., Warrens, M. J., & Jurman, G. (2021). The coefficient of determination R-squared is more informative than SMAPE, MAE, MAPE, MSE and RMSE in regression analysis evaluation. Peerj computer science, 7, e623. Chrysler, S. T., Carlson, P. J., & Hawkins, H. G. (2002). Nighttime legibility of
ground-mounted traffic signs as a function of font, color, and retroreflective sheeting type (No. FHWA/TX-03/1796-2,). Texas Transportation Institute, Texas A & M University System. Dewi, C., Chen, R. C., & Tai, S. K. (2020). Evaluation of robust spatial pyramid pooling based on convolutional neural network for traffic sign recognition system. Electronics, 9(6), 889. Elbardawil, S. (2022). Legibility research of highway signage typefaces: A critical
review and a potential design-centred approach. The Design Journal, 25(1), 86–103. Flusser, J., Farokhi, S., Höschl, C., Suk, T., Zitova, B., & Pedone, M. (2015).
Recognition of images degraded by Gaussian blur. IEEE Transactions on Image Processing, 25(2), 790–806. Duan Wu, Peng Gao, Dongying Hu, Ran Xu, Yue Qi, Yumeng Zhang (2022).
The Relationship Between Simplified Chinese Character Height and Cognition Research in Signage Design. 13th International Conference on Applied Human Factors and Ergonomics Processing (AHFE), 101–107 Gonzalez, A., Bergasa, L. M., & Yebes, J. J. (2013). Text detection and recognition on traffic panels from street-level imagery using visual appearance. IEEE Transactions on Intelligent Transportation Systems, 15(1), 228–238. Greenhalgh, J., & Mirmehdi, M. (2014). Recognizing text-based traffic signs. IEEE
Transactions on Intelligent Transportation Systems, 16(3), 1360–1369. Kim, S. G., & Chung, B. J. (2012). Determination of Letter Size of Traffic Sign depending on Driver’s Visual Acuity. The Journal of The Korea Institute of Intelligent Transport Systems, 11(6), 155–163. Lataifeh, M., Ahmed, N., Elbardawil, S., & Gordani, S. (2024). Assessing the
Legibility of Arabic Road Signage Using Eye Gazing and Cognitive Loading Metrics. Computers, 13(5), 123. Schnell, T., Yekhshatyan, L., & Daiker, R. (2009). Effect of luminance and text size on information acquisition time from traffic signs. Transportation research record, 2122(1), 52–62. Shustanov, A., & Yakimov, P. (2017). CNN design for real-time traffic sign
recognition. Procedia Engineering, 201, 718–725. Tejero, P., Insa, B., & Roca, J. (2018). Increasing the default interletter spacing of words can help drivers to read traffic signs at longer distances. Accident Analysis & Prevention, 117, 298–303. Weng, H. M., & Chiu, C. T. (2018, April). Resource efficient hardware implementation for real-time traffic sign recognition. In 2018 IEEE International Conference on Acoustics, Speech and Signal Processing (ICASSP) (pp. 1120– 1124). IEEE.
Read this individual research paper free through the original publisher, or explore the full digital proceedings book.
ISBN 978-1-964867-71-7
Explore this ISBN in the AHFE Bookstore ↗Listed in the July 2026 bookstore catalogue; search by ISBN to confirm current availability · Digital book purchase optional