Kei Sato, Noriyuki Kida (2025). Position -specific Differences in Maximal Voluntary Contraction and Rate of Force Development in Collegiate American Football Players. In: Human Factors in Sports, Preventive Medicine and Innovative Agonology. AHFE Open Access, vol. 188, pp. 8–13. https://doi.org/10.54941/ahfe1006476
The ability to rapidly generate a high force is essential for sports performance. Rate of force development (RFD), which reflects the rate of force increase during explosive movements, is important in athletics. This study examined the relationship between maximal voluntary contraction (MVC) and RFD during isometric knee extension and flexion in American collegiate football players, considering position-specific differences.The participants were 25 collegiate American football players (backs; n = 15, linemen; n = 10). Isometric knee extension and flexion were measured using a Biodex dynamometer under the MVC and RFD conditions. RFD was calculated as the slope of the linear regression line from force onset to the breakpoint, which was defined as the time point at which the smallest difference in 30-ms force increments occurred within 270-ms. The MVC and RFD values were normalized to skeletal muscle mass (SMM) and expressed as MVC/SMM and RFD/SMM, respectively.Linemen exhibited higher absolute MVC values for both knee extension (linemen; 185.9 ± 37.6 Nm, backs; 164.6 ± 34.7 Nm) and flexion (linemen; 103.2 ± 23.4 Nm, backs; 99.7 ± 19.1 Nm). However, MVC/SMM was higher in backs (extension; 3.1 ± 0.68 Nm·kg⁻¹, flexion; 1.9 ± 0.38 Nm·kg⁻¹) than in linemen (extension; 3.0 ± 0.5 Nm·kg⁻¹, flexion; 1.7 ± 0.37 Nm·kg⁻¹). RFD was greater in linemen (extension; 1085.3±310.4 Nm·s⁻¹, flexion; 745.6±177.7 Nm·s⁻¹) than in backs (extension; 1022.5±236.9 Nm·s⁻¹, flexion; 662.7±184.9 Nm·s⁻¹). However, RFD/SMM was higher in backs (extension; 19.4±4.4 Nm·kg⁻¹·s⁻¹, flexion; 12.6±3.4 Nm·kg⁻¹·s⁻¹) than in linemen (extension; 18.2±6.3 Nm·kg⁻¹·s⁻¹, flexion; 12.4±3.5 Nm·kg⁻¹·s⁻¹). Linemen exhibited a greater absolute MVC and RFD, indicating the importance of maximal force generation for blocking tasks. Contrastingly, backs demonstrated higher normalized values, suggesting a reliance on efficient force production per unit of muscle mass for agility and rapid movements. These findings underscore the position-specific muscular demands of American football players.
In sports, achieving high performance requires the ability to generate great force. Therefore, maximal muscle strength has traditionally been used as a key metric for evaluating the physical abilities of athletes. However, in many sports, the time available to exert force is shorter than the time required to reach maximal strength, making it difficult to rely solely on this measure. Consequently, the rate of force development (RFD), which is the rate at which force increases over time during explosive movements, has been increasingly recognized as a critical determinant of athletic performance.
Position-Specific Differences in Maximal Voluntary Contraction 9
RFD, particularly in its early phase, is largely affected by neural factors and has a relatively lower correlation with maximal strength. Thus, RFD serves as a valuable indicator of athletic ability and sport-specific performance characteristics. Zushi et al. (2022) examined RFD differences across sports and, revealed that throwers and sprinters exhibited higher RFD values than athletes of ball sport athletes, whereas endurance athletes demonstrated lower RFD values. These findings suggest that RFD shows sport-specific demands and training adaptations, making it an important measure for understanding explosive force capabilities.
Despite its importance, the characteristics of RFD in knee flexion and extension in American football players remain insufficiently explored. Given that American football positions differ significantly in terms of role and body composition, evaluating players solely based on maximal strength may not provide an accurate representation of their capabilities. Therefore, this study aimed to investigate MVC and RFD in American football players while considering position-specific differences in force production.
METHOD
The participants in this study were 25 collegiate American football players (backs: n = 15; linemen: n = 10). Isometric knee extension and flexion strength were measured using a fixed dynamometer (BIODEX System 2, Biodex Medical Systems). The knee joint angle was set to 60
for extension and 90
for flexion.
Each participant performed two trials under a maximum strength condition, in which they were instructed to reach their maximum force within 4s. They also performed four trials under the maximum rate of force development (RFD) condition, in which they were encouraged to achieve maximum force output as quickly as possible. Adequate rest periods were provided for all the trials. Collected force data were smoothed using a three- point moving average and then filtered using a sixth-order, zero-phase-lag Butterworth digital filter at a cutoff frequency of 25 Hz (Zushi, 2022).
To select the trial used for RFD calculation, the moment when the first derivative of the force-time curve (i.e., the rate of change of force) dropped to < 0 was identified. Force value at that point was divided by the time required to reach it, and the trial with the largest resulting value was chosen for further analysis.
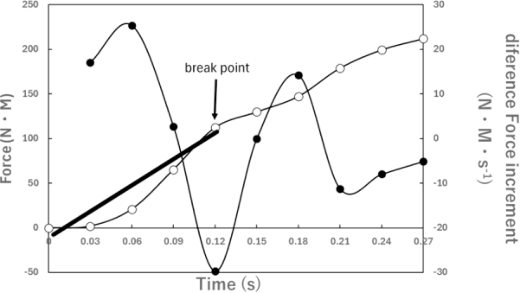
For the filtered data, changes in force within the first 270 ms after force onset were calculated in 30-ms increments. A force-increment–time curve was then generated, and the difference in force increments at each 30-ms interval was examined. The time point at which this difference in force increment was smallest was defined as the “breakpoint.” From force onset to this breakpoint, a linear regression was performed on the force values measured at each 30-ms interval, and the slope of this regression line was taken as the RFD (Figure 1).
To control for morphological factors such as skeletal muscle mass (SMM) and muscle cross-sectional area, the values for maximum voluntary contraction (MVC) and RFD were normalized by dividing them by each participant’s SMM. Although body mass has often been used for normalization in many previous studies, it was deemed more appropriate
10 Sato and Kida
here to use SMM, considering that linemen generally have a higher body- fat percentage than their backs. Normalized indicators, MVC/SMM and RFD/SMM, were calculated, and these relative values were compared with the absolute values to evaluate the influence of muscle mass on force production.
Additionally, to investigate the relationship between force production characteristics and actual athletic performance, 40-yard dash times were measured using a photoelectric timing system, and running velocity (m/s) was calculated. These measurements allowed for the analysis of the effect of MVC and RFD on short-distance sprint performance.
Figure 1: White circles show forces at specific time points (0, 0.03, 0.06, …, 0.27 s). Black circles show the difference in increment of force per 0.03 s. Break point: the points in the time when this difference was minimum which, proposed by the arrow and dotted line. RFD: The slope of regression line calculated with white circles from 0 s to the break point.
RESULTS
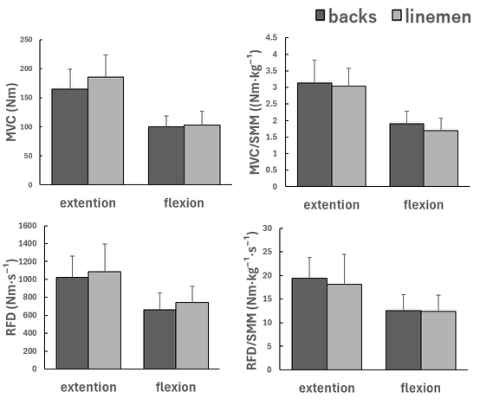
Figure 2 illustrates the mean values of MVC, RFD, MVC/SMM, and RFD/SMM for knee extension and flexion in both the linemen and backs.
MVC was higher in linemen (extension; 185.9 ± 37.6 Nm, flexion; 103.2 ± 23.4 Nm) than that in backs (extension; 164.6 ± 34.7 Nm, flexion; 99.7 ± 19.1 Nm). However, MVC/SMM was higher in backs (extension; 3.1 ± 0.68 Nm·kg−1, flexion; 1.9 ± 0.38 Nm·kg−1) than that in linemen (extension; 3.0 ± 0.5 Nm·kg−1, flexion; 1.7 ± 0.37 Nm·kg−1).
RFD was greater in linemen (extension; 1085.3 ± 310.4 Nm·s−1, flexion; 745.6 ± 177.7 Nm·s−1) than that in backs (extension; 1022.5 ± 236.9 Nm·s−1, flexion; 662.7 ± 184.9 Nm·s−1). However, RFD/SMM was higher in backs (extension; 19.4 ± 4.4 Nm·kg−1·s−1, flexion; 12.6 ± 3.4 Nm·kg−1·s−1) than that in linemen (extension; 18.2 ± 6.3 Nm·kg−1·s−1, flexion; 12.4 ± 3.5 Nm·kg−1·s−1).
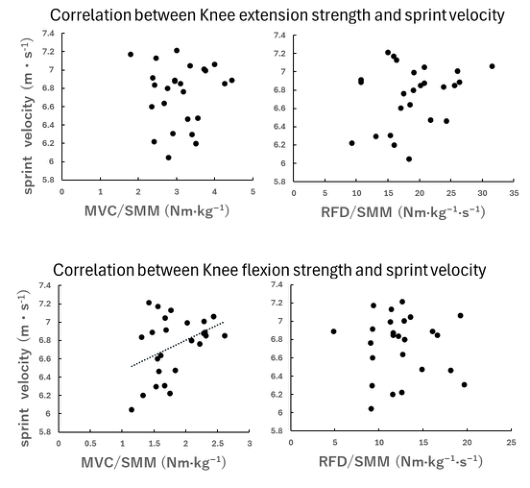
Figure 3 illustrates the correlation between 40-yard sprint speed and MVC/SMM and RFD/SMM for knee extension and flexion. A positive correlation was observed between MVC/SMM and RFD/SMM in extension (MVC/SMM; r = 0.04, RFD/SMM; r = 0.27) and between MVC/SMM in flexion (MVC/SMM; r = 0.40, RFD/SMM; r = −0.03).
Position-Specific Differences in Maximal Voluntary Contraction 11
Figure 2: Mean (± SD) values of maximal voluntary contraction (MVC), rate of force development (RFD), MVC normalized by skeletal muscle mass (MVC/SMM), and RFD normalized by skeletal muscle mass (RFD/SMM) for knee extension and flexion in linemen and backs.Figure 3: Scatter plots illustrating the relationships between sprint velocity (m·s−1) and knee extension (top row) or knee flexion (bottom row) strength indices, expressed as maximal voluntary contraction (MVC) normalized by skeletal muscle mass (MVC/SMM; left panels) and rate of force development (RFD) normalized by skeletal muscle mass (RFD/SMM; right panels). Each dot represents an individual participant, and the dotted line indicates the linear regression for each relationship.
12 Sato and Kida
DISCUSSION
In this study, we examined the maximal voluntary contraction force (MVC) and the rate of force development (RFD) in knee extension and flexion among American football players, and investigated the relationship between these strength characteristics, sprint performance, and playing positions (linemen vs. backs). The results revealed that linemen exhibited higher absolute MVC and RFD values than backs in both knee extension and flexion. However, when these parameters were normalized to skeletal muscle mass (SMM)— that is, MVC/SMM and RFD/SMM—backs showed higher values than those linemen.
A previous study suggested that skeletal muscle mass is a major determinant of maximal strength (MVC) (Zushi et al., 2022), and in our study, the larger muscle mass observed in linemen appears to have contributed to their superior absolute MVC. Linemen primarily engage in blocking and pushing against opposing players, requiring them to exert a high level of force against external resistance for relatively extended periods. These results imply that absolute MVC plays a particularly important role in the performance of linemen. However, because this study did not directly measure on-field movements or the duration of force application, it remains unclear how consistently they utilize maximal strength during actual gameplay. Future studies should analyze force application patterns and contact durations during blocking or tackling movements to better understand how linemen employ maximal strength.
In contrast, backs frequently undergo rapid changes in direction and sprint, necessitating high force output in a short amount of time. According to the findings of Zushi et al. (2022), explosive force production (RFD) can vary based on the demands of different sports. Similarly our study found that backs exhibited higher MVC/SMM and RFD/SMM, which correlated with their sprint performance (40-yard dash). This suggests that greater force output per unit of muscle mass may facilitate quick acceleration and direction. Notably, RFD is thought to be highly dependent on neural factors (e.g., motor unit recruitment and firing frequency) (Aagaard et al., 2002), indicating that it is a useful measure for assessing the neural performance required for force production in backs, which must achieve maximal output within a short time frame.
Based on these findings, it is crucial to design training programs that reflect the unique strength profiles of each position. For linemen, high-load resistance training can be particularly effective for boosting maximal strength, consistent with a previous study (e.g., Stone et al., 2006), underscoring that maximal strength underpins power output. In contrast, incorporating plyometric or ballistic training to improve RFD seems beneficial for backs (Cormie, McGuigan, & Newton, 2011), as these drills target rapid force production. Such position-specific approaches are expected to enhance the overall performance of the team.
Although this study assessed MVC and RFD under isometric conditions in a laboratory setting and provided insights into positional differences, it did not fully compare these measures with actual game movements or field tests.
Position-Specific Differences in Maximal Voluntary Contraction 13
Investigating the specific time frames in which linemen and backs exert force and, the degree of contact and acceleration during competition, would offer more practical guidance for training interventions.
CONCLUSION
Our findings suggest that American football players exhibit position-specific differences in MVC and RFD. Linemen capitalize on their greater skeletal muscle mass to achieve higher absolute MVC, whereas backs rely on their superior force production per unit muscle mass (i.e., higher RFD) to excel in explosive movements such as sprints. Recognizing these distinct performance demands and tailoring strength training programs accordingly could be key in optimizing overall team performance.
REFERENCES
Aagaard, P., Simonsen, E. B., Andersen, J. L., Magnusson, P., & Dyhre-Poulsen, P.
(2002). Increased rate of force development and neural drive of human skeletal muscle following resistance training. Journal of Applied Physiology, 93(4), 1318– 1326. Cormie, P., McGuigan, M. R., & Newton, R. U. (2011). Developing maximal neuromuscular power: Part 2—Training considerations for improving maximal power production. Sports Medicine, 41(2), 125–146. Stone, M. H., O’Bryant, H. S., McCoy, L., Coglianese, R., Lehmkuhl, M., & Schilling,
B. (2006). Power and maximum strength relationships during performance of dynamic and static weighted jumps. Journal of Strength and Conditioning Research, 20(4), 967–971. Zushi, K., Kariyama, Y., Yoshida, T., Zushi, A., Ohyama-Byun, K., & Ogata, M.
(2022). The sport event specificity of explosive force production capacity quantified according to the isometric rate of force development during unilateral leg extension. Taiikugaku Kenkyu (Japan Journal of Physical Education, Health and Sport Sciences), 67, 91–102.
LISTED IN THE AHFE DIGITAL BOOKSTORE CATALOGUE
Explore the complete digital volume
Human Factors in Sports, Preventive Medicine and Innovative Agonology
Read this individual research paper free through the original publisher, or explore the full digital proceedings book.
ISBN 978-1-964867-64-9
Explore this ISBN in the AHFE Bookstore ↗Listed in the July 2026 bookstore catalogue; search by ISBN to confirm current availability · Digital book purchase optional